Do Separated Bike Lanes Increase Bike Share Traffic? Using ArcGIS Pro and ArcPy to determine Hamilton Bike Share’s Ridership Changes
Hi everyone! It’s been a while since my last post, but I’ve been busy working on a component of my MSc thesis at McMaster’s TransLAB (Transportation Research Lab). The research is investigating the impacts of separated cycling infrastructure on Hamilton Bike Share ridership, along the affected road links.
Active Transportation, and particularly cycling, are becoming increasingly important in Canadian transportation planning — with a growing push for multi-modal transportation networks that allow the urban resident to not need to use a personal automobile to accomplish all of their daily tasks or recreation trips. Bike Share systems like Hamilton Bike Share, which provide rentable bicycles from designated docking stations (“hubs”), allow an individual to rent a bicycle from one hub, undertake a trip, and then dock the bike at a hub when they are finished. These systems can be extremely important for trips of all types, and can serve as both a means of last-mile trip modes (perhaps for an individual whose bus stop is still a kilometer away from their place of work). recreational cycling trips, and perhaps most importantly, to normalize cycling with the greater population, within the urban area (Goodman et al., 2014). Many cities are looking for ways to encourage cycling, and beyond Bike Share Systems, increasing and improving dedicated cycling infrastructure — making it easier for a cyclist of varying ability to get from point A to B in a city safely — is seeing a rise in investment from municipalities (Pucher et al., 2011; Wilson & Mitra, 2020). Infrastructure is not cheap; the City of Hamilton’s capital budget in 2021 alone contained $3 million in cycling network investments, including the construction of several separated cycling tracks along road links in the city (Mann, 2021).
With infrastructure costing so much, and with such a growing push by municipalities to increase their cycling mode share, this begs the question: do these projects actually encourage more bike share cycling?
I’m so glad you asked! The first component of my thesis is looking at exactly this; and ArcGIS Pro and the ArcPy Python library played a huge role in its methods.

Generating Hamilton Bike Share users’ routes:
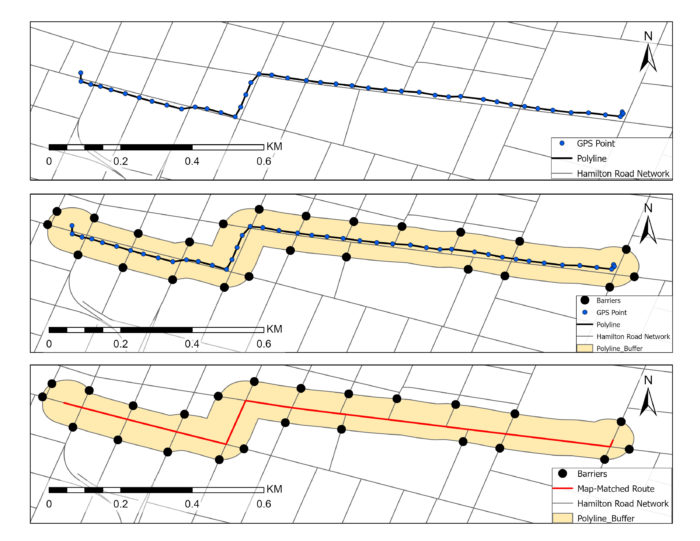
You might have read some posts by other ECCE student associates like Raj, who have described this process before. Each of Hamilton Bike Share’s more than 825 rentable bikes is GPS-equipped. This means that when someone rents the bike, a GPS trajectory (XY points) for their ride is registered from their origin hub, to their destination hub. This research used all valid Hamilton Bike Share trips, and their associated GPS trajectories, from January 1st, 2019, to March 31st, 2022: a total of 516,102 valid trips with GPS trajectories were logged. These trip logs and GPS trajectories were used as inputs in Dalumpines & Scott’s (2018) GIS-Based Episode Reconstruction Toolkit, and Dalumpines & Scott’s (2011) map-matching algorithm. This workflow converted the GPS points into polyline shapefiles, which represented the bikeshare user’s actual trip along Hamilton’s road and cycling network. After processing, a total of 495,084 trajectories were successfully map-matched. All of these shapefiles were carried forward into the analysis.

Who used the separated infrastructure?
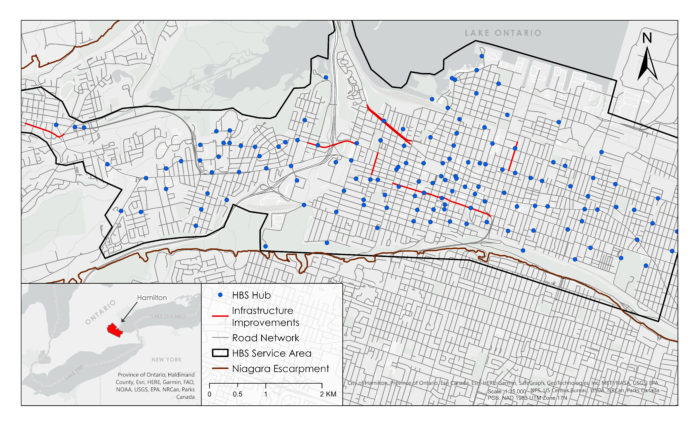
Answering this question was surprisingly easy, given both the data and ArcGIS Pro and ArcPy’s capabilities. Using data on separated cycling infrastructure (“interventions”) built between 2019 and 2022 from the City of Hamilton, I created a line feature class of all the interventions. The map below shows each of the infrastructure interventions contained in the study.

Finding out who used each segment before and after the bike infrastructure was built was computed using an Intersection. Using an intersection not only combined the attributes of the bike lane feature class and the map-matched route, it also kept only the intersected features. Hence, I could calculate the length of overlap in kilometers. This length (which was labelled Bicycle Kilometers Travelled), eventually became the dependent variable my modelling work. The trickiest part of this was efficiently processing nearly half a million of these intersections; this is where ArcPy was extremely helpful.
Each month of route shapefiles was stored in a separate folder, and the python function created looped through all of the route shapefiles, computing its intersection with the separated cycling infrastructure, and saving the intersection feature class in a geodatabase. From there, a second python function, which also leveraged the Pandas library, was created to iterate through all of the intersection feature classes in each month’s geodatabase, convert the feature class’s table to a CSV file, and append the records of each CSV file into a dataframe. Once all of the intersections in the geodatabase were processed, a final CSV file was written, with the intersection logs of each route for that particular month. The code below shows a component of the script, which was used to generate the intersections.
routes = "C:/Year/Month"
Infra = "C:/SampleGDB.gdb/Interventions"


def intersections(year, month):
    """Iterates through weeks of each month, intersecting MM routes with infrastructure FC,
exporting the attribute table to a pandas dataframe, and appending the entries to a parent
dataframe"""

   ap.CreateFileGDB_management("C:/GDBs", str(month) + str(year) + ".gdb")
   ap.env.workspace = str(routes)

   weeks = ap.ListWorkspaces()

   for week in weeks:  # In months, iterate through weeks
       ap.env.workspace = week
       FCs = ap.ListFeatureClasses()
       counter = 0
       for FC in FCs:
           ap.Intersect_analysis([FC, Infra],
                              "C:/GDBs/" + str(month) + str(year) + ".gdb"
                              + "/Int" + str(ap.Describe(FC).baseName), join_attributes="NO_FID")
           counter = counter + 1
           print('Int ' + str(counter) + ' of ' + str(len(FCs)) + ' completed.')


intersections(2022, "January")
Believe it or not, processing nearly 500,000 routes like this took only a couple of days, and that is thanks to the capabilities of ArcPy for efficient Big Data geoprocessing. Having everything in CSV format after all of the geoprocessing made modelling the data more straightforward, and it enabled the information to be easily analyzed and manipulated in other software platforms like R.
I’ll be following up on this post with one that contains information on the results of this paper, and how ArcGIS Pro and ArcPy have enabled even more detailed analyses of the ridership effects of these infrastructure projects. Stay tuned!
Works Cited:
Goodman, A., Green, J., & Woodcock, J. (2014). The role of bicycle sharing systems in normalising the image of cycling: An observational study of London cyclists. Journal of Transport & Health, 1(1), 5–8. https://doi.org/10.1016/j.jth.2013.07.001
Mann, K. (2021). “More and safer bike lanes planned for Hamilton in 2021.” 900 CHML, Global News, <https://globalnews.ca/news/7570919/more-safer-bike-lanes-hamilton-2021/> (Nov. 18, 2021).
Pucher, J., Buehler, R., & Seinen, M. (2011). Bicycling renaissance in North America? An update
and re-appraisal of cycling trends and policies. Transportation Research Part A: Policy and
Practice, 45(6), 451–475. https://doi.org/10.1016/j.tra.2011.03.001
Wilson, A., & Mitra, R. (2020). Implementing cycling infrastructure in a politicized space: Lessons
from Toronto, Canada. Journal of Transport Geography, 86, 102760.
https://doi.org/10.1016/j.jtrangeo.2020.102760
Images:
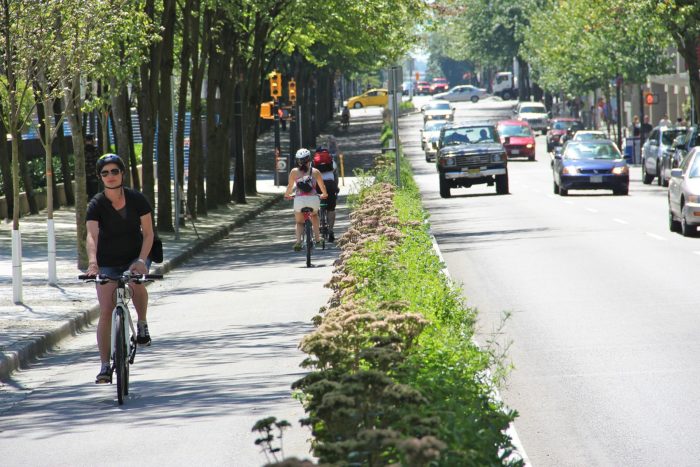
Krueger, P. (2011). Hornby Street Separated Bike Lane. Retrieved October 18, 2022, from https://commons.wikimedia.org/wiki/File:Hornby_Street_Separated_Bike_Lane.jpg.
