
Are Dominant Routes the Safest Routes in a Bike Share System? An Investigation of Hamilton Bike Share using Weighted Level of Traffic Stress
This post is a very quick overview of the research I am conducting at McMaster University in the Transportation Research Lab for my first paper on Level of Traffic Stress
Introduction
In recent years, many cities around the world have extended their pedestrian and cycling infrastructure, resulting in benefits to health, mobility, and the environment (Health Canada, 2014; Ryu et al., 2018). Bike share systems have emerged and grown in popularity across several Canadian cities, including Montréal, Ottawa-Gatineau, Toronto, Hamilton, and Vancouver (Hosford and Winters, 2018). While cycling is a physical activity with recognized benefits, injury events do occur. Between 2006 and 2017, 890 cyclists died in Canada, averaging 74 deaths per year. As a result, multiple transportation agencies have shifted their primary area of focus on improving cyclist safety by reducing traffic stress.
Traffic stress is a combination of perceived dangers and stressors to cyclist safety associated with cycling close to vehicular traffic. Level of Traffic Stress (LTS) is a classification scheme developed to categorize traffic stress into 1 of 4 categories based on cycling infrastructure and road attributes:
- LTS 1 – safe for children
- LTS 2 – tolerable by the mainstream adult population
- LTS 3 – tolerable by cyclists who are ‘enthused and confident’
- LTS 4 – tolerable only by those characterized as ‘strong and fearless’ riders
This classification scheme has been successfully used for planning purposes across North America, including Baltimore, Delaware, and Atlanta. Adaptions of this original LTS method have been developed to overcome data deficiencies and to account for differences in roadway infrastructure between cities. Researchers have used LTS to assess cycling connectivity, accessibility, and safety. My research focuses on using LTS to understand the route choice behaviour of Hamilton Bike Share cyclists. This is accomplished by developing, processing, and comparing dominant routes and lowest Weighted Level of Traffic Stress (WLTS, described below) routes between multiple hub pairs.
Route Development
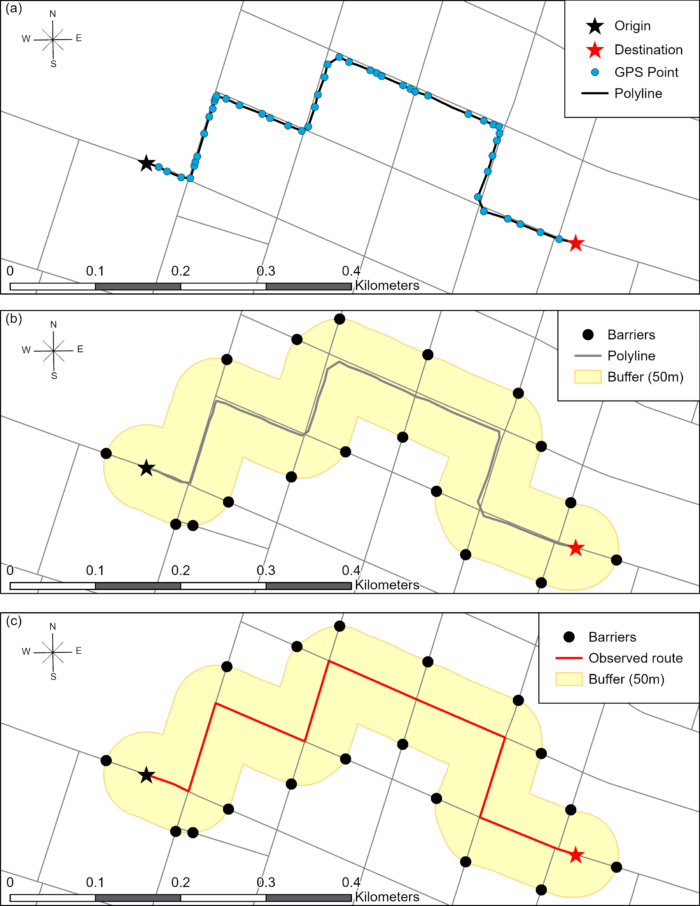
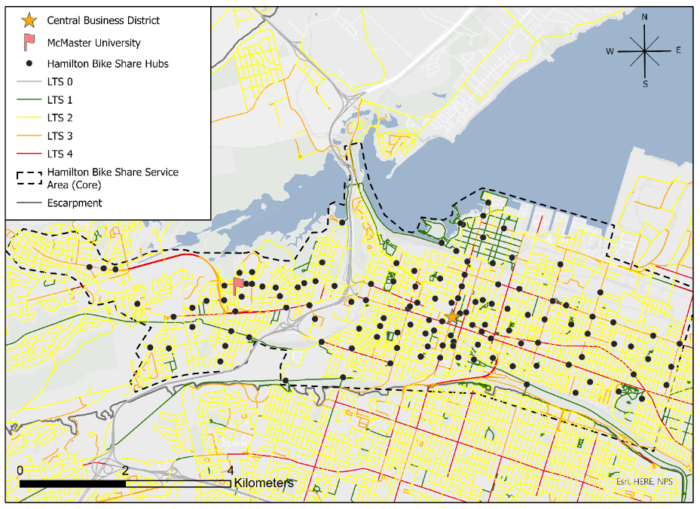
Hamilton Bike Share (HBS) provides bikes and software that allow riders to use 825 smart bikes across over 20 square kilometers of Hamilton. HBS bicycles are GPS-equipped meaning each bicycle’s XY coordinates are recorded in real-time. GPS data of all trips in the year 2019 (from January 1st to December 31st) were obtained from Hamilton Bike Share and analyzed using the map-matching algorithm. The GIS-based Episode Toolkit (GERT) and map-matching algorithm developed by Dalumpines and Scott (2011, 2018) for ArcGIS were used to convert cycling GPS trajectories from Hamilton Bike Share bicycles into polyline routes on the cycling network. To summarize, this tool identifies the start and stop locations of each trip and generates a polyline between both points based on intermediate GPS points comprising the trip. To ensure the correct path is developed, a 50-meter buffer around each GPS point is developed to constrain route development. To read more about the map-matching algorithm, click here.
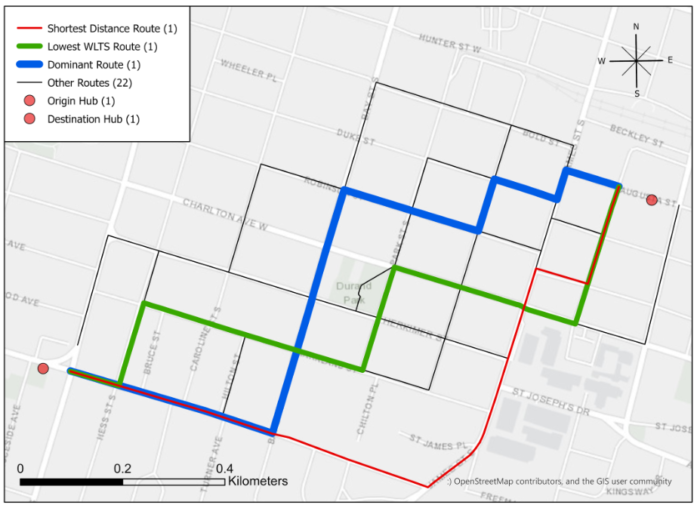
The original 2019 dataset contained 252,310 trips describing the actual routes of bike-share users. Upon processing using the map-matching algorithm, a total of 241,036 trips grouped by OD hub pairs (origin-destination bicycle racks) were created. Of the total trips processed, dominant routes and the lowest WLTS routes for each hub pair were identified. Dominant routes capture the preferred routing behavior of cyclists between hub pairs given that the usage frequency of dominant routes is greater than all other routes. The original 2019 dataset contained 252,310 trips describing the actual routes of bike-share users. Upon processing using the map-matching algorithm, a total of 241,036 trips grouped by OD hub pairs (origin-destination bicycle racks) were created. Of the total trips processed, dominant routes and the lowest WLTS routes for each hub pair were identified. Dominant routes capture the preferred routing behavior of cyclists between hub pairs given that the usage frequency of dominant routes is greater than all other routes.
Building an LTS Network
In my previous post, I described how to build an LTS network using R and ArcMap. Since then, I have switched to using ArcGIS Pro and python to build a new LTS network for the City of Hamilton. These changes helped improve processing speed, provide seamless data integration and increase data accuracy. LTS was calculated for each road segment and appended as a variable to the cycling network based on LTS criteria. LTS criteria are defined separately for different street types – roads with mixed traffic, roads with cycling infrastructure along parking lanes, and roads with cycling infrastructure not along parking lanes (Imani et al., 2019; Furth et al., 2016). An adapted LTS classification scheme was developed to accommodate the Canadian metric system and to supplement some missing data for my research. Functions were developed in python based on the scheme and the output was an LTS rating for each road segment. Upon processing, LTS 2 makes up 67% of all network links, followed by LTS 3 (13%), LTS 1 (10 %), and LTS 4 (5%).
An additional variable was developed for the LTS network called Weighted Level of Traffic Stress (WLTS). WLTS is an impedance variable used to capture the traffic stress of a route. WLTS was calculated by multiplying the LTS of each road segment by its subsequent length in meters. WLTS and length were then assigned as impedance variables used to develop the lowest WLTS routes between hub pairs. The lowest WLTS routes function as the lowest traffic stress routes or the safest routes.
Results
A paired t-test is used to compare the mean difference between the dominant routes and the lowest WLTS routes. Here are some of the key findings:
- Only 9% of dominant routes are equivalent to lowest WLTS routes (suggesting Hamilton Bike Share cyclists may not choose routes to minimize traffic stress between hub pairs)
- The average speed in kilometers per hour, number of lanes, and average daily traffic (vehicles / 24 hours) are significantly higher on dominant routes compared to lowest WLTS routes
- The average number of turns (5.68) on dominant routes is significantly lower than that on lowest WLTS routes (7.01)
- 57% of dominant routes are comprised of minor roads while 36% are major roads. 77% of lowest WLTS routes are comprised of minor roads while 15% are major roads.
- The distance travelled between dominant routes and lowest WLTS routes are not statistically different (dominant routes are 1% shorter) but by taking the dominant route over the lowest WLTS route between a hub pair, HBS cyclists are increasing traffic stress by 15%
Conclusion
I believe the greatest takeaway from this research is that HBS cyclists may not choose routes to minimize traffic stress or travel distance. Instead, cyclists may choose dominant routes for other route variables. Some of these variables are outlined in the paper (which we hope to publish soon). This paper will be the first paper to analyze route choice behaviour based on a new impedance variable called Weighted Level of Traffic Stress (WLTS). Additionally, it is one of the first papers to make use of LTS to better understand cycling behaviour based on GPS data. In the future, we hope to use WLTS to better understand collisions and cycling safety. You can read more about LTS here and maybe in a future post, I will be able to reference a published paper of mine! For a few more visuals, and other presentations, check out the GIS day videos developed by students, professors, and colleagues at McMaster University by clicking here.
Citations
Brown, M.J., Scott, D., Paez, A. (2020). Link-focused prediction of bike share trip volume using GPS data: A GIS based approach. YTRA-S-20-00322.pdf. (Accessed July 10, 2020).
Dalumpines, R., Scott, D.M. (2011). GIS-based Map-matching: Development and Demonstration of a Postprocessing Map-matching Algorithm for Transportation Research. In: Gertman, S., Reinhardt, W., Toppen, F. (Eds.), Advancing Geoinformation Science for a Changing World. Springer, Berlin, 101–120.
Dalumpines, R., Scott, D.M. (2018). GIS-based episode reconstruction toolkit (GERT): a transferable, modular, and scalable framework for automated extraction of activity episodes from GPS data. Travel Behaviour and Society, 11, 121–130.
Furth, P.G, Putta, T. V. V. K., Moser, P. (2018). Measuring low-stress connectivity in terms of bike-accessible jobs and potential bike-to-work trips A case study evaluating alternative bike route alignments in northern Delaware. Journal of Transport and Land Use, 11, 815 – 831.
Health Canada. (2014). Active transportation. Retrieved from https://www.canada.ca/en/public-health/services/being-active/active-transportation.html. (Accessed January 19, 2020).
Hosford, K. & Winters, M. (2018). Who Are Public Bicycle Share Programs Serving? An Evaluation of the Equity of Spatial Access to Bicycle Share Service Areas in Canadian Cities. Transportation Research Record, 2672,42 – 50.
Imani, A.F., Miller, E.J., Saxe, S. (2019). Cycle accessibility and level of traffic stress: A case study of Toronto. Journal of Transport Geography, 80, 1-10.
Ryu, S., Chen, A., Su, J., & Choi, K. (2018). Two-stage bicycle traffic assignment model. Journal of Transportation Engineering Part A: Systems, 144, 1- 13.