
Analyzing the Change in Toronto Crime Data from COVID-19
About a year ago, I wrote a blog post analyzing Toronto Crime Data using Kernel Density from the 2019 data of major crime indicators. After the COVID-19 restrictions were put in place in March 2020 for the city of Toronto, I was curious to see the changes in crime in Toronto from 2019 to 2020. Luckily the 2020 data has been released, and in this blog, I will analyze the major crime indicators for Toronto from 2019 to 2020 to see if there was a decrease in crime after the COVID-19 restrictions were put in place.
Major Crime Indicators
Similar to my 2019 blog, I’m using data that the Toronto Police Service releases for Toronto crime data. The major crime indicators include: Assault, Auto Theft, Break and Enter, Robbery, Theft Over $5000, Homicide, and Shootings. Note that I did not display the Shootings data in my 2019 blog. This data released by the Toronto Police Service consists of a Toronto Neighbourhoods Boundary File of all 140 Toronto neighbourhoods with counts and crime rates per 100,000 people. The population is based on projection population by Environics Analytics.
Analysis & Discussion
To analyze the changes in Toronto crime from 2019 to 2020, I used various methods, including exploring the total crime, the neighbourhood crime rates, and calculating the percent change from 2019 to 2020.
Total Toronto Crime
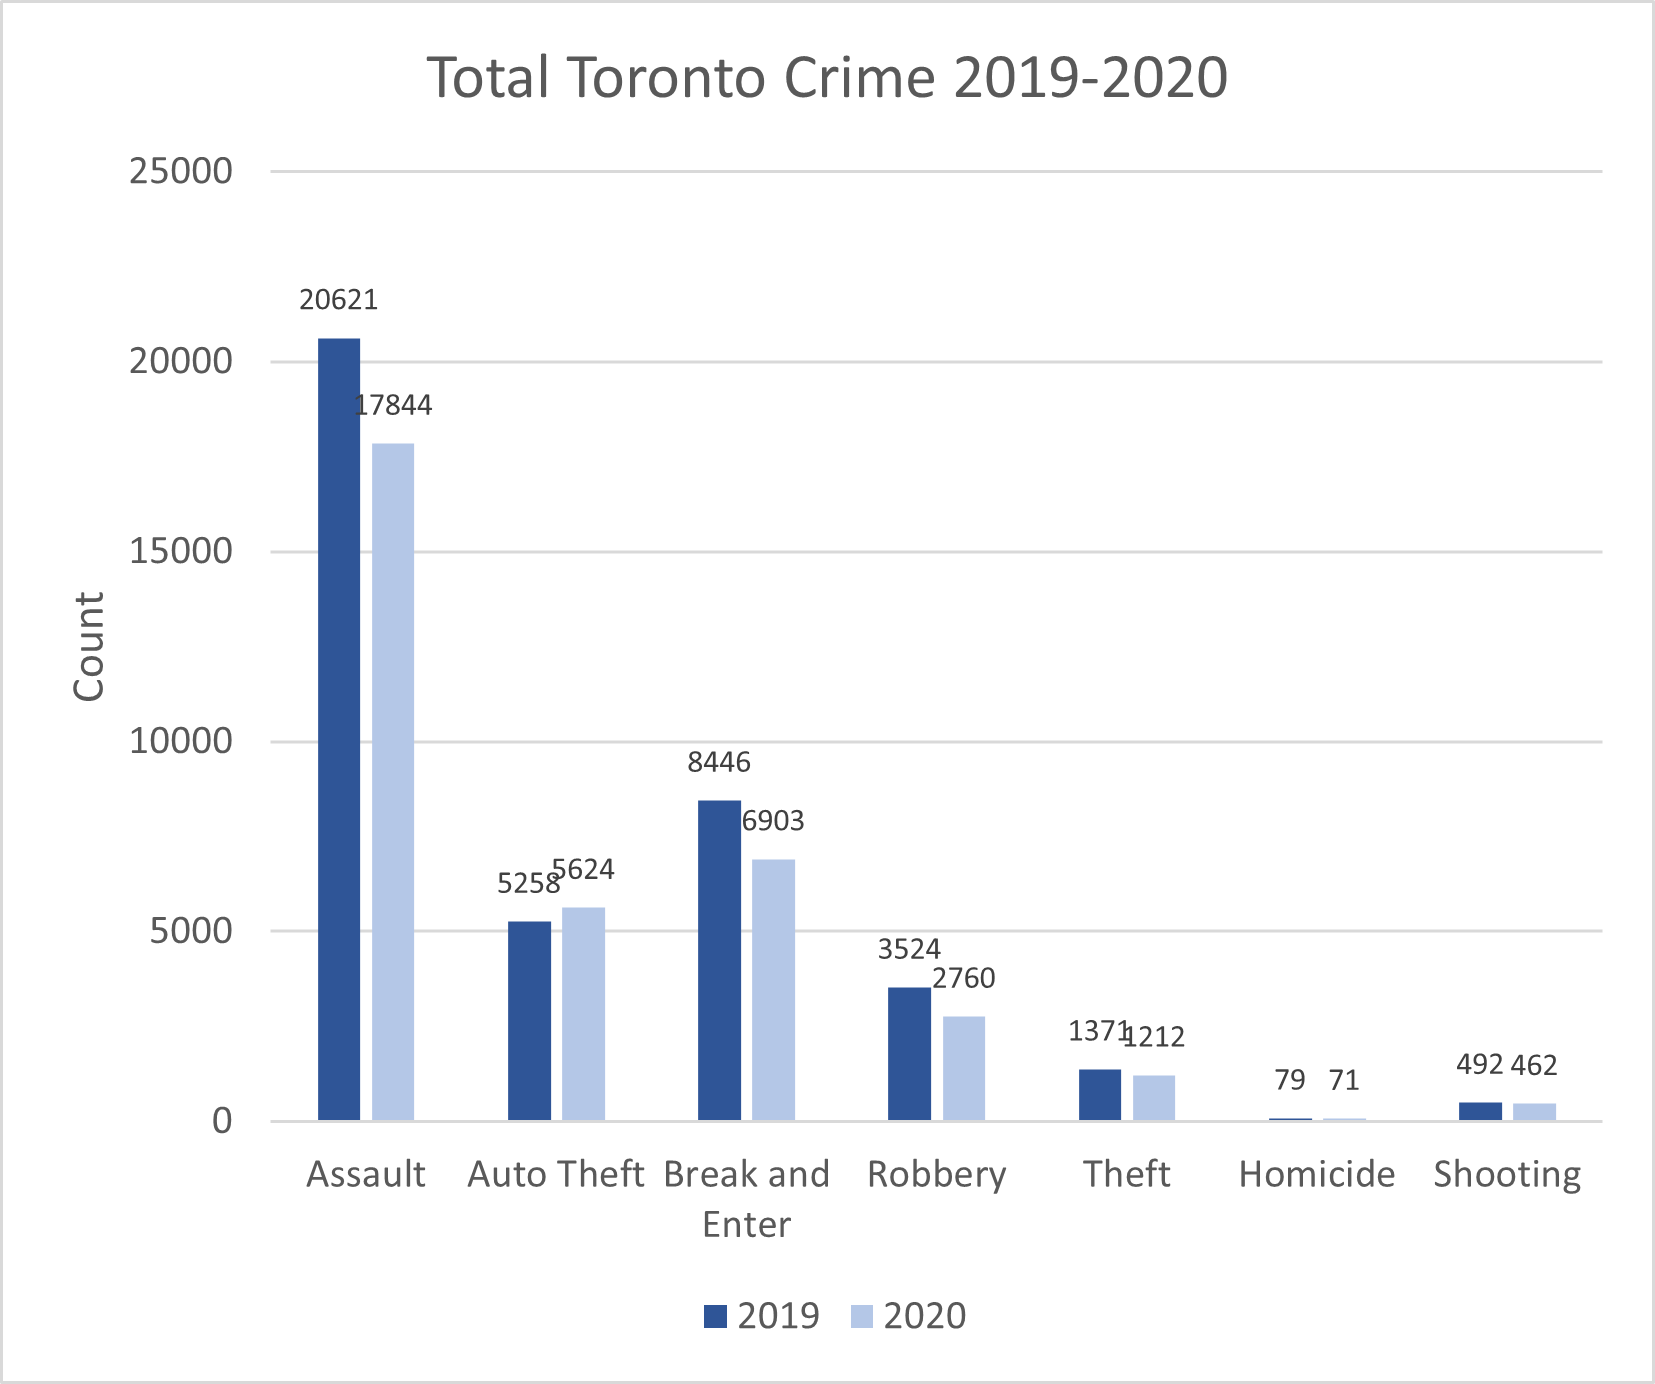
In general, the total major crime indicators for Toronto decreased 2019 to 2020, down about 14% from a rate of 1,332.1 occurrences per 100,000 people in 2019 to 1,146.5 per 100,000 people in 2020. This decrease is potentially due to the COVID-19 restrictions that began in March 2020.
The graph below shows the amount of Toronto crime occurrences for each of the seven major crime indicator for 2019 and 2020. With the exception of Auto Thefts, every indicator has decreased in 2020: Assaults decreased by 13%, Auto Thefts increased by 7%, Break and Enters decreased by 18%, Robberies decreased by 22%, Theft Over $5000 decreased by 12%, Homicides decreased by 10%, and Shootings decreased by 6%. The increase in Auto Thefts may be because people working from home during the COVID-19 restrictions had their vehicles parked in front of their homes, increasing the hours during which the vehicles could be stolen.
Neighbourhood Crime Rates
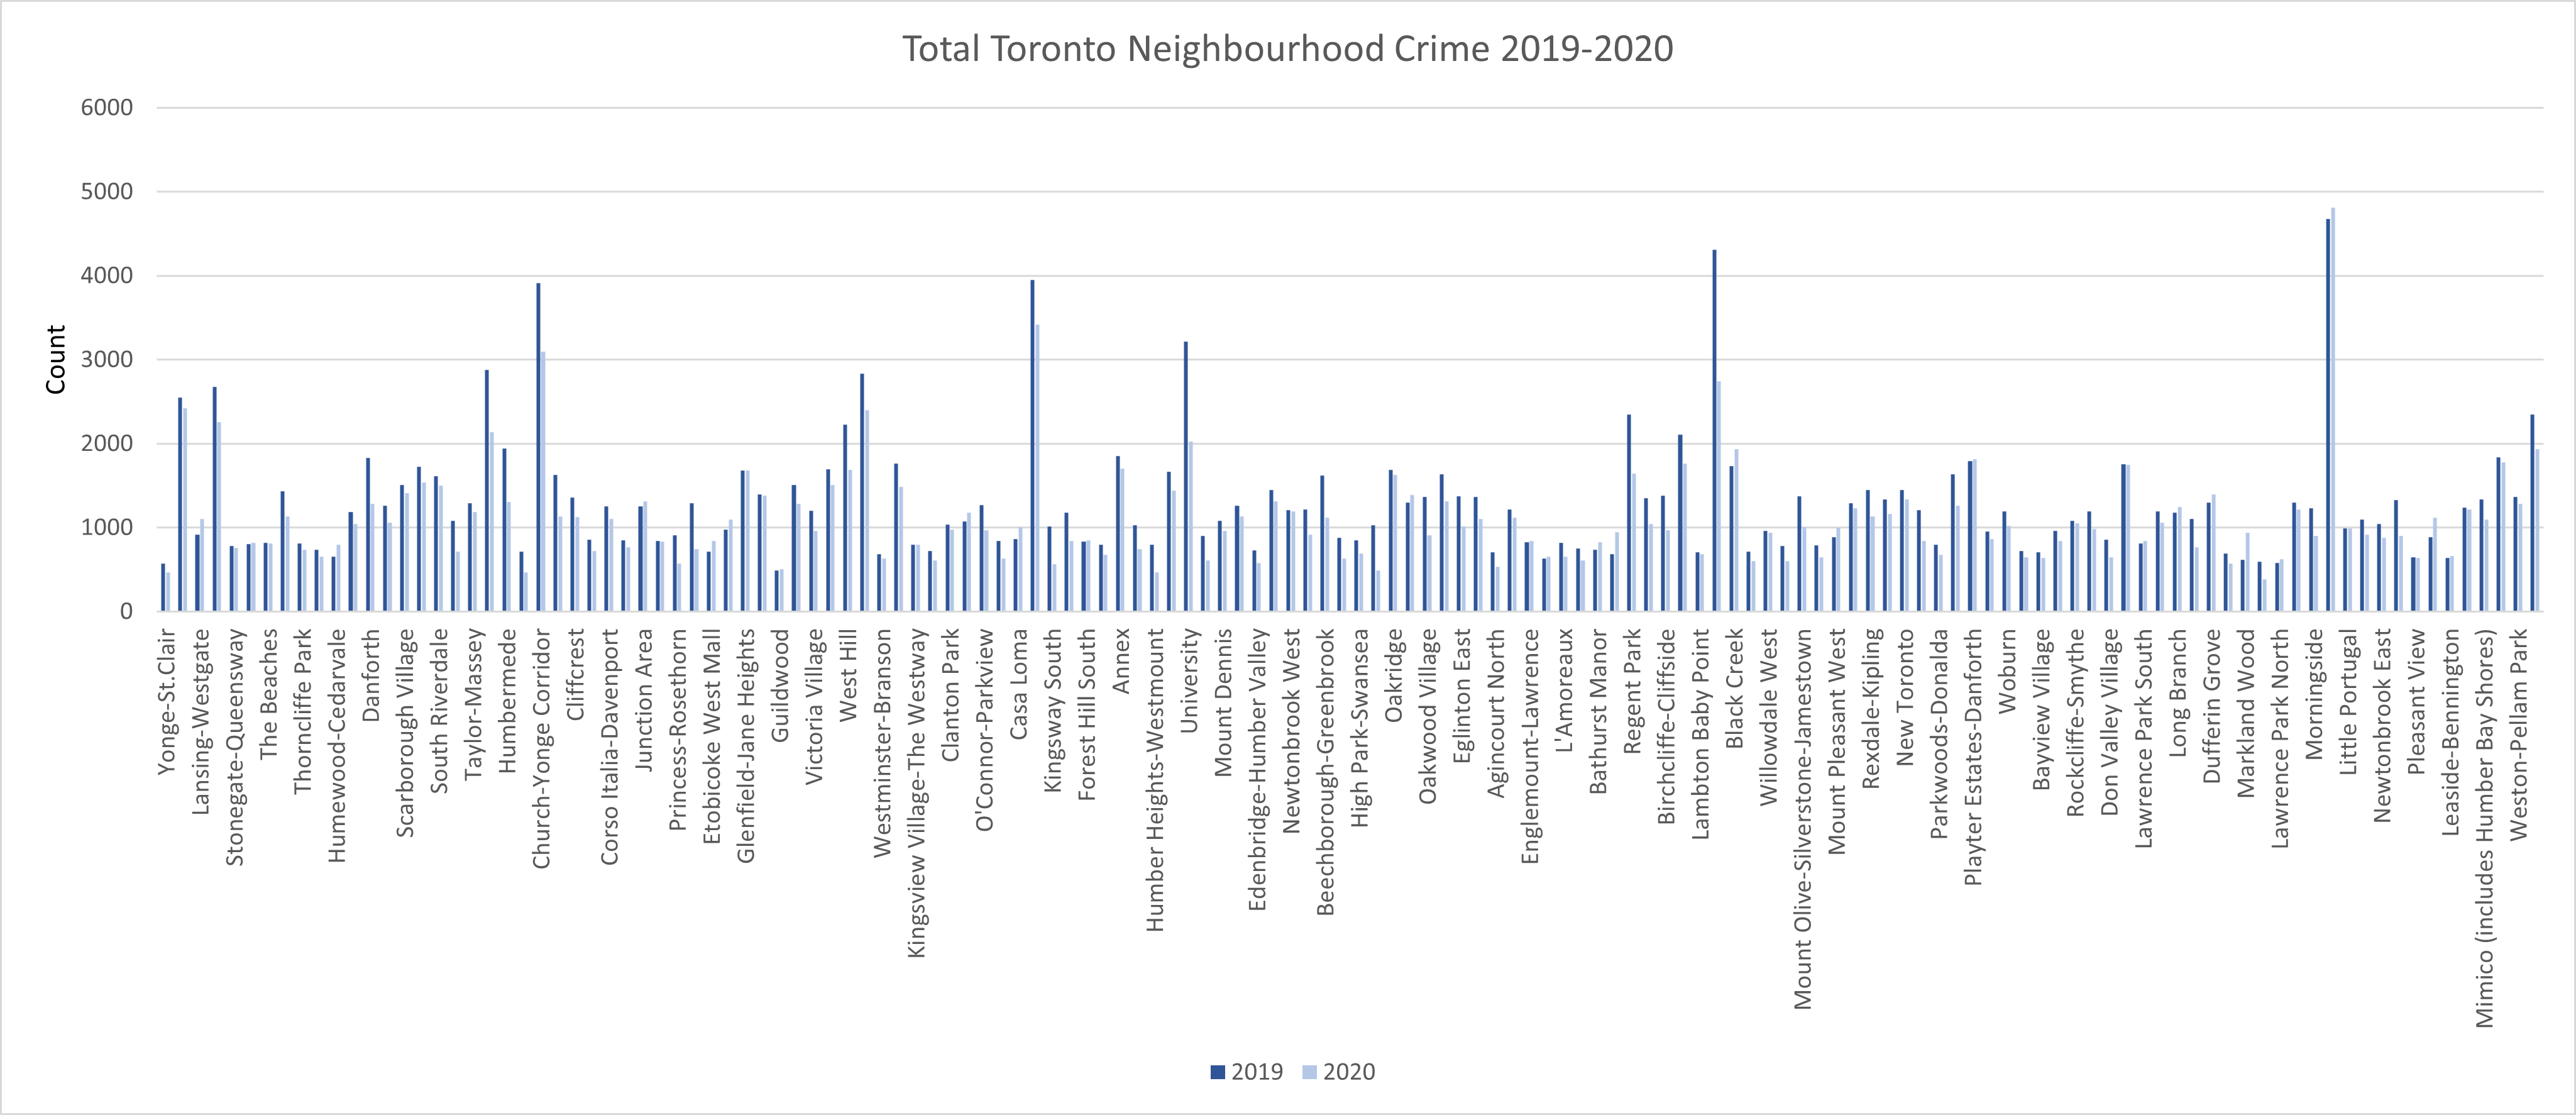
The graph below looks at each Toronto neighbourhoods individually, summing all major crime indicators together. In these data, we find 114 out of 140 Toronto neighbourhoods (about 80%) saw a decrease in major crime from 2019 to 2020, while only 26 Toronto neighbourhoods saw an increase.
The two maps below show the neighbourhood crime rates per 100,000 people in Toronto for 2019 and 2020 for all major crime indicators.
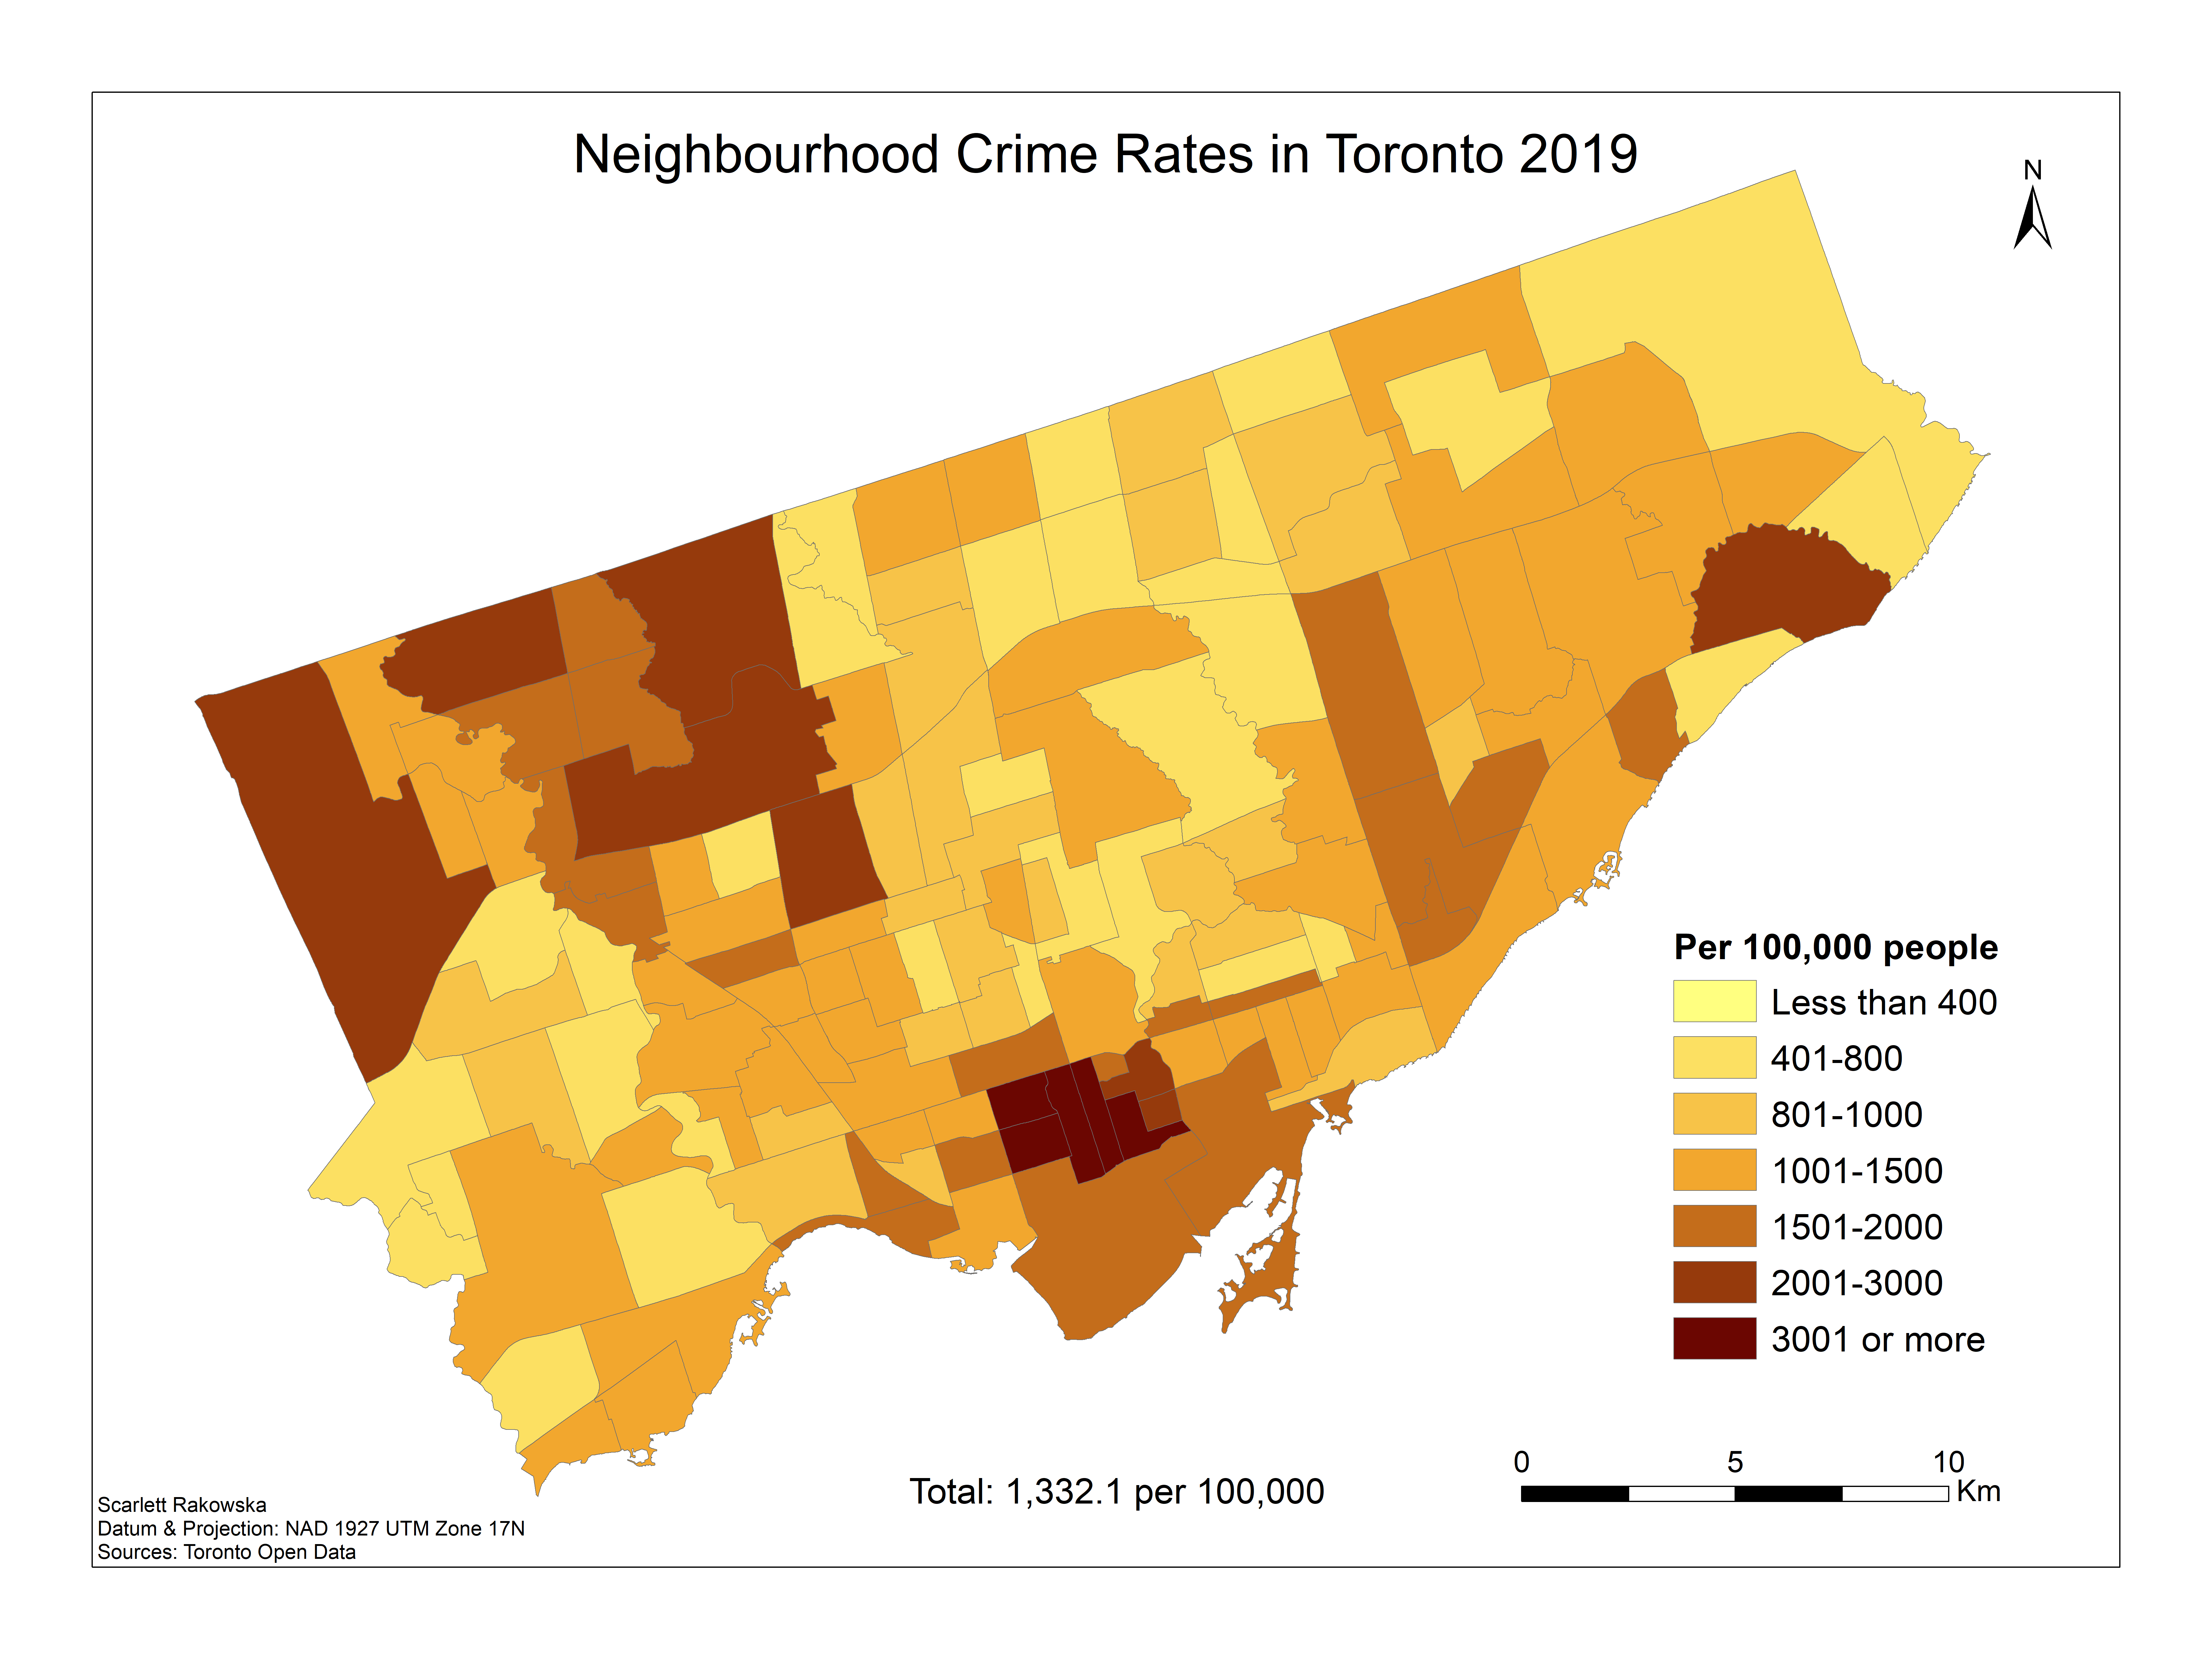

As mentioned in my 2019 blog post, the Yonge and Dundas in the central downtown area and the northwest area of the city saw the most crime, which can also be seen in the Neighbourhood Crime Rates maps above. In 2019, while there were 1,332.1 major crime occurrences per 100,000 people for the city overall, the rate was more than double that for downtown core neighbourhoods such as the Church-Young Corridor (in the south/central downtown area), with over 3001 per 100,000 people. While the spatial pattern of crime rates remains similar in 2020, with the most crime in the downtown core and northwest areas, the influence of the overall 14% reduction of crime for the city in 2020 is also visible among the neighbourhoods with the highest rates. For example, the Bay Street Corridor in the middle of the downtown core, and many of the neighbourhoods in the northwest area that are visible in the map for 2020 lower crime rates.
Percentage Change in Toronto Crime
Next, I calculated the percentage change in total Toronto neighbourhood crime occurrences from 2019 to 2020. This means that neighbourhoods with a positive percentage saw an increase in crime from 2019 to 2020, while neighbourhoods with a negative percentage saw a decrease in crime from 2019 to 2020. Additionally, neighbourhoods with a percentage of 0 saw almost no change in crime. Note that neighbourhoods with No Data could not calculate an accurate percentage change as its 2019 data had 0 crime occurrences.
The following maps show the percentage change in total Toronto crime from 2019 to 2020 for each of the seven major crime indicators, enabling us to where the changes from 2019 to 2020 occur.
Assaults
Starting with total Assaults in the city, six neighbourhoods saw almost no difference in crime, the majority saw moderate decline, though 29 saw an increase in crime. The Markland Wood neighbourhood at the west end of the city saw the largest increase of over 41% from 2019 to 2020.

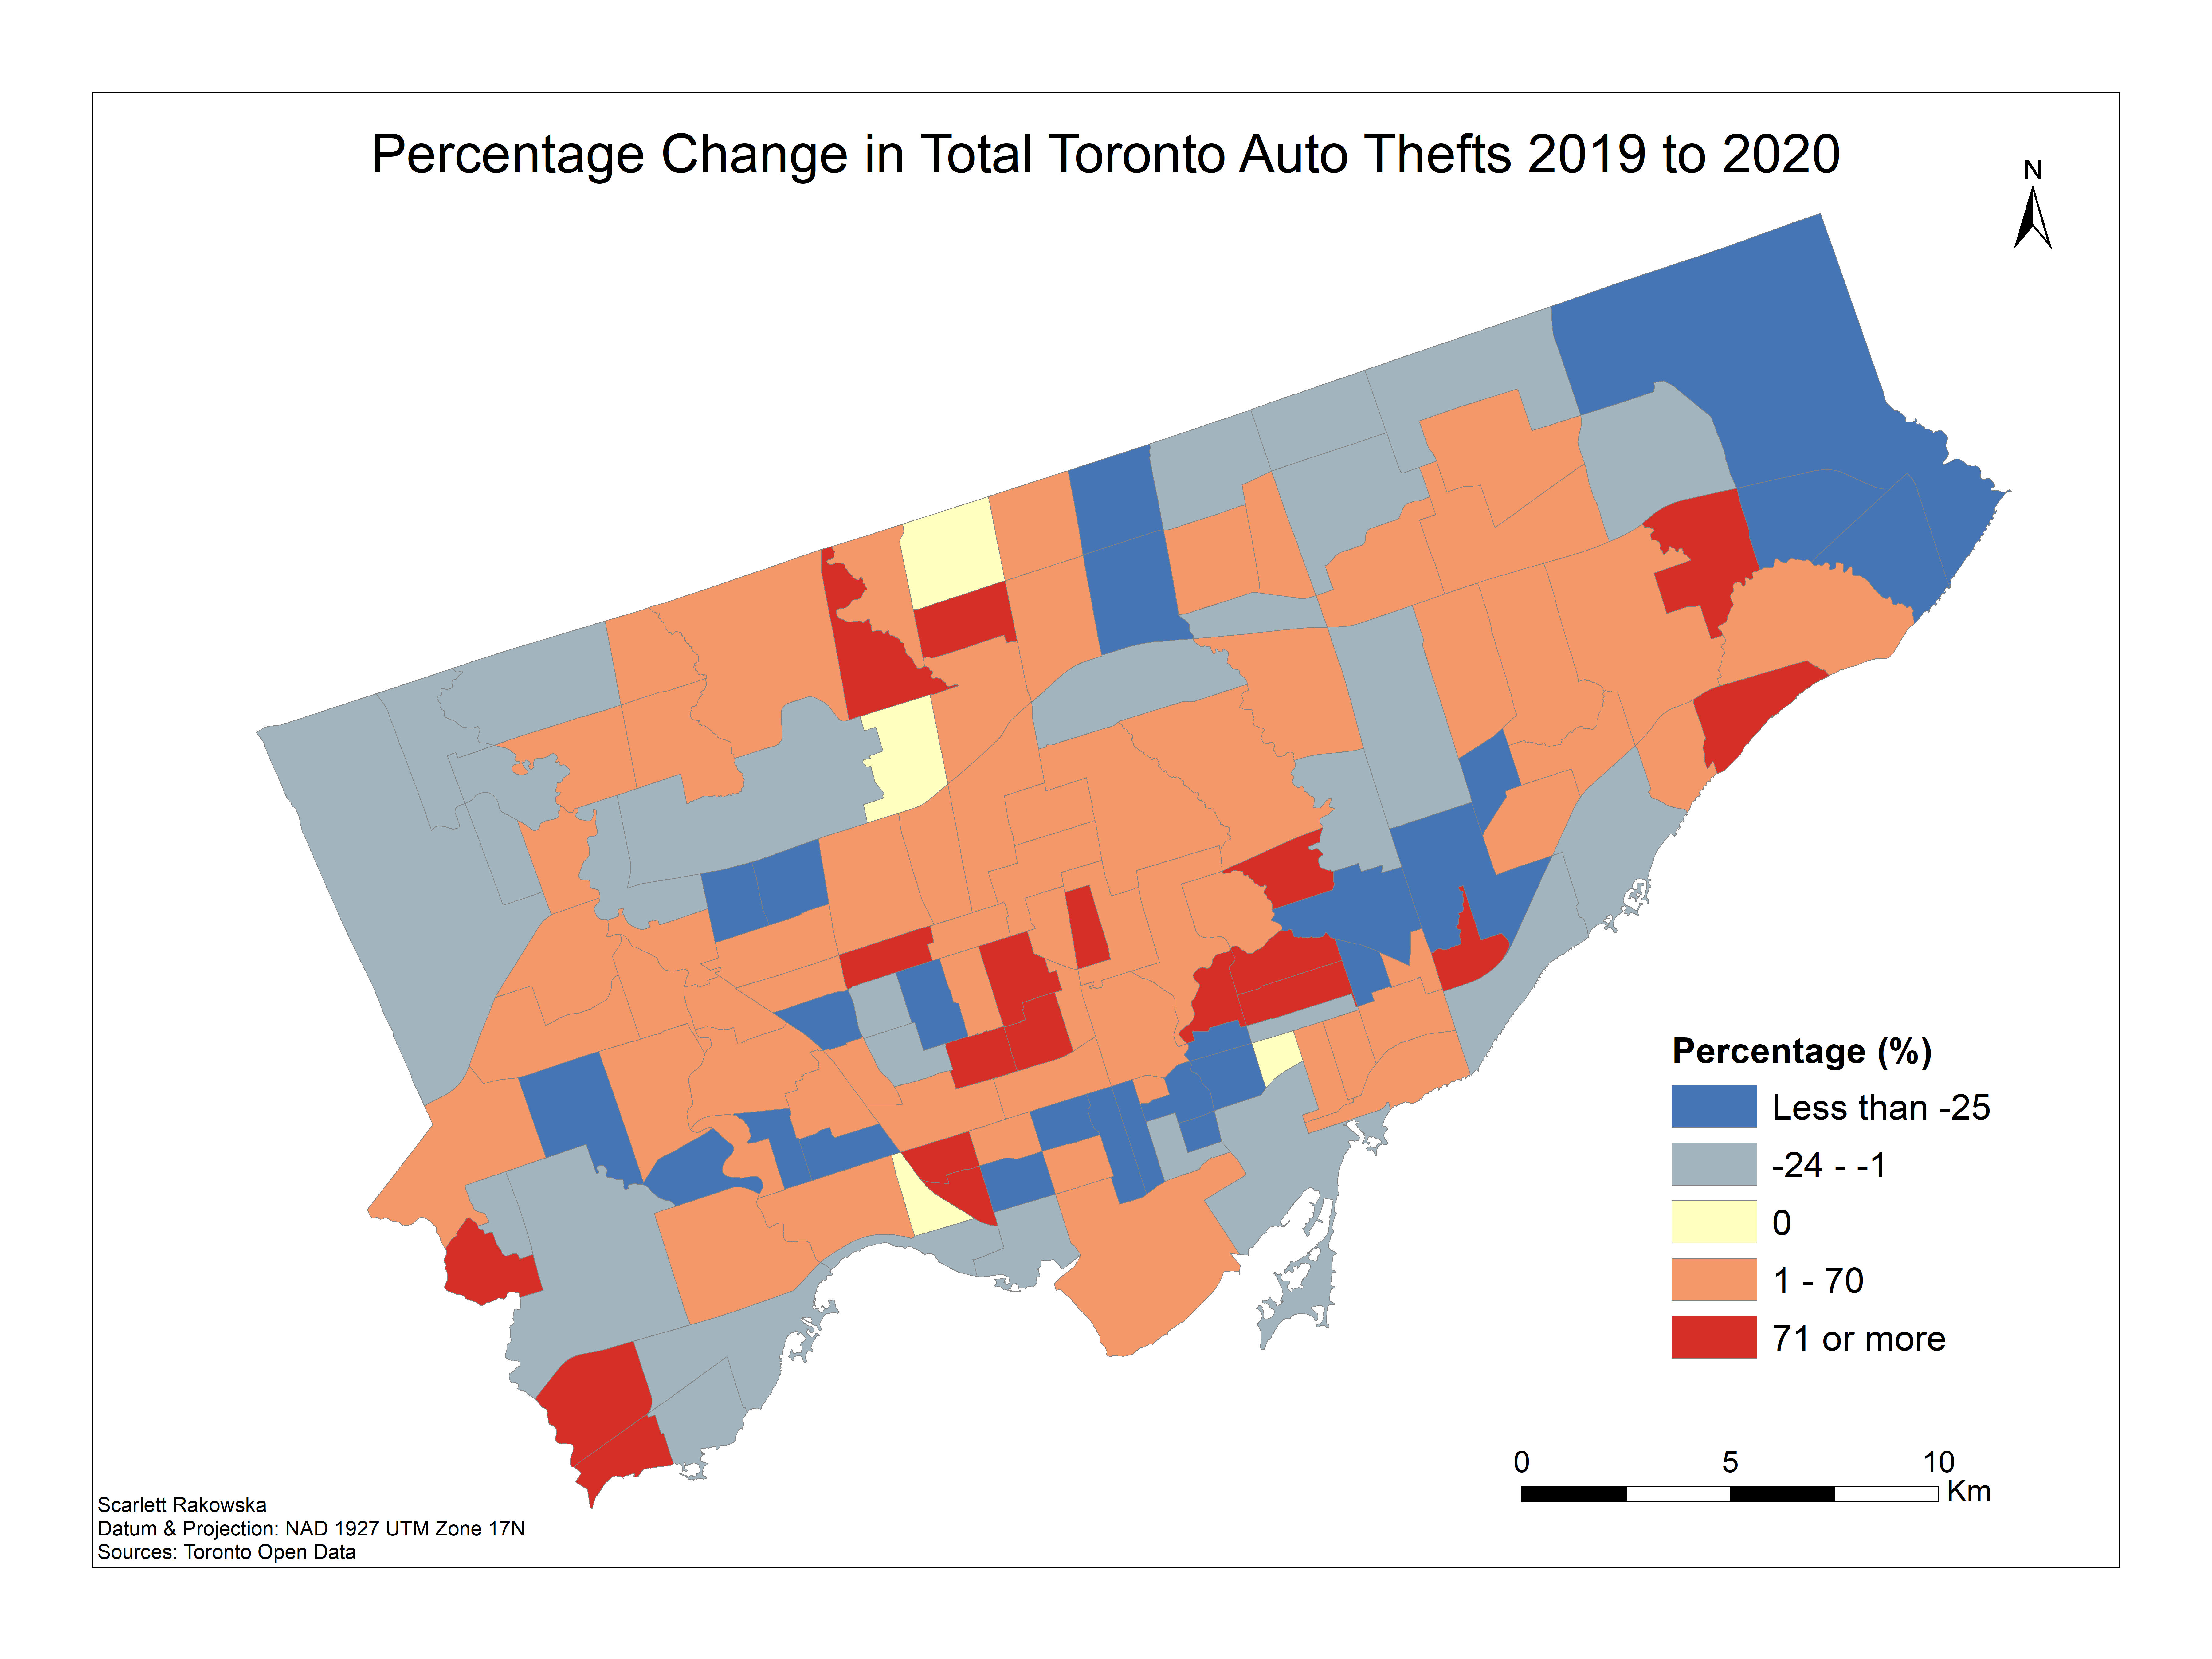
Auto Thefts
As mentioned earlier, Auto Thefts was the only major crime indicator that saw an increase in occurrences from 2019 to 2020. Four Toronto neighbourhoods saw almost no change in crime, while 19 out of 140 neighbourhoods saw an increase of over 71%. More than half of the Toronto neighbourhoods saw a rise rather than a decrease in total Auto Thefts.
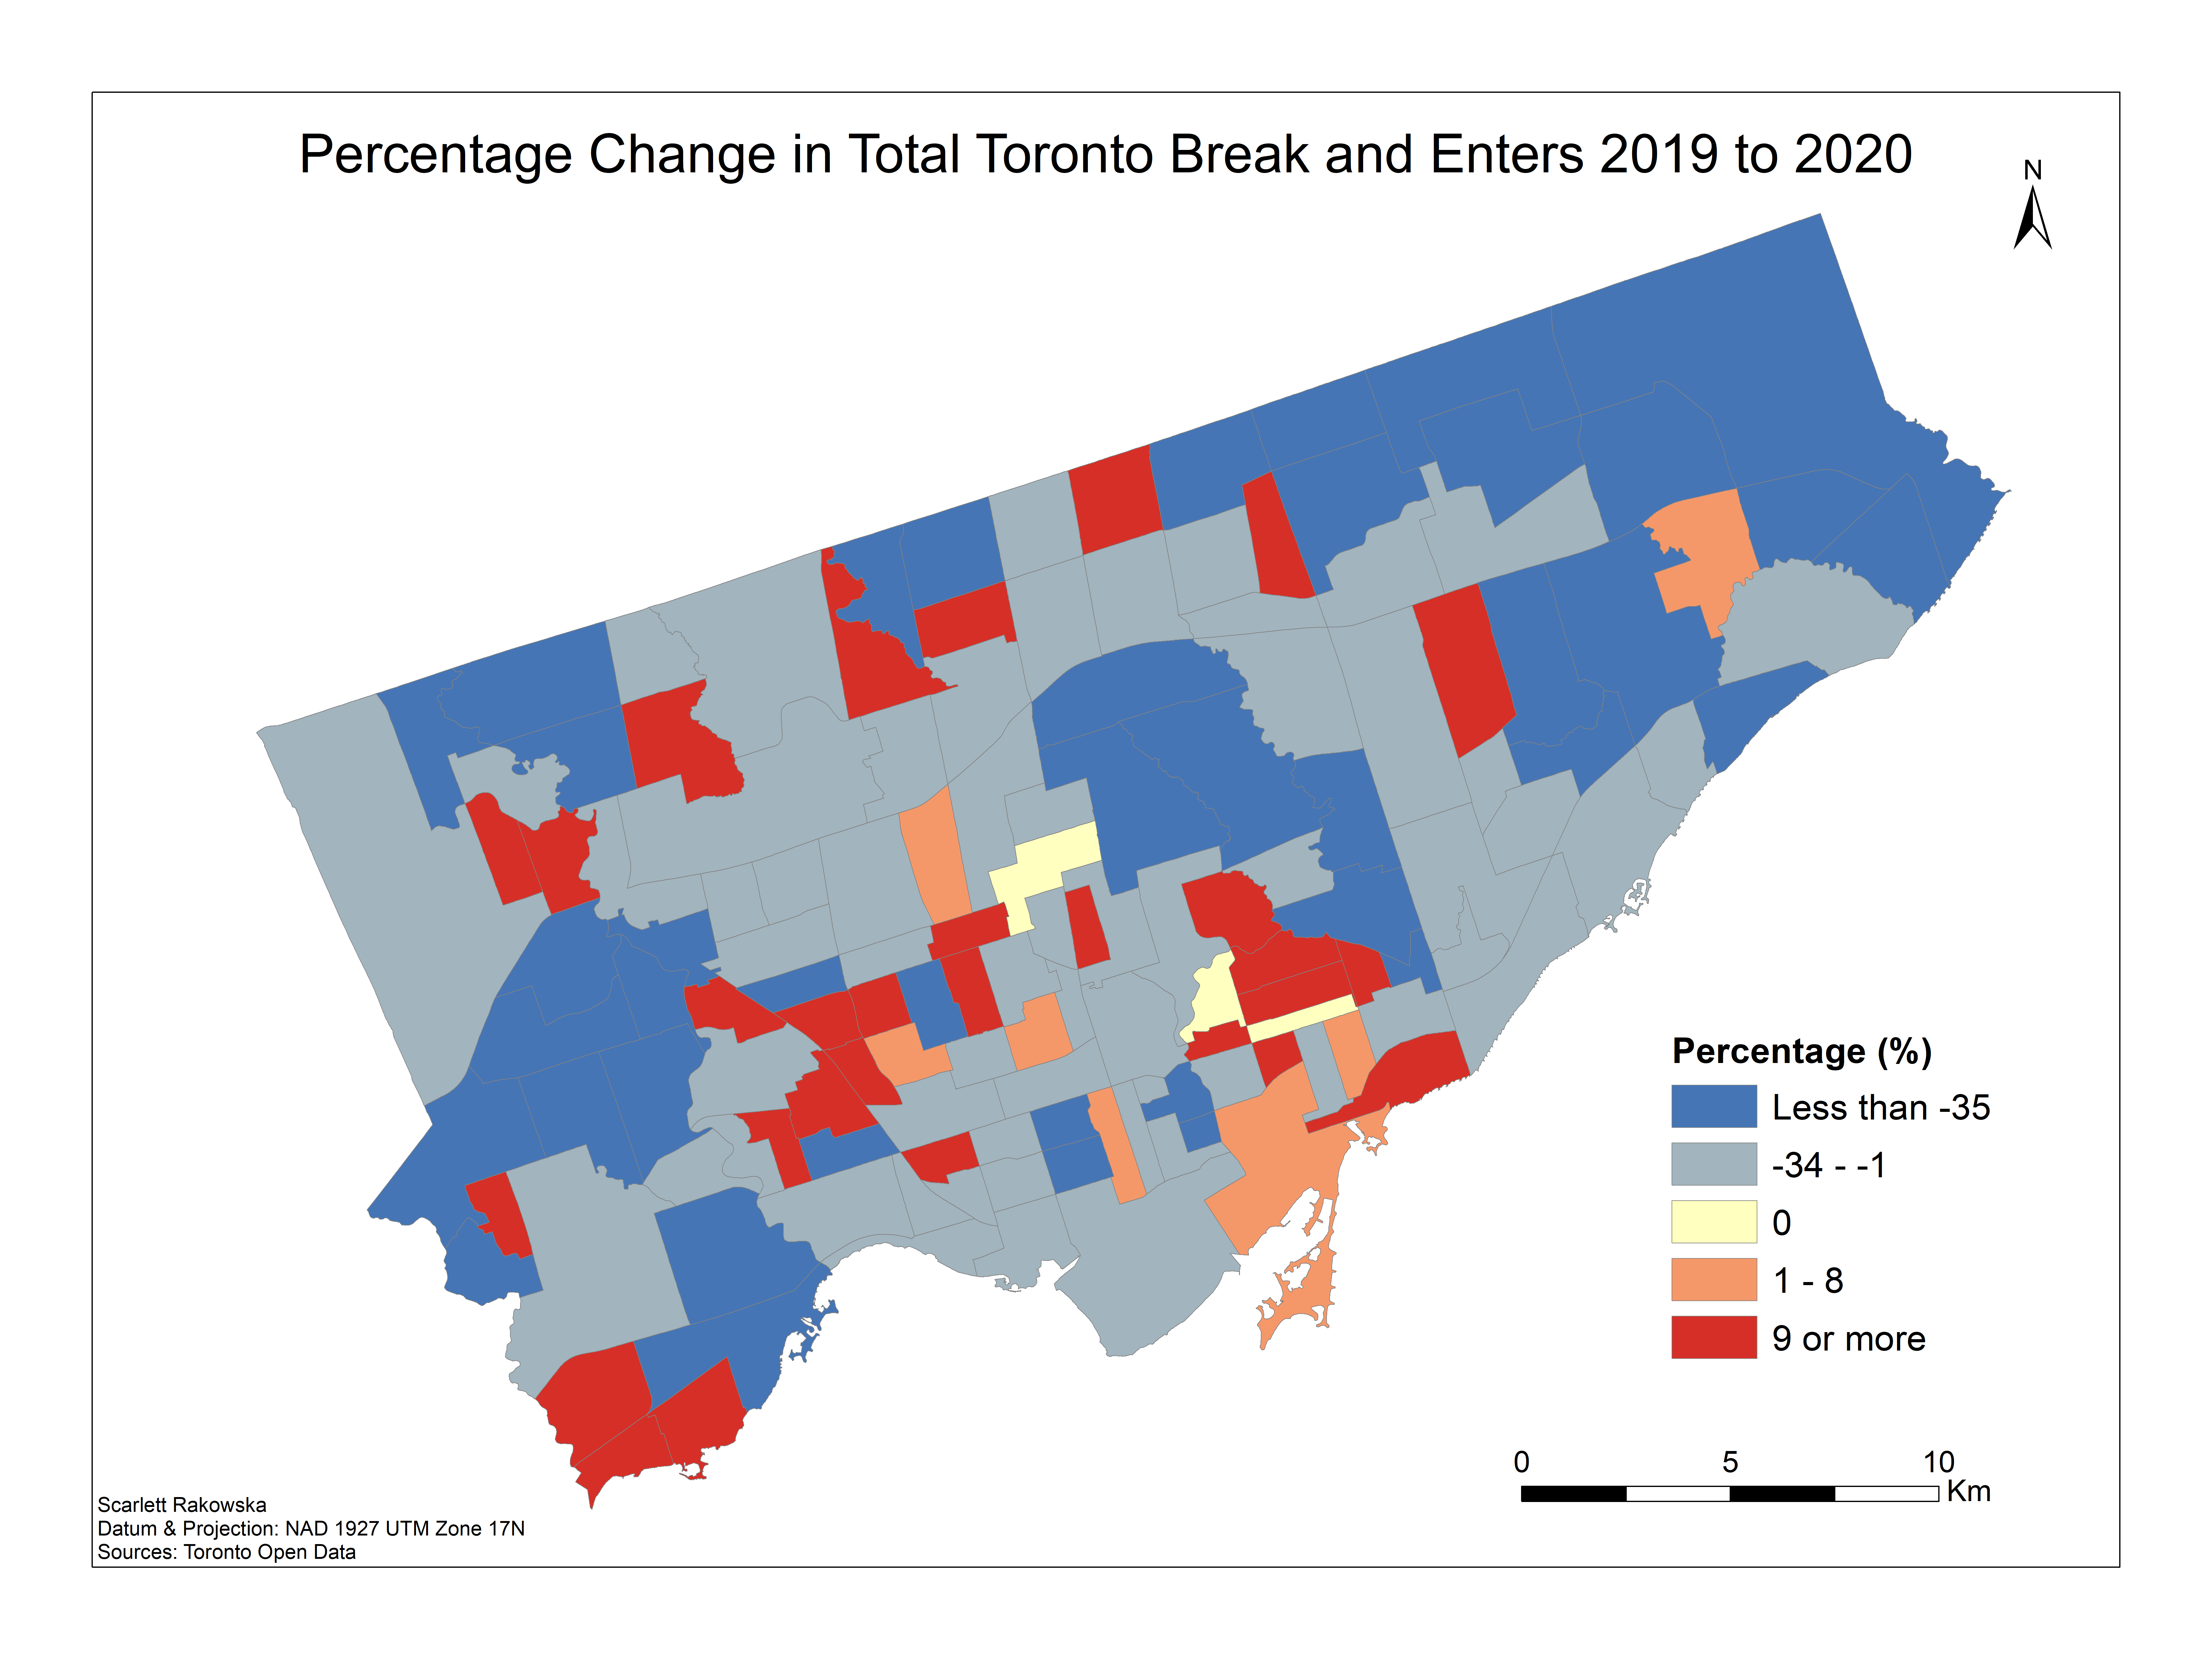
Break and Enters
As for total Break and Enters in the city, we mainly see a decrease, where three neighbourhoods saw almost no change. However, the neighbourhoods with an increased crime are relatively scattered, and no pattern is clearly seen.
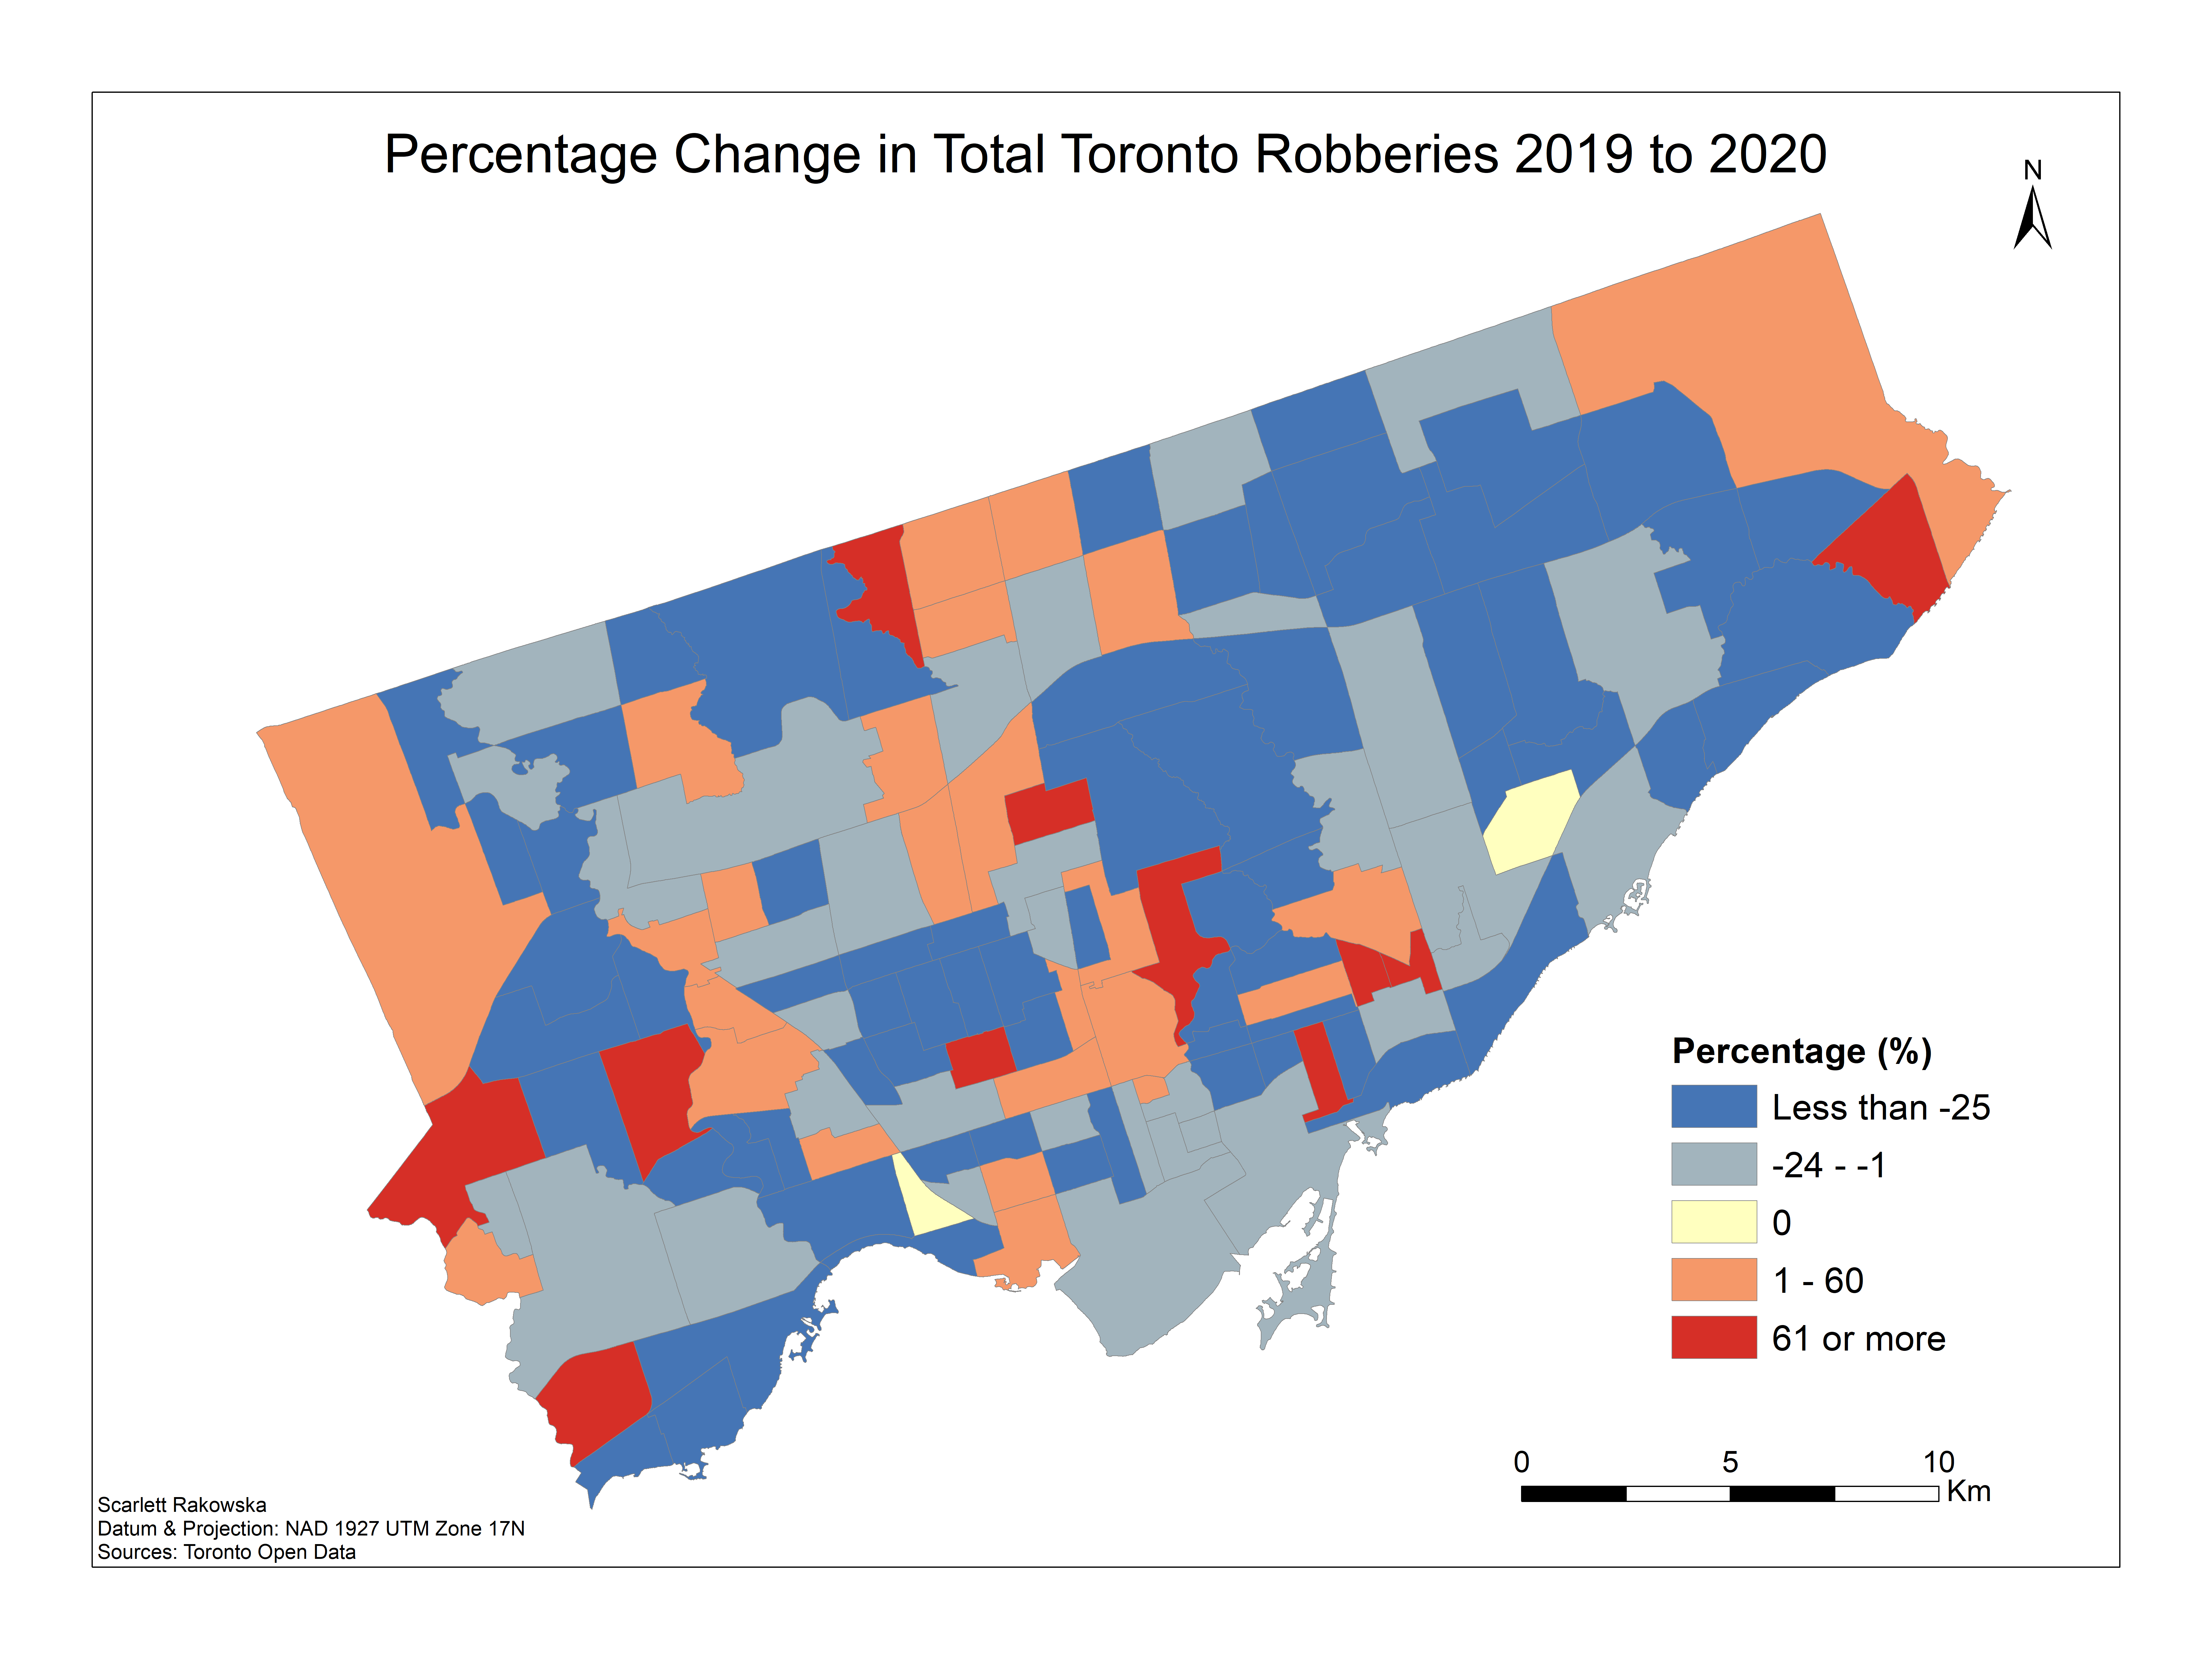
Robberies
For total Robberies, only two Toronto neighbourhoods have almost no change in major crime from 2019 to 2020, and only 11 neighbourhoods saw an increase of 61% or more.
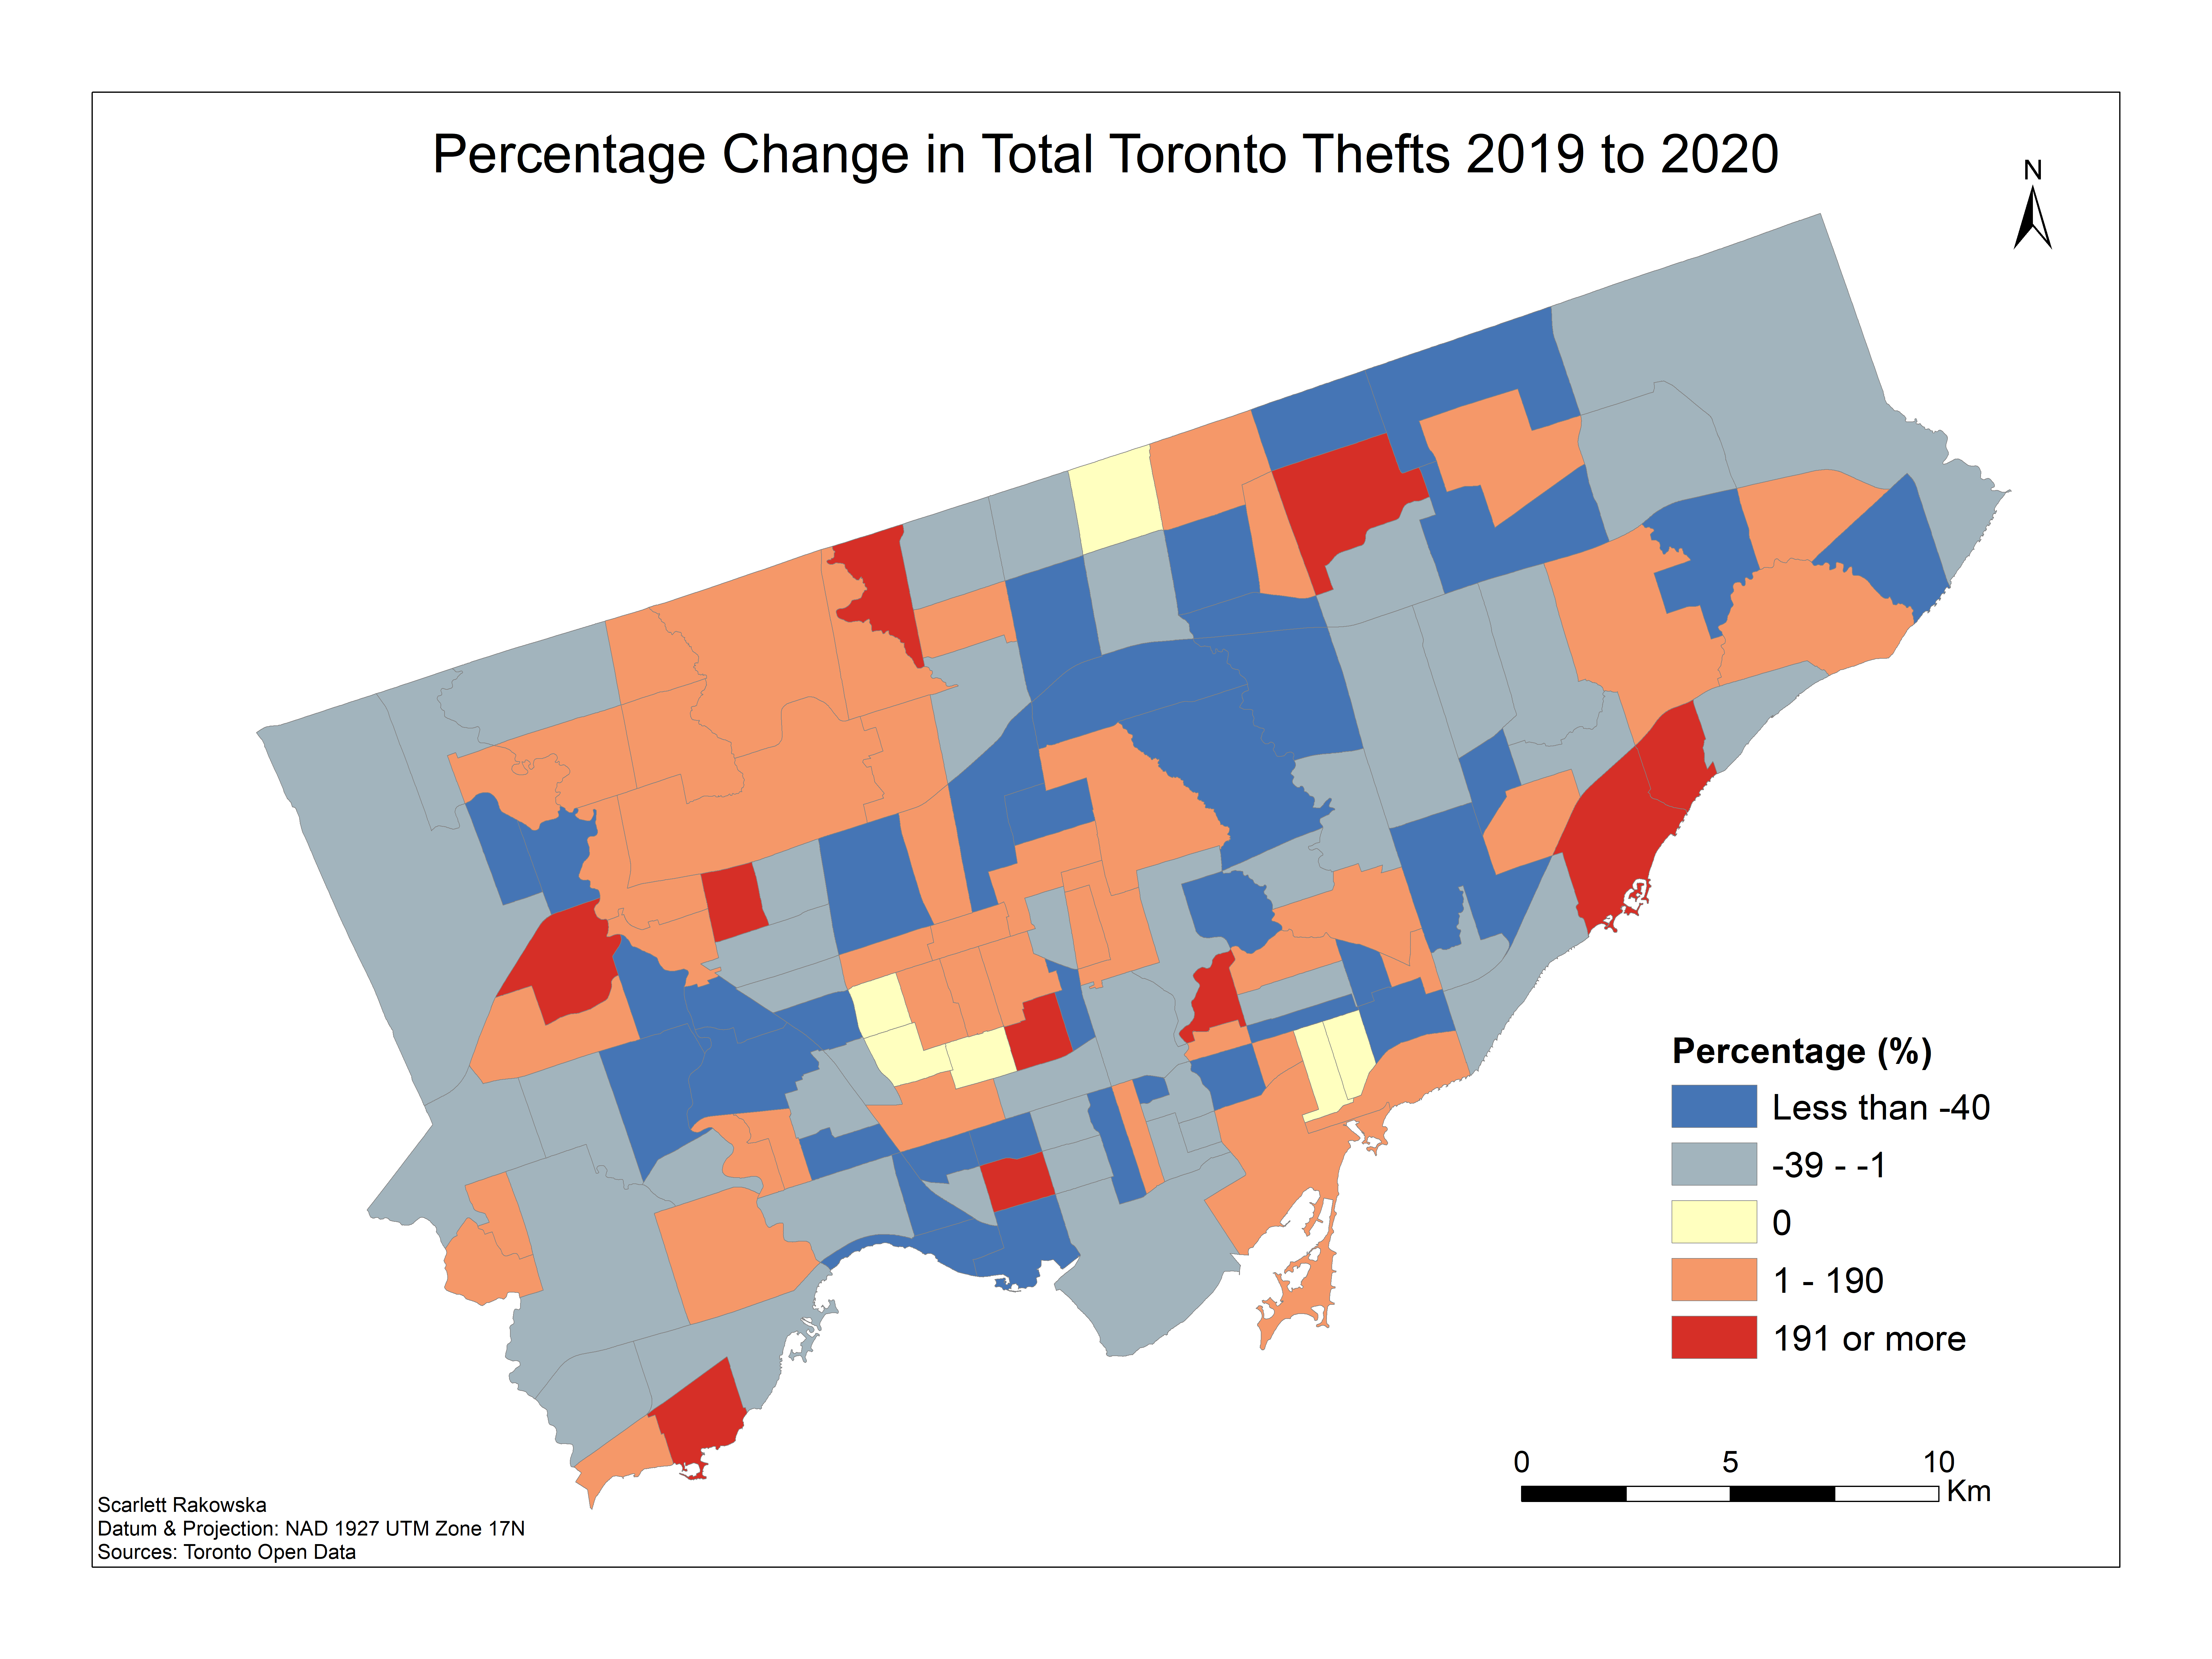
Theft Over $5000
The total Theft Over $5000 saw the highest percentage change in neighbourhoods. Even though six neighbourhoods saw almost no difference in crime from 2019 to 2020, ten Toronto neighbourhoods saw an increase of over 191%.
Homicides
As for total Homicides, two neighbourhoods saw almost no change in crime from 2019 to 2020 and two neighbourhoods saw an increase of over 51%. However, as mentioned earlier, this major crime indicator has neighbourhoods with No Data. I decided not to include this data because it may not be accurate. These neighbourhoods had 0 occurrences of homicides in 2019, with a possible increase in 2020, meaning that the percentage cannot be calculated. When looking at the neighbourhoods with No Data, 65 neighbourhoods also had 0 homicides in 2020.

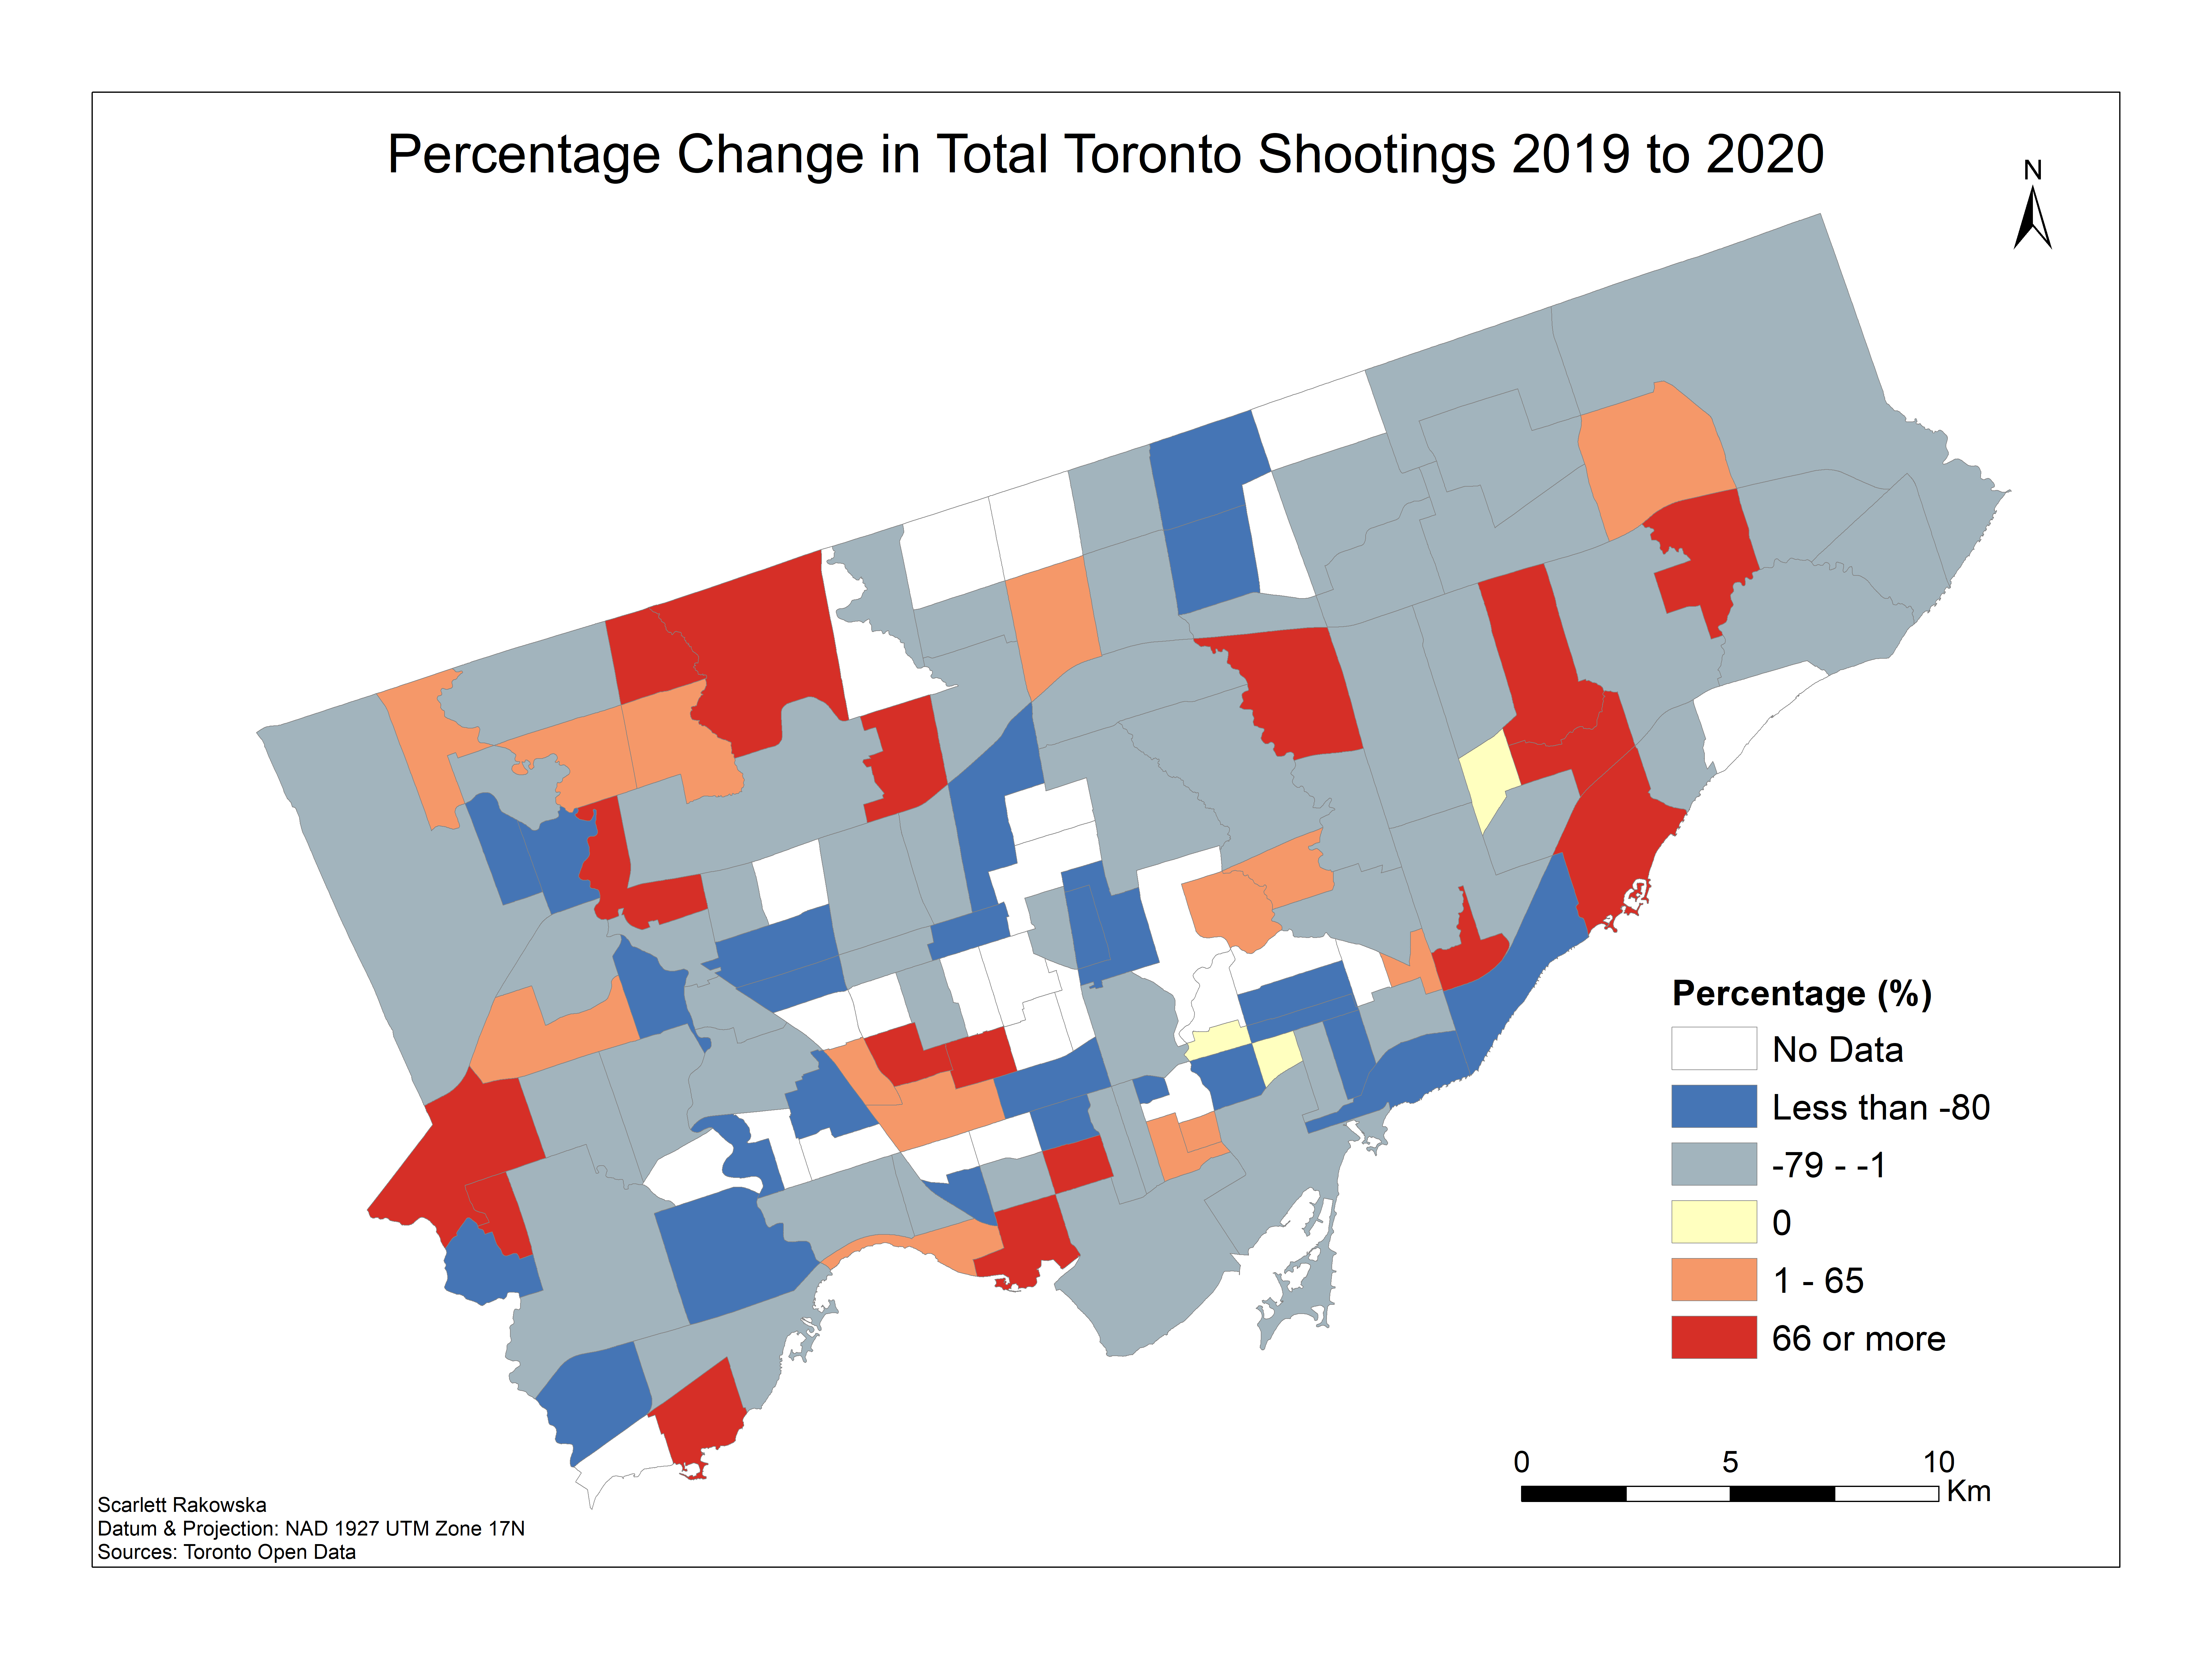
Shootings
Similar to Homicides, Shootings also have neighbourhoods with No Data, with at least three neighbourhoods with almost no change in major crime from 2019 to 2020, and 17 out of 140 neighbourhoods with an increase of over 66%. When looking at the neighbourhoods with No Data, 15 neighbourhoods also had 0 shootings in 2020.
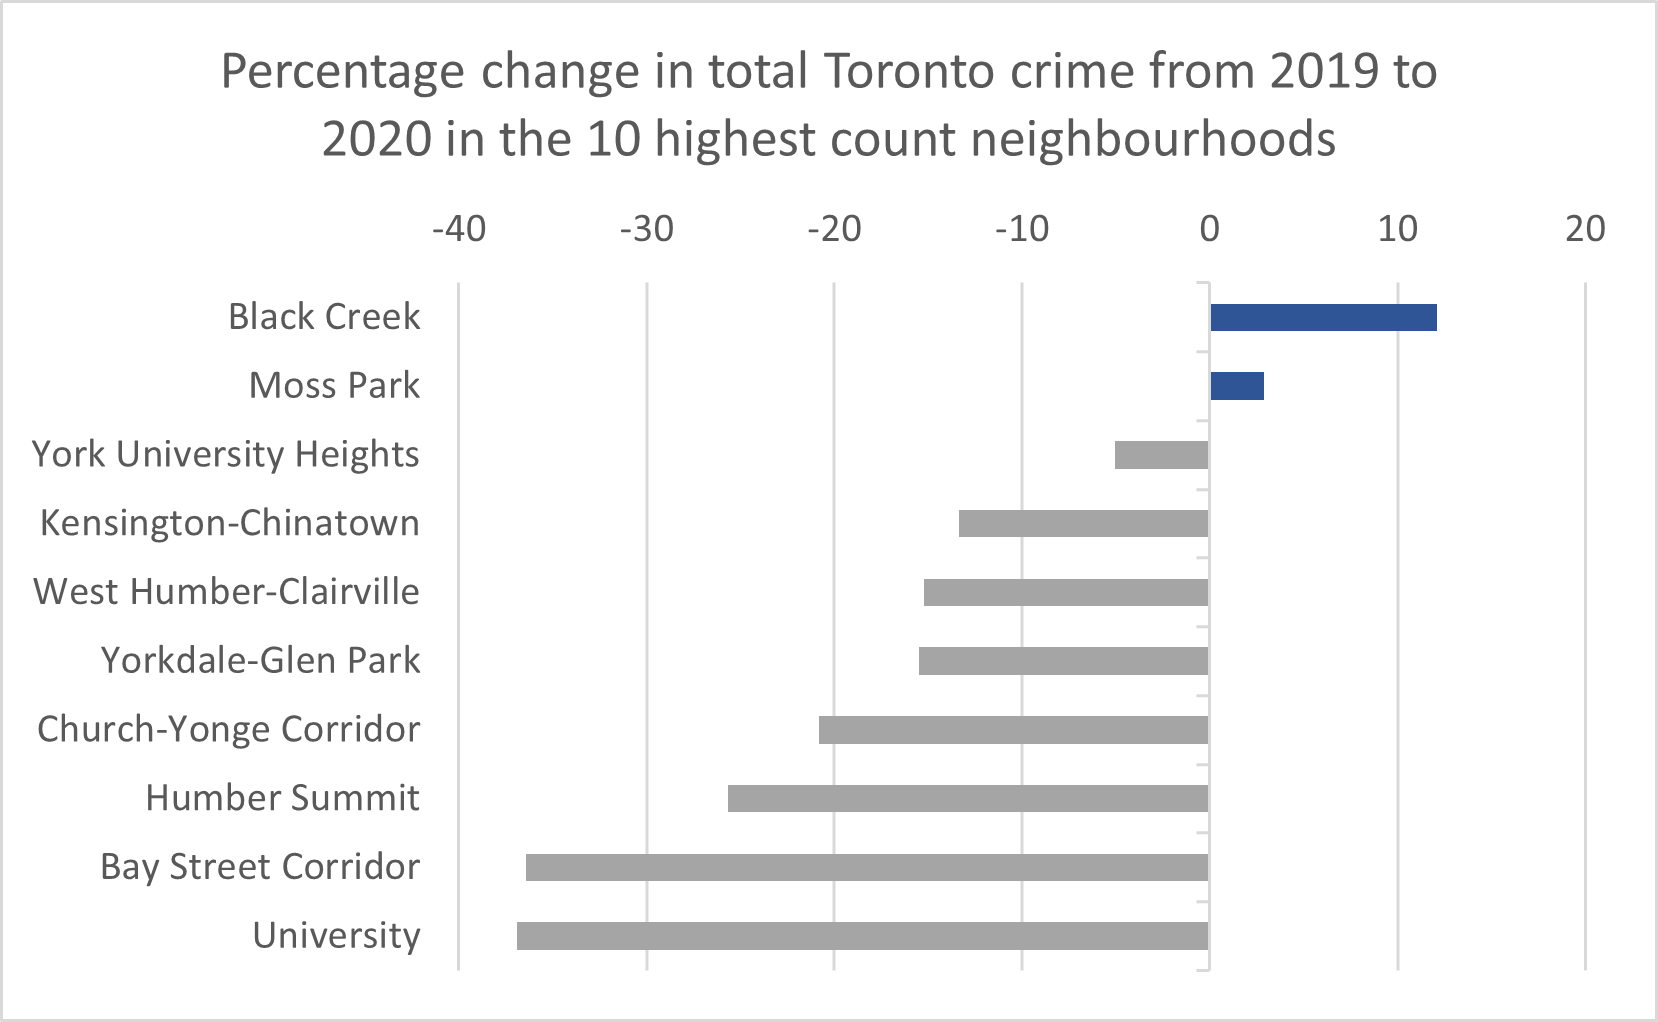
The graph below shows the percentage change in total Toronto crime from 2019 to 2020 for the top 10 Toronto neighbourhoods with the highest amount of major crime occurrences in 2020. The Toronto neighbourhood of Black Creek has the most amount of major crime occurrences in 2020, and that number increased by over 10% from 2019.
Conclusion
It was interesting the investigate the changes in major crime in Toronto from 2019 to 2020 when COVID-19 restrictions were put into place in March 2020. We can see that major crime in Toronto decreased by almost 14% from 2019 to 2020, except for Auto Thefts experiencing an increase. For future research, it would be interesting to investigate the dates of which these major crime indicators occurred. It would be fascinating to see whether the decrease in major crime only decreased starting from March or if a reduction can be seen beginning from January, or if different phases of COVID-19 restrictions in combination with other factors influenced crime rates differently across the city and throughout the year.
— Scarlett Rakowska
References
Analyzing Toronto Crime Data using Kernel Density by Scarlett Rakowska: https://ecce.esri.ca/uoft-blog/2020/08/04/analyzing-toronto-crime-data-using-kernel-density/
COVID-19 Toronto: https://www.toronto.ca/home/covid-19/
Public Safety Data Portal Toronto Police Service: https://data.torontopolice.on.ca/
Environics Analytics: https://environicsanalytics.com/en-ca
Data
Toronto Police Service. (2021). Public Safety Data Portal. Retrieved from: https://data.torontopolice.on.ca/