
Analyzing Toronto Crime Data using Kernel Density
Recently, the Toronto Police Service released its 2019 data of major crime indicators. These indicators include assaults, auto thefts, break and enters, homicides, robberies, and thefts over. In this blog, I will analyze the major crime indicators for Toronto in 2019 using kernel density.
Kernel Density
Kernel Density is a spatial analyst tool that calculates the magnitude-per-unit area of point features to smooth it out. In other terms, this can be called a heatmap. Kernel density allows you to set a radius to calculate the density. In this analysis, we will be looking at the number of major crime indicators within 1km2:
- Assaults – measure of the number of assaults within 1km2
- Auto Thefts – measure of the number of auto thefts within 1km2
- Break and Enter – measure of the number of break and enters within 1km2
- Homicides – measure of the number of homicides within 1km2
- Robberies – measure of the number of robberies within 1km2
- Thefts Over – measure of the number of thefts over $5000 within 1km2
RESULTS
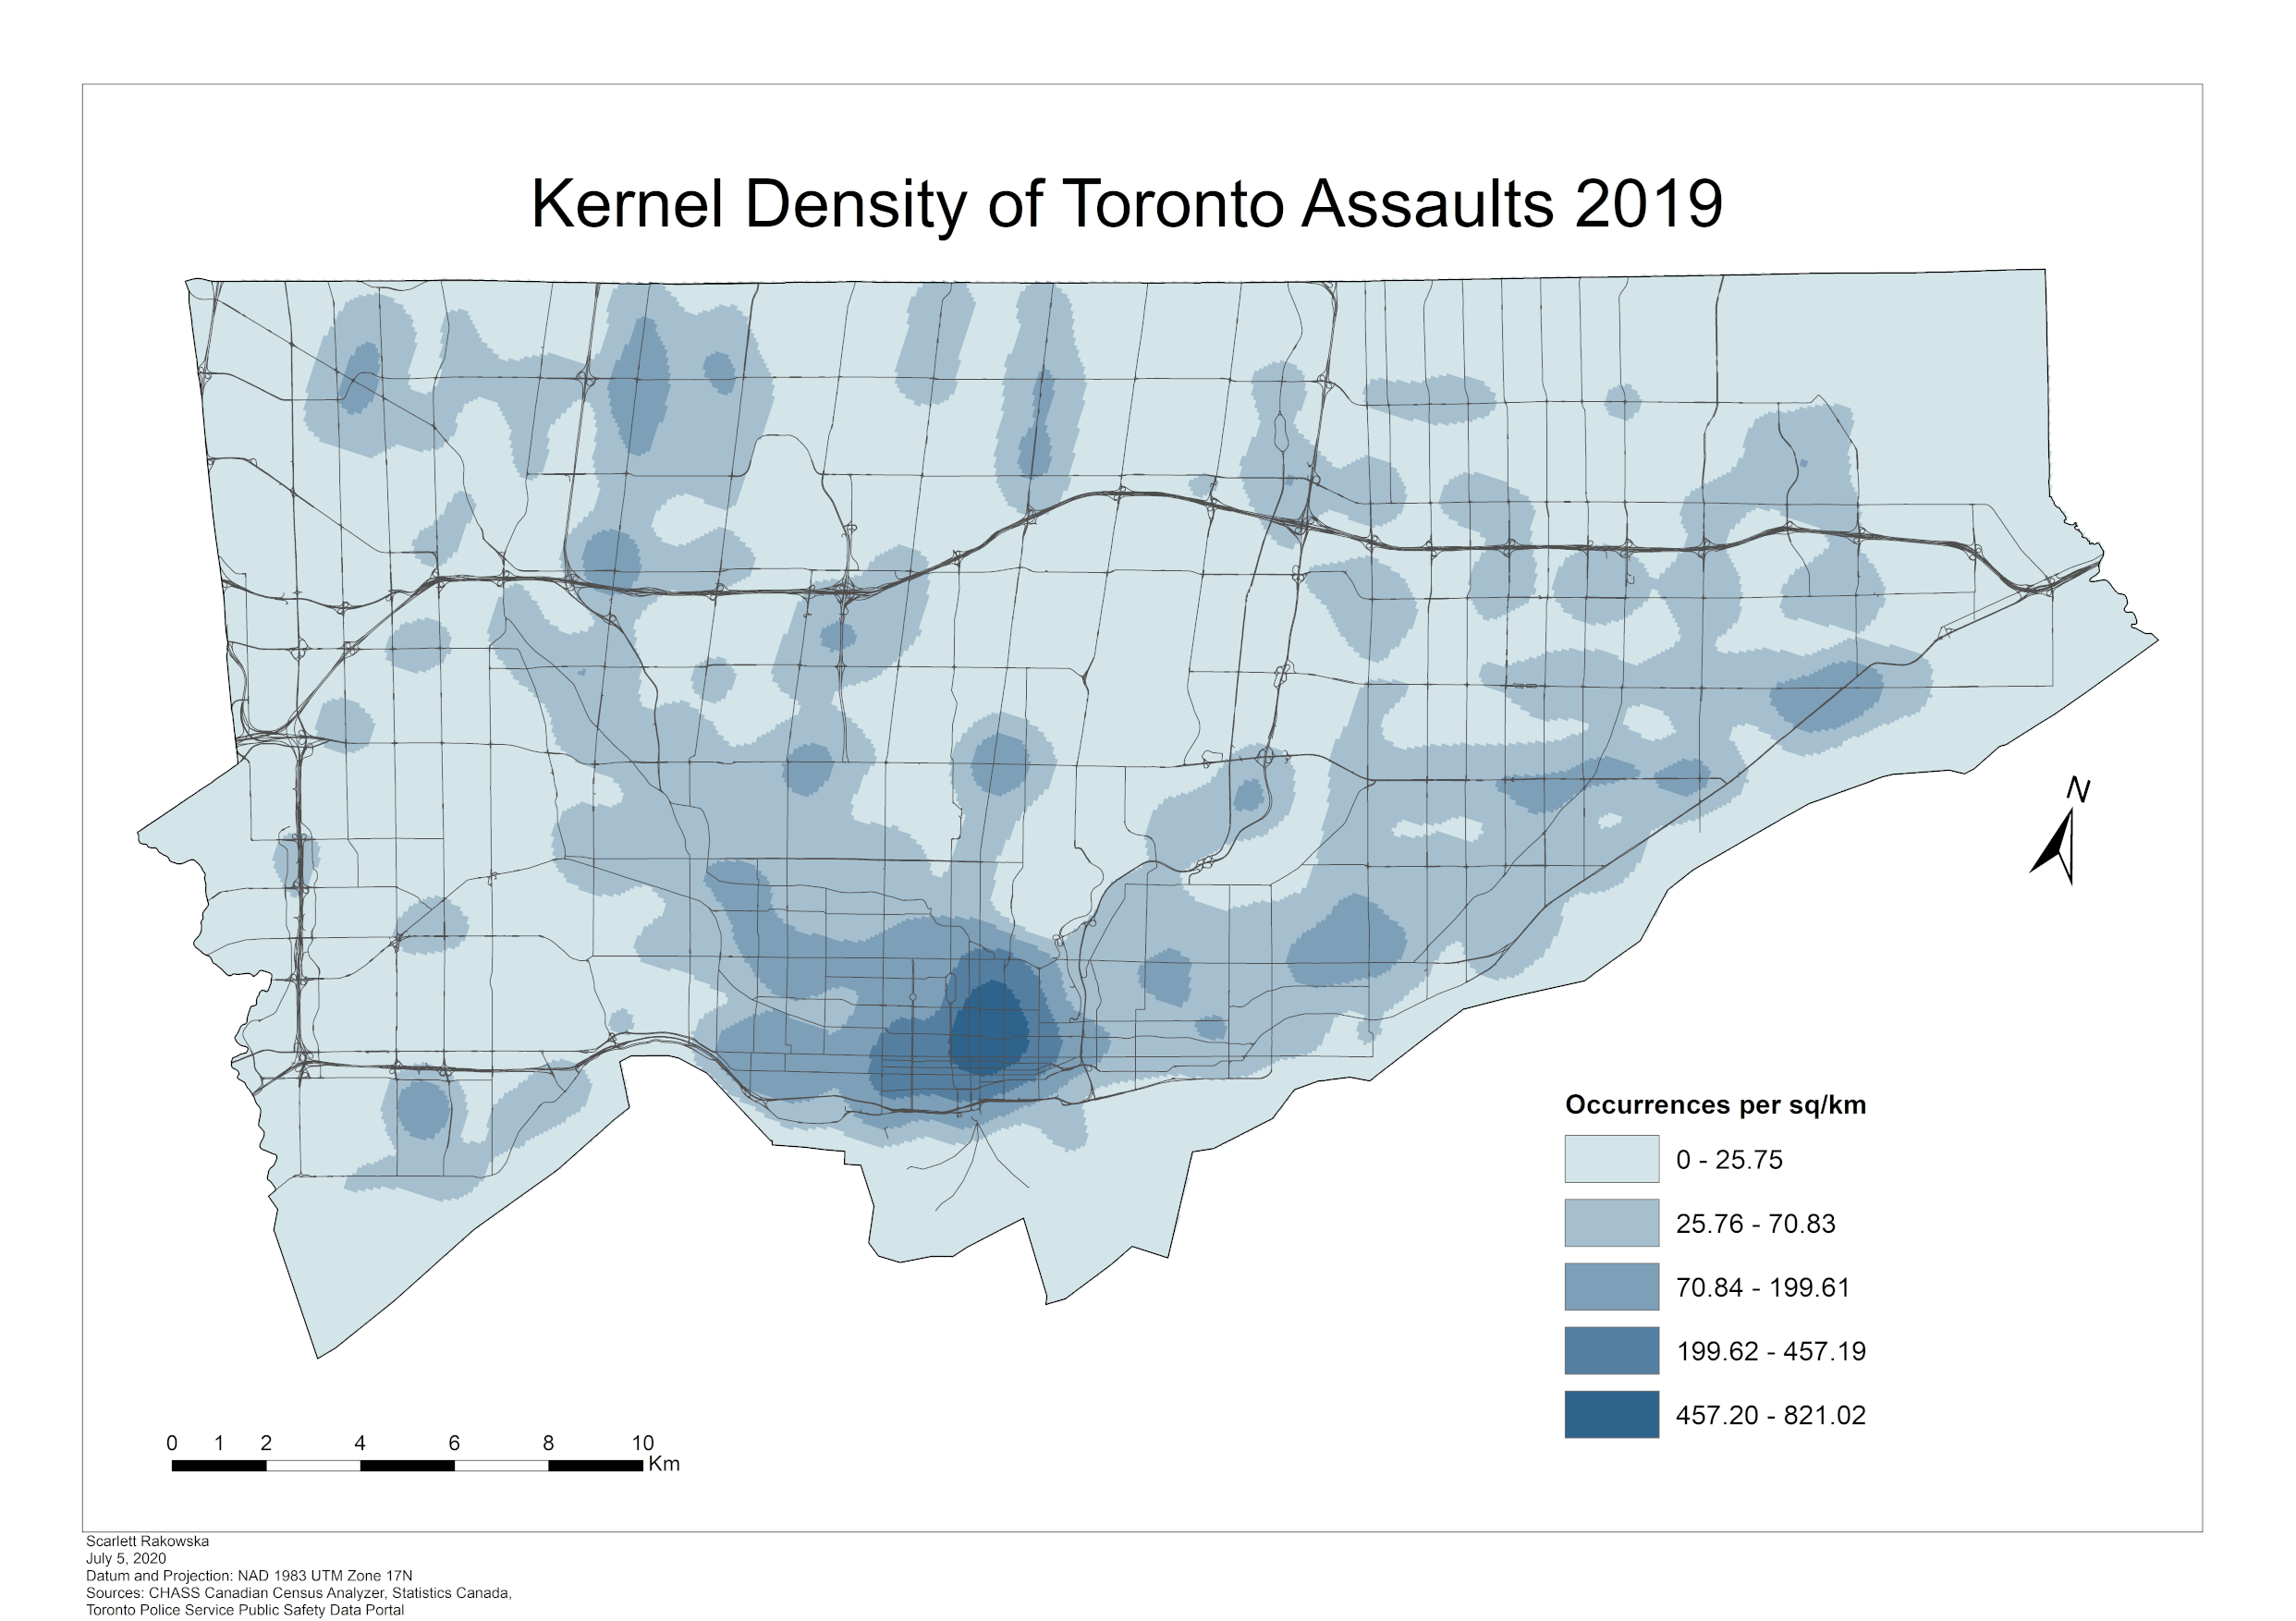
In the six maps below, the darker the colour gets, the more occurrences per 1km2 there are. It is important to note that each map has different ranges assigned to the colour classes. To compare numbers between the maps, refer to the values in the legend of each map.
Assaults
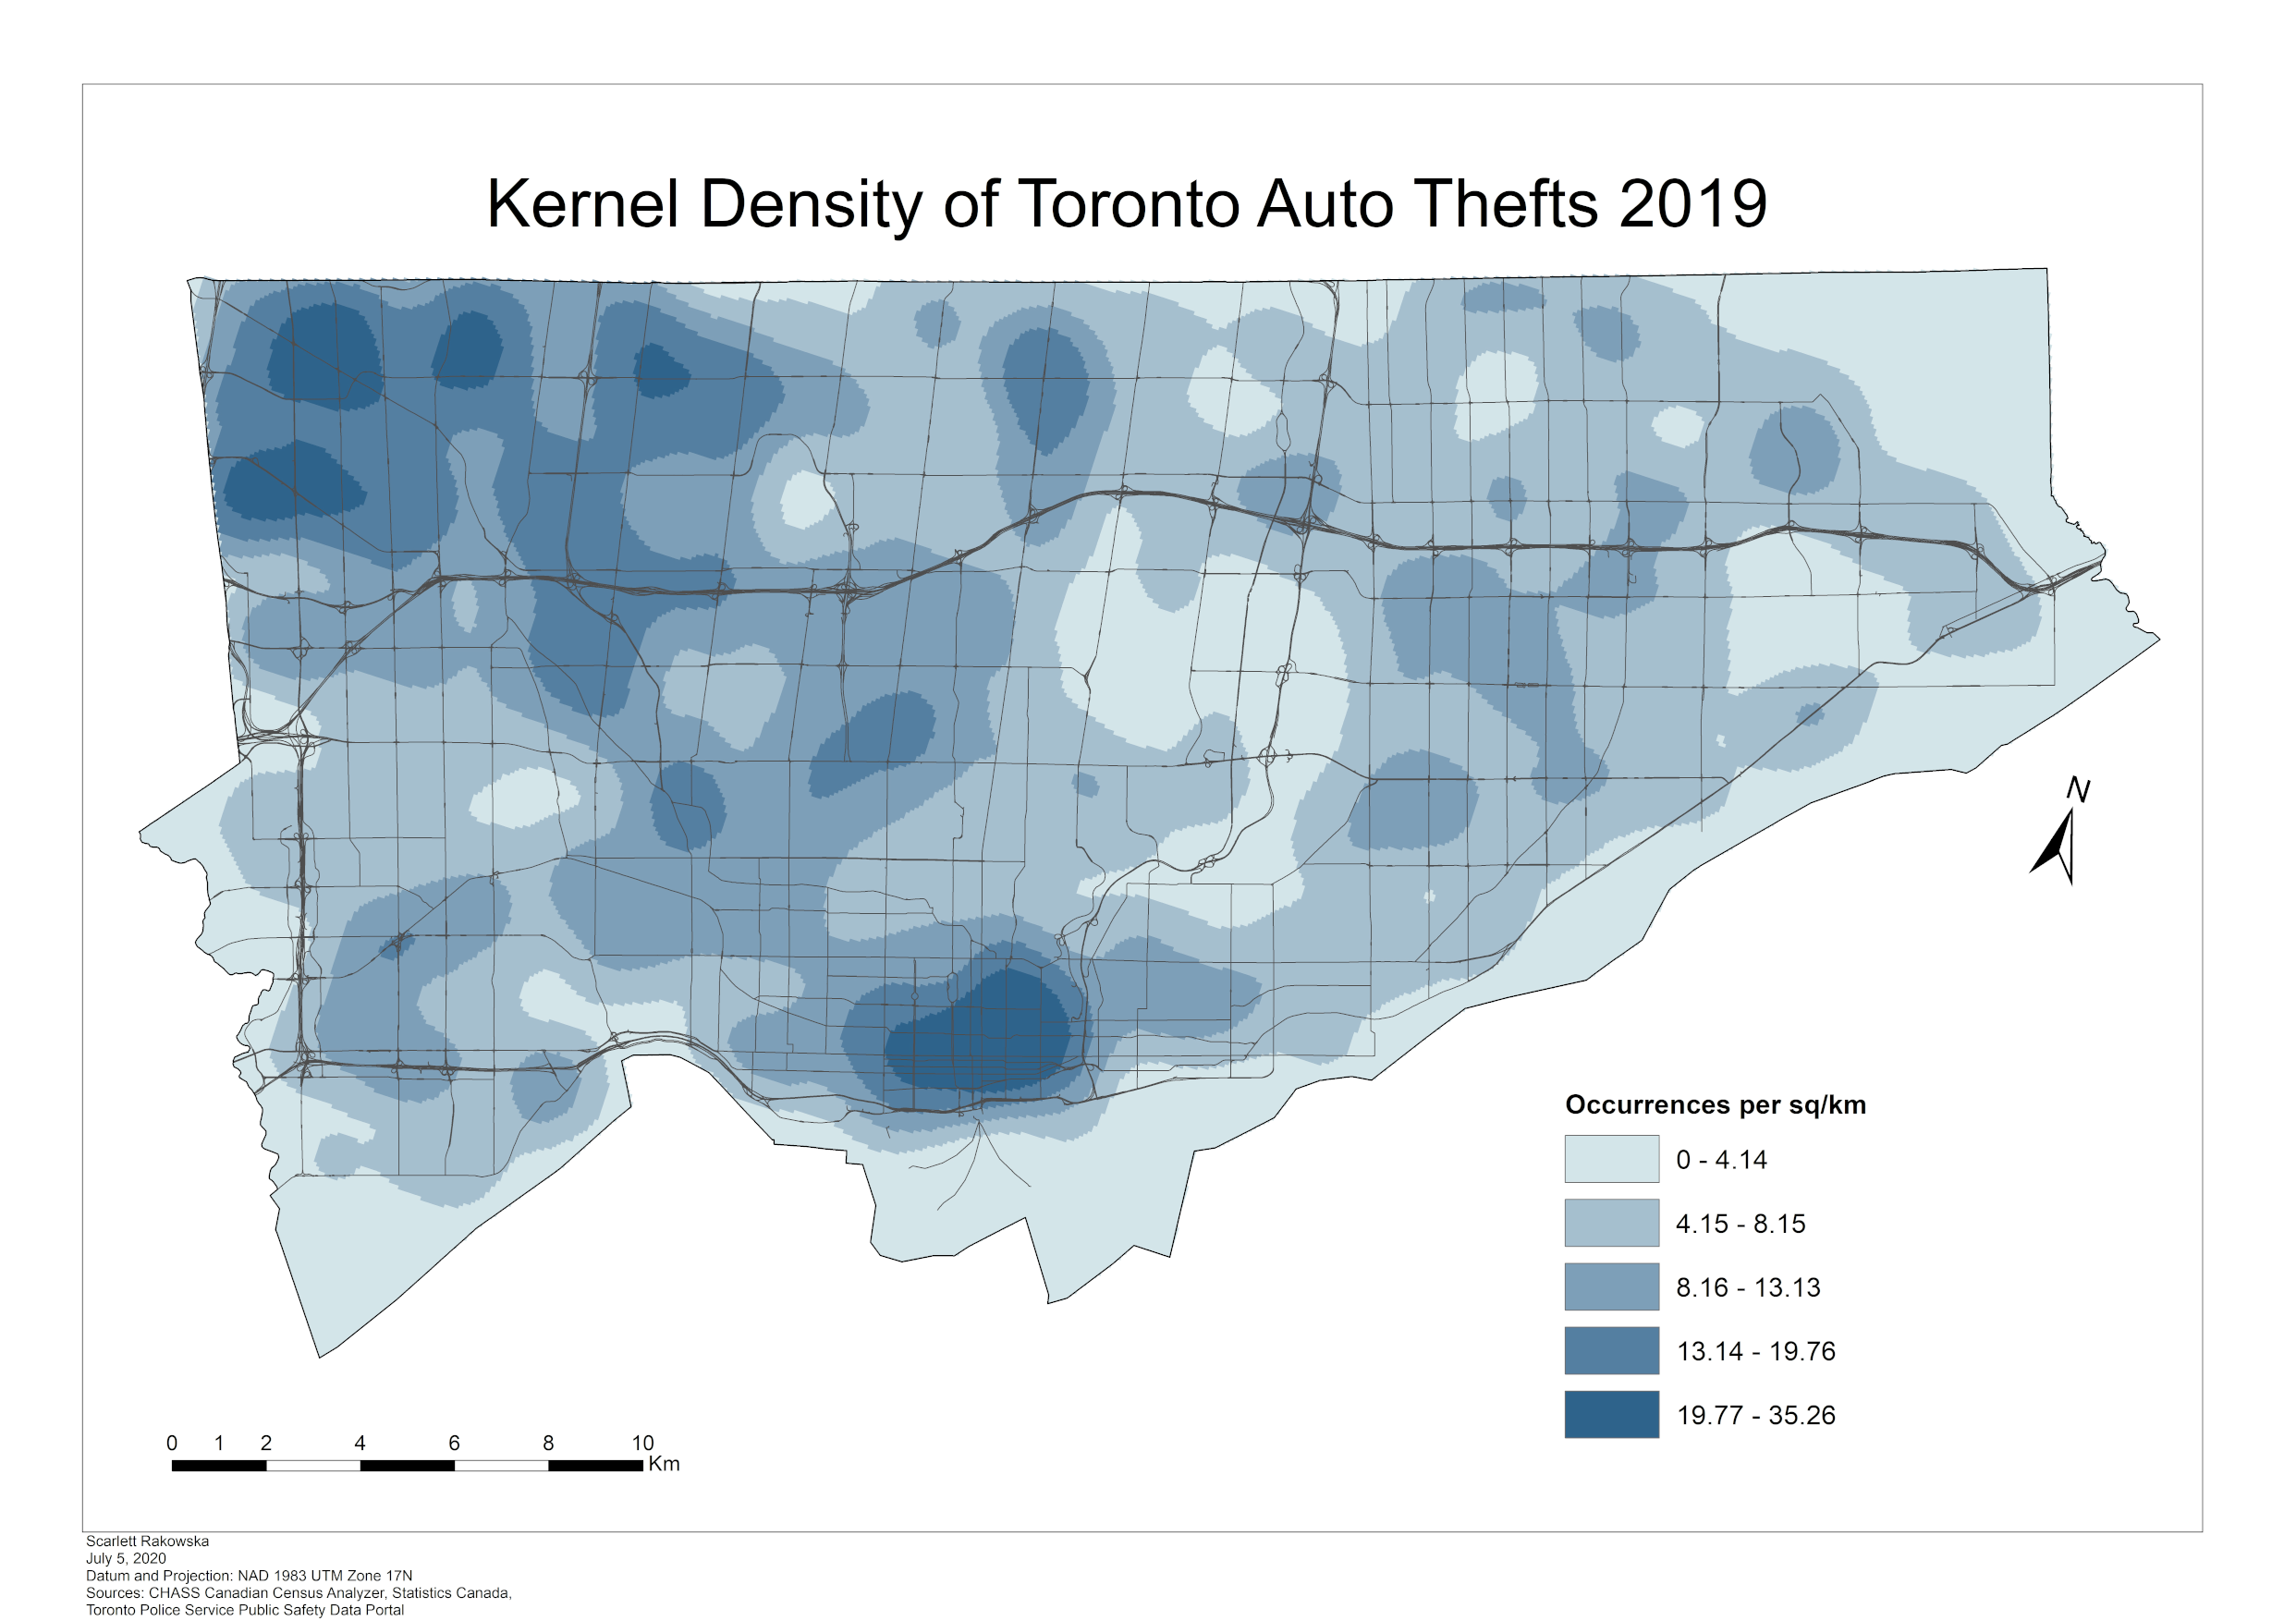
Auto Thefts
Break and Enters

Homicides

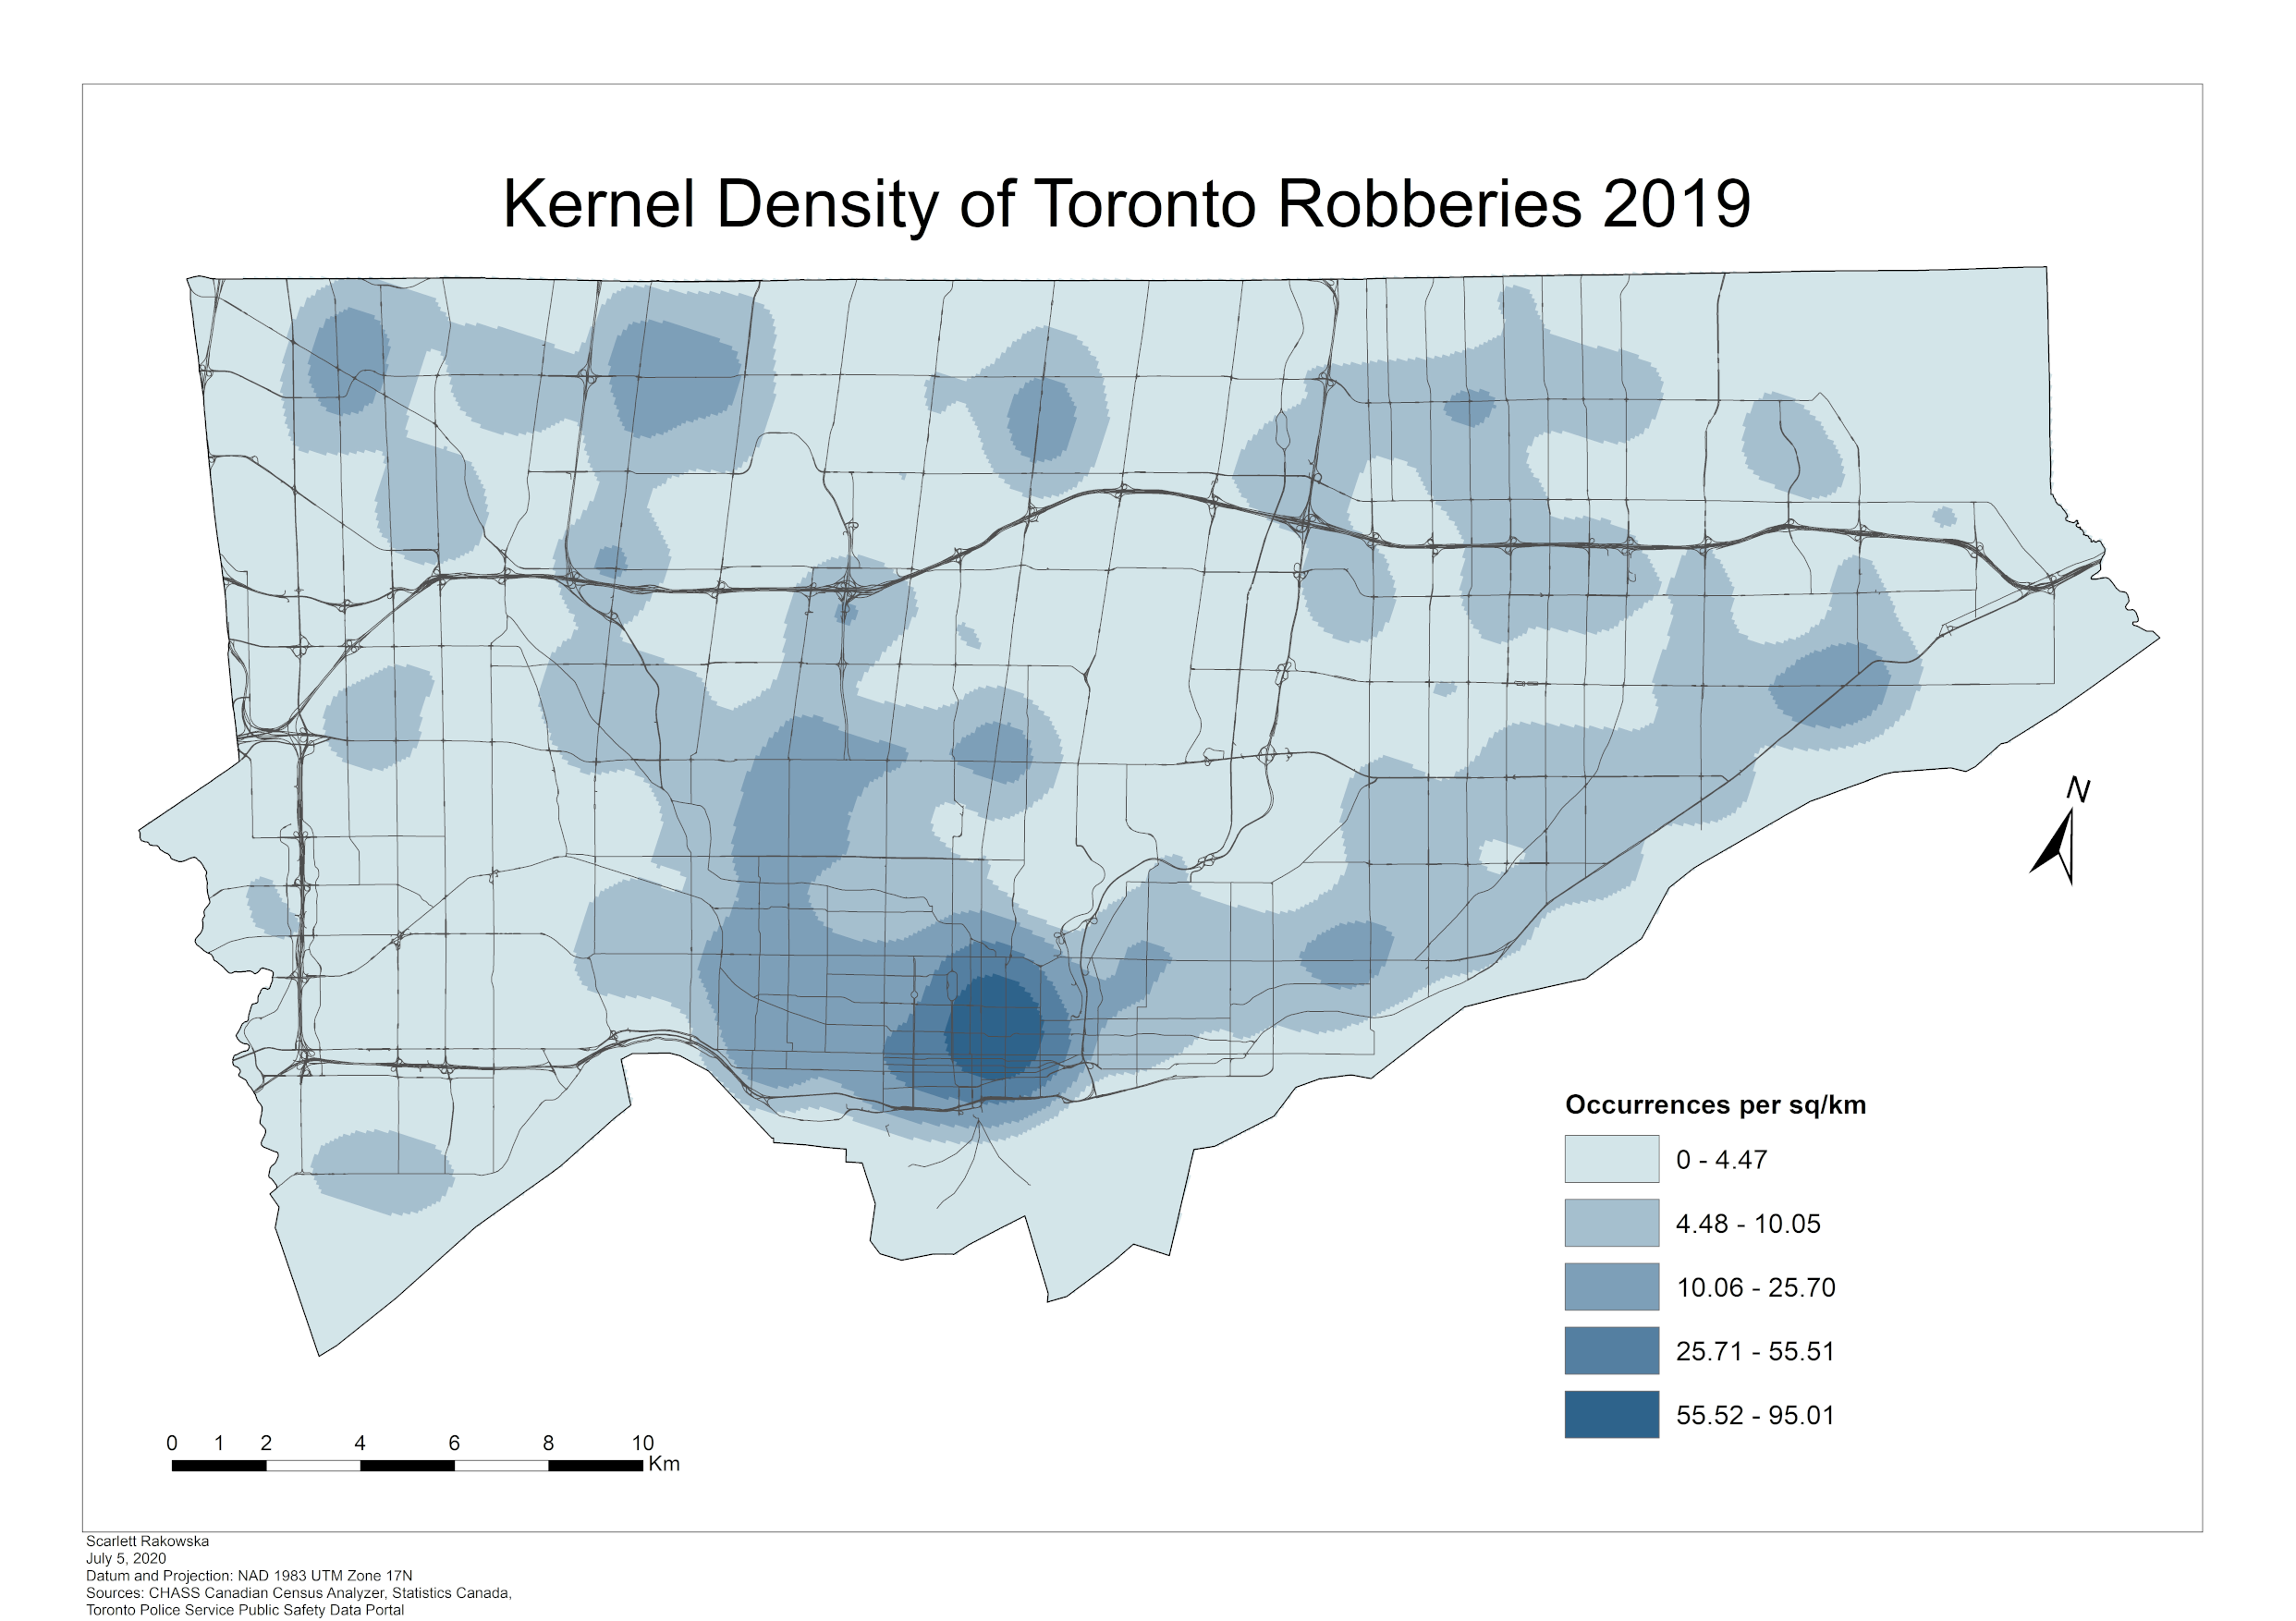
Robberies
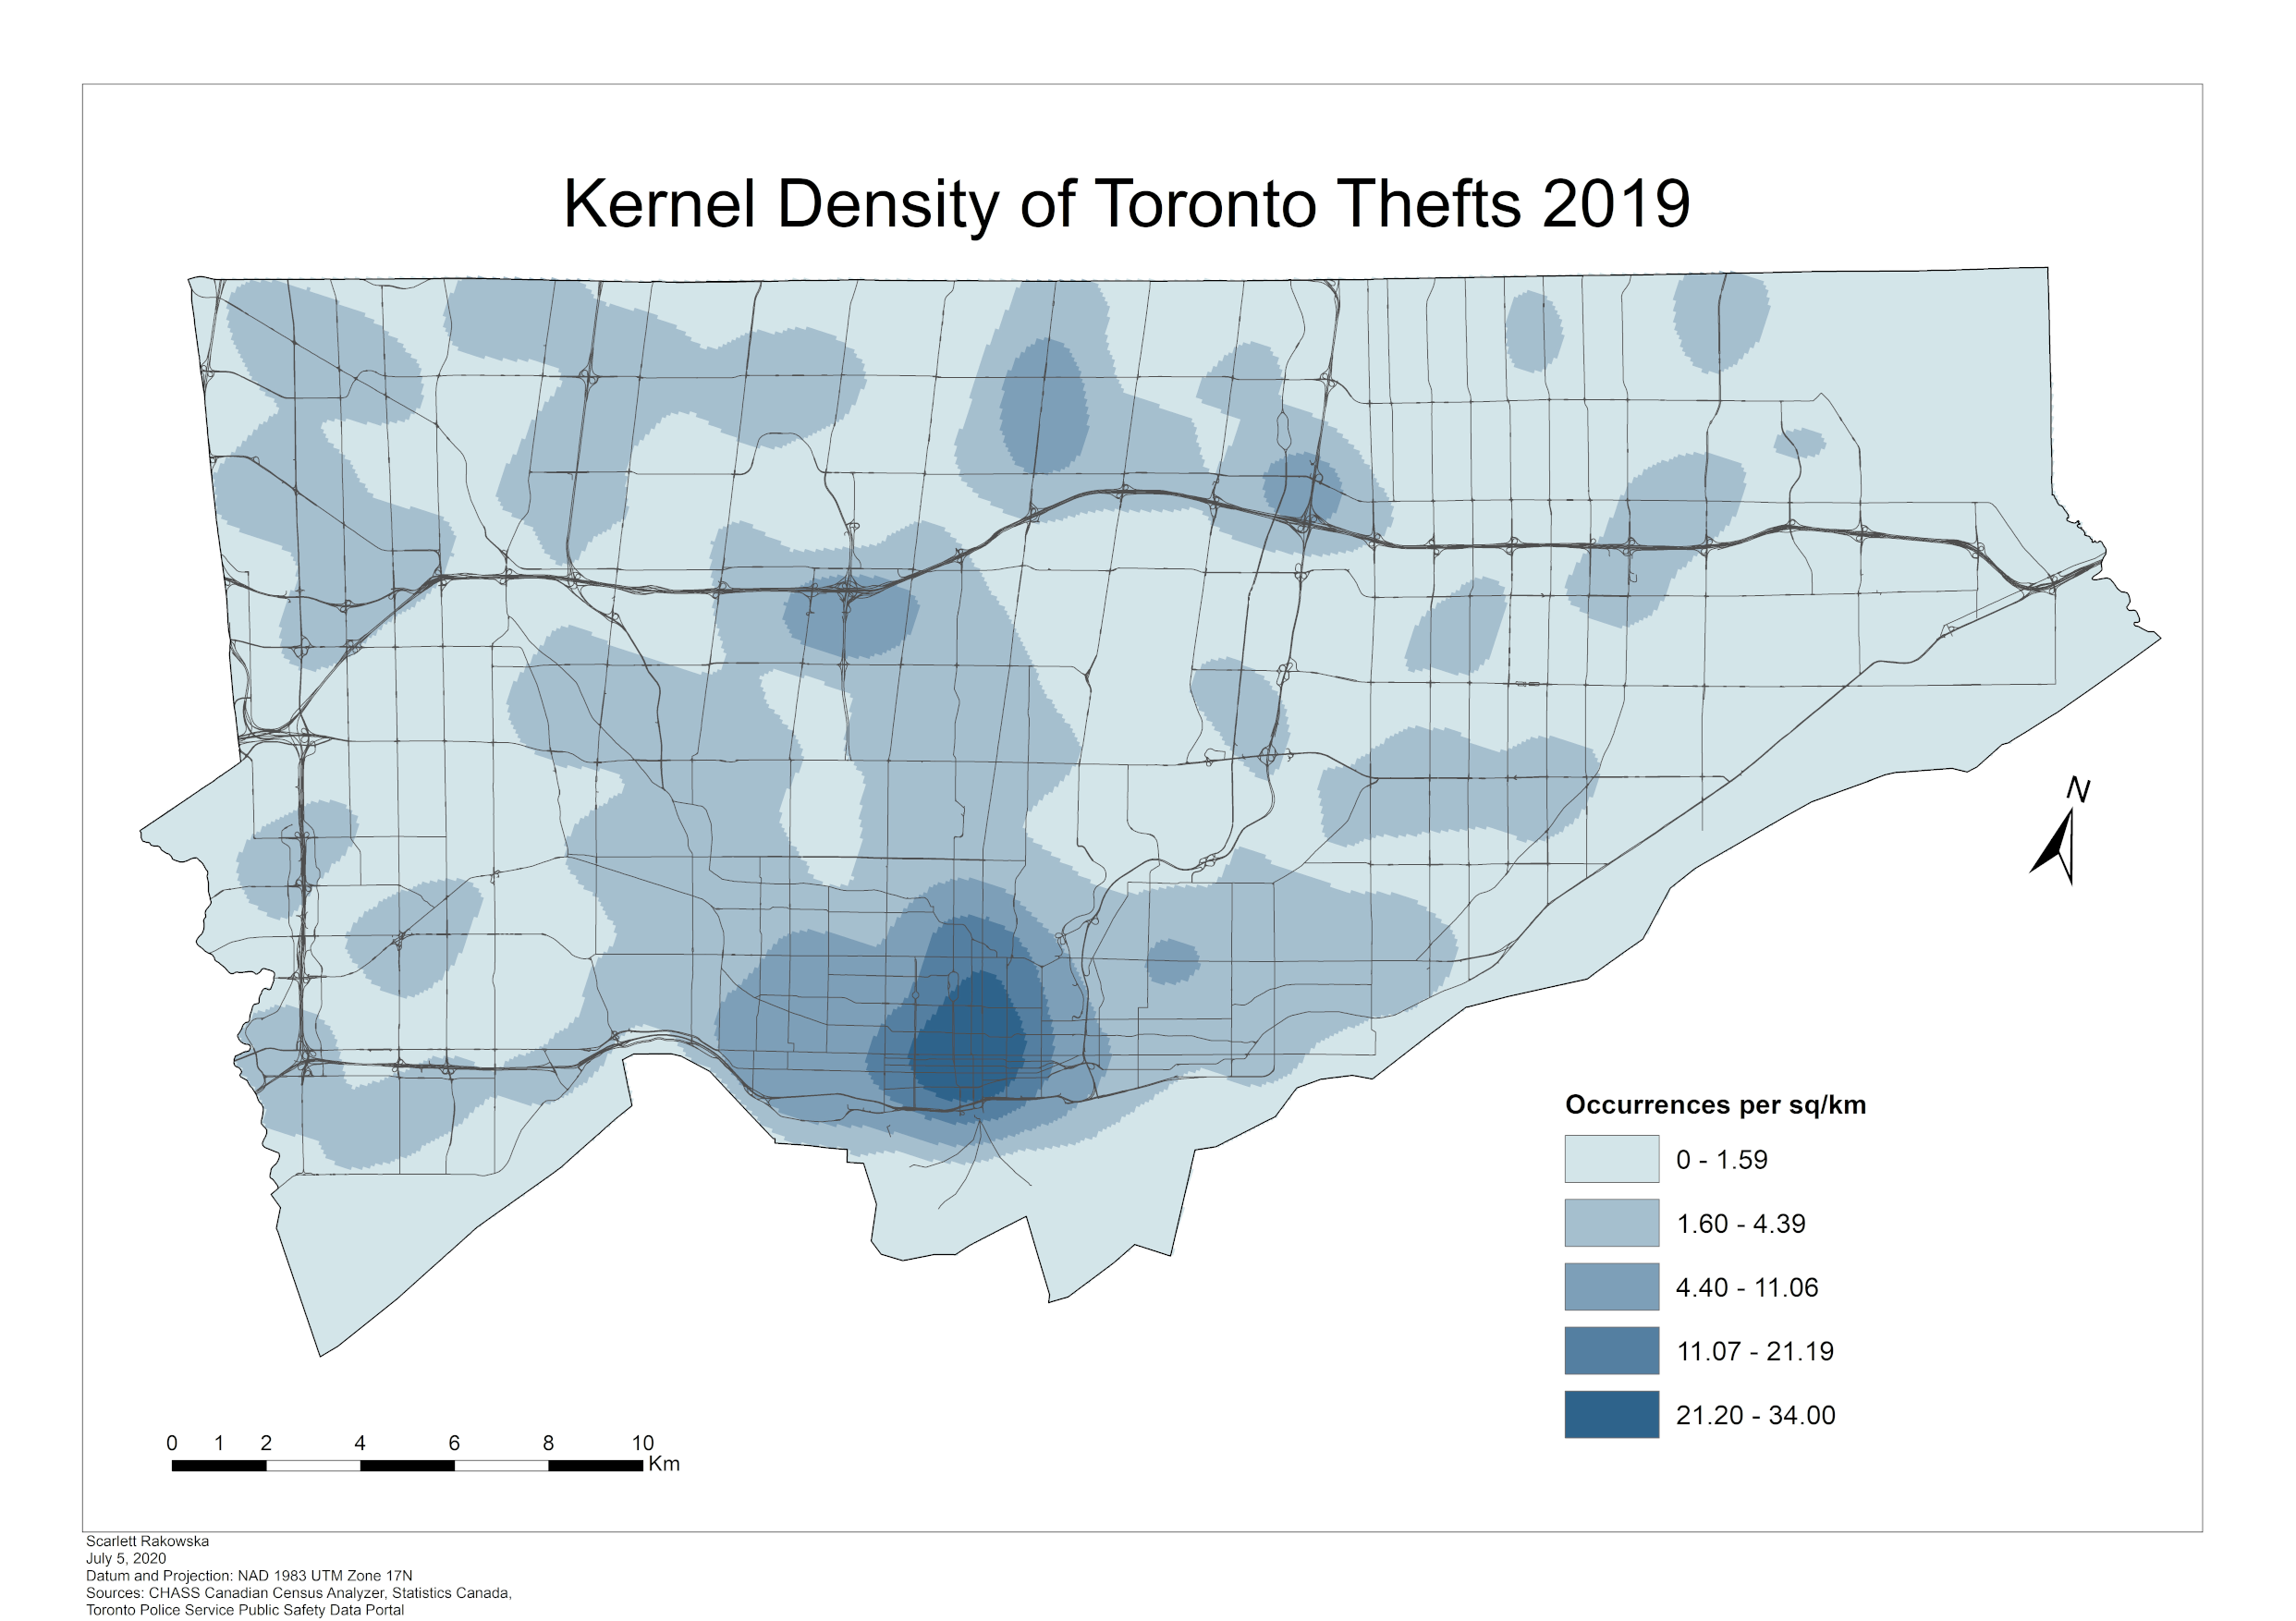
Thefts Over
DISCUSSION
When mapping the kernel density of the major crime indicators in Toronto, it is evident that patterns occur. In all six maps above, it is clear that the most occurrences per sq/km are centred in the downtown core of Toronto, around the Yonge and Dundas area.
The most frequent crime indicator appears to be the assaults that took place in Toronto. In the Yonge and Dundas area, where there are the most assaults, about 457 to 821 assaults in 2019 have occurred in that area per square kilometre. Robberies are also common, as about 55 to 95 assaults occurred in each square kilometre in the same area. The number of thefts over $5000 per square kilometre spread outwards from the Yonge and Dundas area but also occurred about 21 to 34 times per square kilometre. Break and enters were dispersed a little more, but still more concentrated in the Yonge and Dundas area, and occurred about 114 to 184 times per square kilometre in 2019.
While the pattern of these major crime indicators being focused on the downtown core was expected, it is appropriate to compare these data visually through the city’s population density.
Population Density

In this map, we can see that the population density of Toronto in 2016 is focused, also, in the Yonge and Dundas area. The population spreads outwards to the east and west of the city, as similarly shown in the kernel density maps shown above. This pattern of having these major crime indicators in Toronto be focused in the Yonge and Dundas square is evident until we look at the auto thefts of 2019. Again, the auto thefts of 2019 are still focused on the downtown core area but have a high frequency in the north-west side of Toronto. The downtown core had about 19 to 35 auto thefts per square kilometre in 2019, while the north-west side of the city had about 13 to 19 auto thefts per square kilometre. When looking at the auto thefts map, there appears to be a “trail” from the downtown core to the north-west side of the city as well. When looking at the map of homicides, it is evident that the same pattern is occurring. Again, there is a focus in the downtown core with about 0.38 to 0.50 occurrences per square kilometre, while also seeing a “trail” going into the north-west area of the city.
When looking at the auto thefts and the homicides, there is a north-western pattern that arises while densities are still highest in the downtown area of the city like the other four indicators. This pattern would have to be further analyzed.
CONCLUSION
It is evident that when looking at all six maps of major crime indicators in Toronto from 2019, there is a concentration in the Yonge and Dundas area. Some indicators begin to spread out a little further but are still higher in the downtown core. Although, when looking at the auto thefts and homicides, even though they continue the pattern of intensity in the downtown core, like the other four indicators, the occurrences have are also relatively frequent in the north-west areas of the city.
REFERENCES
How Kernel Density works: https://desktop.arcgis.com/en/arcmap/latest/tools/spatial-analyst-toolbox/how-kernel-density-works.htm
Kernel Density (Spatial Analyst): https://pro.arcgis.com/en/pro-app/tool-reference/spatial-analyst/kernel-density.htm
DATA
Statistics Canada. (2016). Census Profile, 2016 Census. Retrieved from: https://www12.statcan.gc.ca/census-recensement/2016/dp-pd/prof/details/Page.cfm?Lang=E&Geo1=CSD&Code1=3520005&Geo2=PR&Data=Count&B1=All
Toronto Police Service. (2019). Public Safety Data Portal. Retrieved from: https://data.torontopolice.on.ca/