
Identifying Dense Oil and Gas Producing Regions for Methane Emissions Verification Screenings in Alberta, Canada Using ArcGIS Pro
Introduction
As mentioned in my previous blog post, in 2018, the Government of Canada introduced regulations to reduce methane (CH4) emissions from the upstream oil and gas (O&G) sector 40%-45% below 2012 levels by 2025[1]. To comply with these regulations, producers must conduct leak detection and repair (LDAR) surveys 3x/year at larger O&G facilities and 1x/year at those handling smaller volumes of gas. Specifically, this requirement is designed to limit fugitive emissions (accidental leaks) from components and equipment that should not be emitting as part of regular operations[2]. In Alberta, for example, LDAR surveys must be completed with handheld instruments like organic vapor analyzers or optical gas imaging (OGI) cameras. Alternative equipment and methodologies can also be used once their emissions detection capabilities are proven equal, but they must be tested in a pilot program, and fully approved by the regulator[3].
This has resulted in the emergence of new detection technologies that integrate CH4 sensors on platforms like vehicles, drones, aircraft, and satellites[4]. The strong appeal of these technologies to producers is that they are more efficient and thus more cost-effective than traditional, labor-intensive handheld methods[5]. After using any of the approaches mentioned above for LDAR surveys at O&G facilities, operators must make the measured volumes of CH4 available to the regulator in an annual report[3]. Theoretically, reported volumes of fugitive emissions should decrease through time since leaks are being detected, tagged, and repaired at different temporal scales. However, fugitive CH4 emissions are stochastic; one measurement at a given point in time may not capture abnormal operating conditions which could low-bias annual estimates[6].
Using Alternative Detection Technologies for Emissions Reduction Verification
Personally, I am interested in ways that regulators can use alternative CH4 detection technologies to verify that emissions reductions are in fact taking place. Without a methodology that accomplishes this task, evaluating the effectiveness of current regulations and trajectories towards climate targets in different jurisdictions may prove difficult. In Alberta, for example, the Alberta Energy Regulator (AER) oversees energy development activities and as a result is able to conduct fugitive emissions surveys and/or screenings at O&G facilities if needed[3]. Screenings are normally done at the facility, geologic basin, or regional spatial scale with vehicle-based systems, aircraft, or satellites. If anomalous levels of CH4 are detected, ground-based crews with more sensitive instruments can be sent to specific areas or facilities for follow-up surveys to identify the source of emissions.
I believe it would be beneficial in terms of reaching the emissions reduction goal of 40%-45% by 2025 if regulators were to use frequent screenings of densely populated O&G production areas as a way to verify aggregated, reported volumes of fugitive emissions. For example, regulators could use aircraft or satellites outfitted with CH4 sensors to take top-down measurements of geographic areas that have the potential to be large sources of emissions. This could be done at pre-determined, recurring intervals, and measurements could be used in calculations to create annual estimates for fugitive emissions from these areas. Measurements made by the regulator could then be used to evaluate the effectiveness of current regulations; if reductions are not visible between measurement times, adjustments could be made to better align current progress towards the emissions reduction goal. Prior to this, however, areas with high O&G well density need to be identified; a task made straightforward using the Kernel Density (KD) tool programmatically in ArcGIS Pro. Inspiration for this analysis was drawn from Fox et al. (2019a) Figure 1.
Identifying Areas for Regulatory Methane Screenings Using Kernel Density Analysis
Here, I use Alberta as an example because of its long history of O&G development which has populated the provincial landscape with wells. The AER maintains a shapefile of well locations[7] which can be easily downloaded and added to a file geodatabase in ArcGIS Pro. However, given that hundreds of thousands of O&G wells have been drilled in the province, a problem arises when the data are visualized on a base map (Figure 1). Essentially, the data lack meaning; regions with the most wells can not be differentiated from those that are sparsely populated. In this format, the data would not inform the regulator of where aircraft or satellite screenings should be directed for the most economical emissions verification measurements.

A solution for this is to run the KD tool in ArcGIS Pro programmatically on the shapefile which, in this instance, calculates the magnitude-per-unit-area of O&G well point features[8]. This tool can be selected from the spatial analyst toolbox and used through the Geographic User Interface (GUI). However, it can also be used programmatically by running two simple lines of code in the Python interpreter as pictured below. In order to access the KD function, the spatial analyst toolbox needs to be imported into the ArcPy environment. After that, the KD function can be accessed and only requires two parameters be passed for execution. These are the features to be used by the tool and the population field. All other parameters are optional, as the cell size and search radius can be optimized by ArcGIS Pro. In this case, I specified the population field to be “NONE” because all points were to be weighted equally.
from arcpy.sa import *
KernelDensity("Oil and Gas Well Locations (Bottom Hole)", "NONE")
Running these two lines of code produced a single-band raster which was output to the file geodatabase. The raster was then able to be added to the map frame, and the result is significantly improved communication of the data (Figure 2). Another and more detailed example of this code can be found on ESRI’s website here.
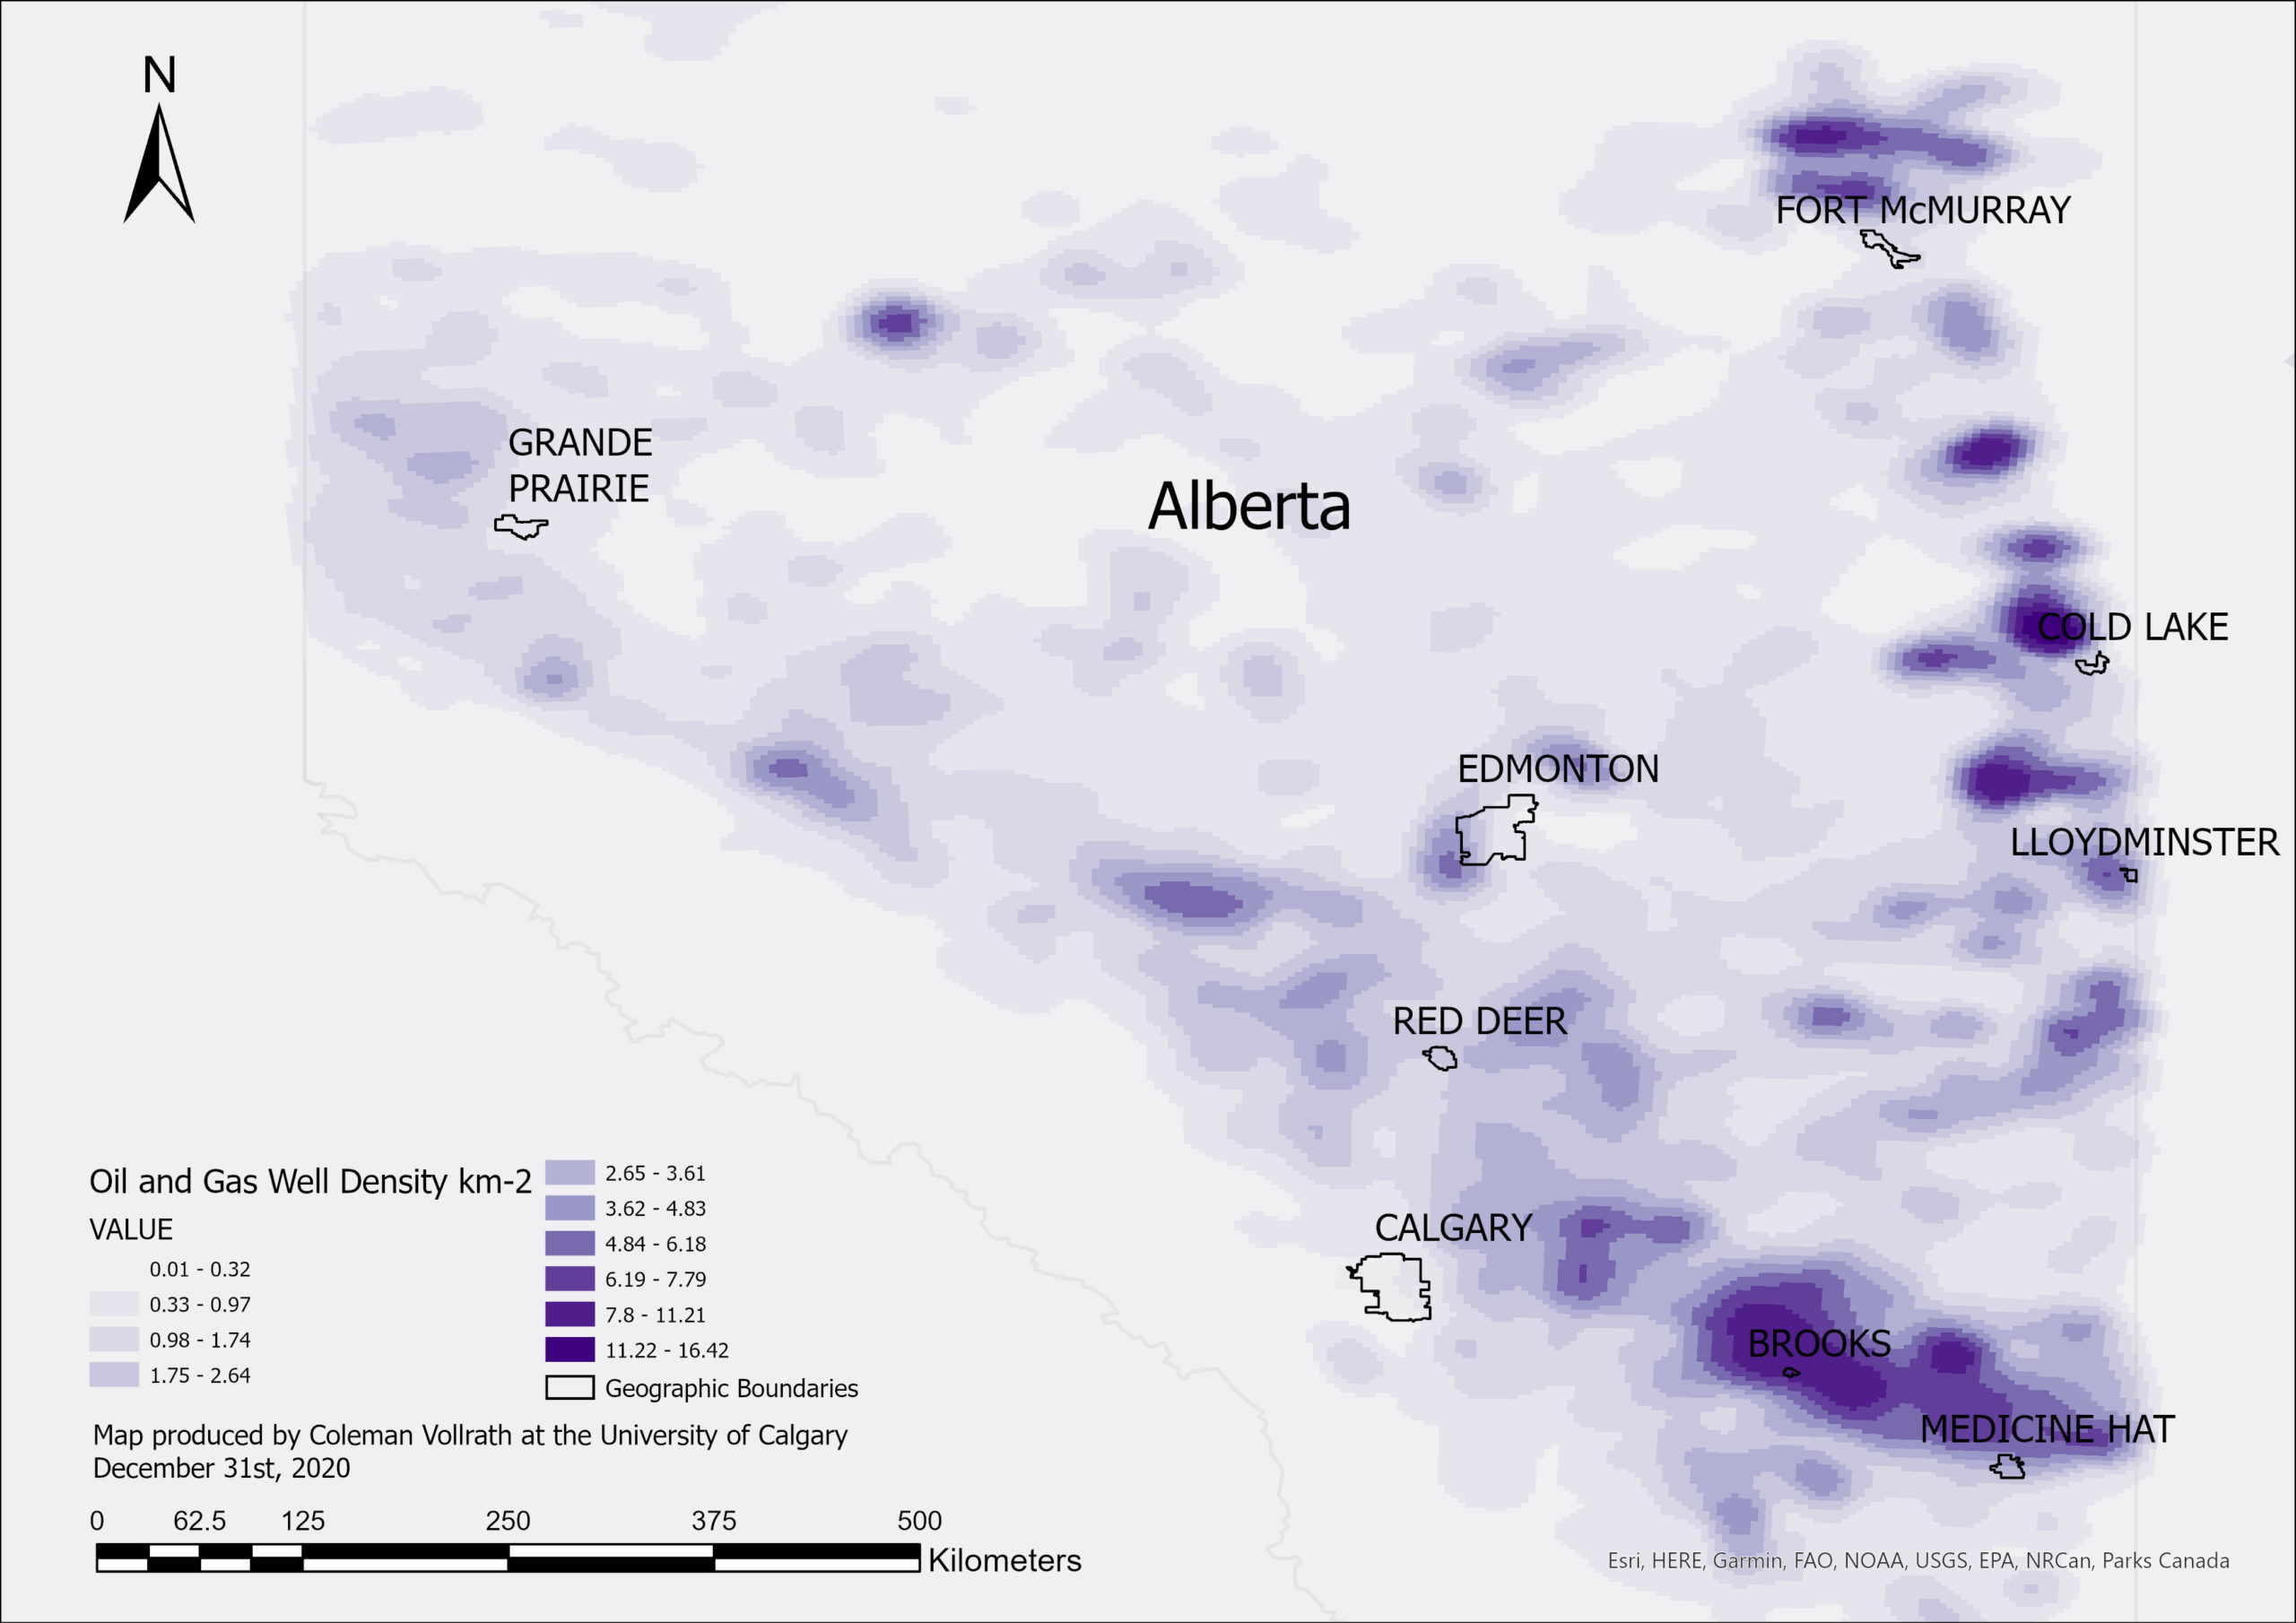
Interestingly, ArcGIS Pro also applied a multipart color scheme to the raster. This color scheme combines color and transparency for effective data communication to the map user. The only aspect of the symbology that needed to be changed was binning the data based on natural breaks instead of equal intervals since O&G wells are not normally distributed across Alberta. This map, in comparison to Figure 1, better communicates the information that the regulator would need before directing aerial screenings to specific areas in Alberta. The high-density producing regions identified here could be prioritized for top-down emissions verification screenings because in these areas, there are more pieces of equipment and components capable of emitting CH4. Moving forward, I plan to build further on this research to demonstrate the opportunity that regulators have to verify that emissions reductions are taking place as a way to support the achievement of current emissions reduction goals.
References
- Government of Canada. (2020). General information factsheet for the Regulations Respecting Reduction in the Release of Methane and Certain Volatile Organic Compounds (Upstream Oil and Gas Sector). https://www.canada.ca/en/environment-climate-change/services/canadian-environmental-protection-act-registry/factsheet-general-information-regulations-reduction-methane.html
- Government of Canada. (2020). Technical information factsheet for the Regulations Respecting Reduction in the Release of Methane and Certain Volatile Organic Compounds (Upstream Oil and Gas Sector. https://www.canada.ca/en/environment-climate-change/services/canadian-environmental-protection-act-registry/factsheet-technical-information-regulations-reduction-methane.html
- AER. (2020). Directive 060: Upstream Petroleum Industry Flaring, Incinerating, and Venting. https://www.aer.ca/regulating-development/rules-and-directives/directives/directive-060
- Fox et al. (2019a). A review of close-range and screening technologies for mitigating fugitive methane emissions in upstream oil and gas. Environmental Research Letters, 14(5), 053002.
- Fox et al. (2019b). A methane emissions reduction equivalence framework for alternative leak detection and repair programs. Elementa, 7(1).
- Alvarez, R. A., Zavala-Araiza, D., Lyon, D. R., Allen, D. T., Barkley, Z. R., Brandt, A. R., … & Kort, E. A. (2018). Assessment of methane emissions from the US oil and gas supply chain. Science, 361(6398), 186-188.
- AER. (2020). ST 37: List of Wells in Alberta Monthly Updates [Data file]. https://www.aer.ca/providing-information/data-and-reports/statistical-reports/st37
- ESRI. (2020). Kernel Density (Spatial Analyst). https://pro.arcgis.com/en/pro-app/latest/tool-reference/spatial-analyst/kernel-density.htm
- Altalis. (2020). Municipal Boundaries. [Data file]. https://www.altalis.com/map;id=113