
Gaining more experience with Experience Builder: Building Web Apps with ArcGIS Experience Builder
Recently, as an ECCE associate I was fortunate to be able to partake in a two-day course offered by Esri Canada: Building Web Apps with ArcGIS Experience Builder. While I have dabbled a bit in the self-guided lesson options available through the Esri Course Catalogue, this was the first instructor-led course for me (and the first ArcGIS course for me since my undergrad!). In this blog post I will speak to my motivation behind taking the course and takeaways for the App Challenge and beyond that may also be useful to readers interested in app development on this platform.
All my previous instruction in ArcGIS had been in ArcGIS Pro or the old ArcMap product, so this was another first stemming from a desire to improve upon the last Esri Canada App Challenge, where two colleagues and I placed second runner-up. While we had made a respectable showing last year, an area where we encountered difficulty and could have improved upon was app design and performance. Only one of our team members had previously worked with the ArcGIS Experience Builder so we leaned heavily upon him with app configuration and admittedly fumbled around in the program, particularly late in the challenge. Two notable weaknesses is that our app layout had some formatting issues and ultimately had to abandon the mobile device platform as we did not understand that functionality at the time.
One big takeaway from this course was to see app development for the whole process: Plan, Design, Configure, Customize and Deploy where the latter three are iterative to troubleshoot and refine with testing. This was something we mostly neglected last challenge as we spent far more time on the Plan stage of data acquisition and preparation for the app but much less on the other steps and without test deployment to iron out the inevitable bugs. Even with so much time in the Plan stage, reflecting back our app lacked focus on a particular audience or purpose and tried to be an ‘everything’ app with several pages that sometimes became tricky to navigate. The aim this year will be to develop a snappier app with a more clearly defined audience, which will aid in the deployment process where ideally one releases it to be demo-ed by users of the target audience to for bugs as well as usability above all. We certainly do not want to develop an app that requires a course of its own to operate!
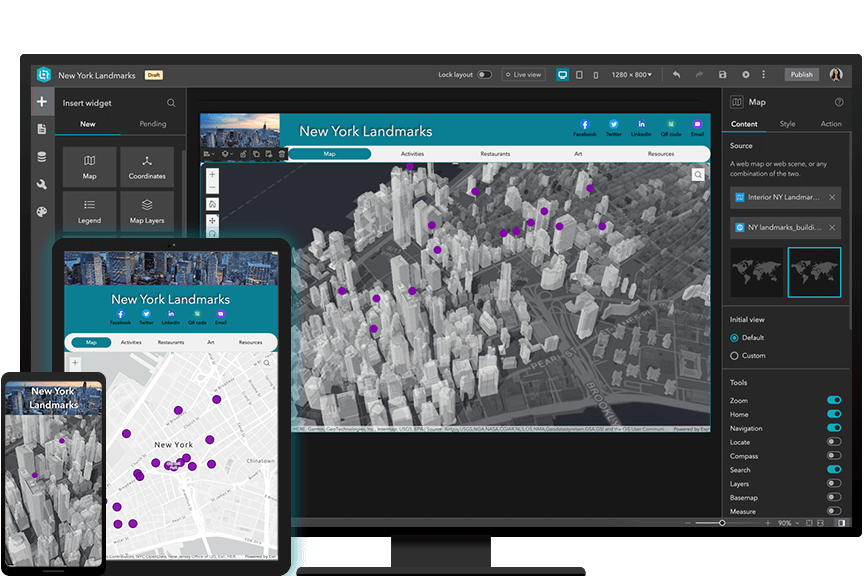
This will also allow for the Customize stage to be more meaningful, as our team only learned late in the challenge that our layouts were not consistent across the limited variation of our PCs (and web browsers). We did not take advantage of the layout customization options for different devices in Experience Builder. Indeed, with almost all of the pages of our app being Map-centric, we missed out on a lot of invaluable functionality (such as demonstrated here in the form of widgets) that could have taken it to the next level.
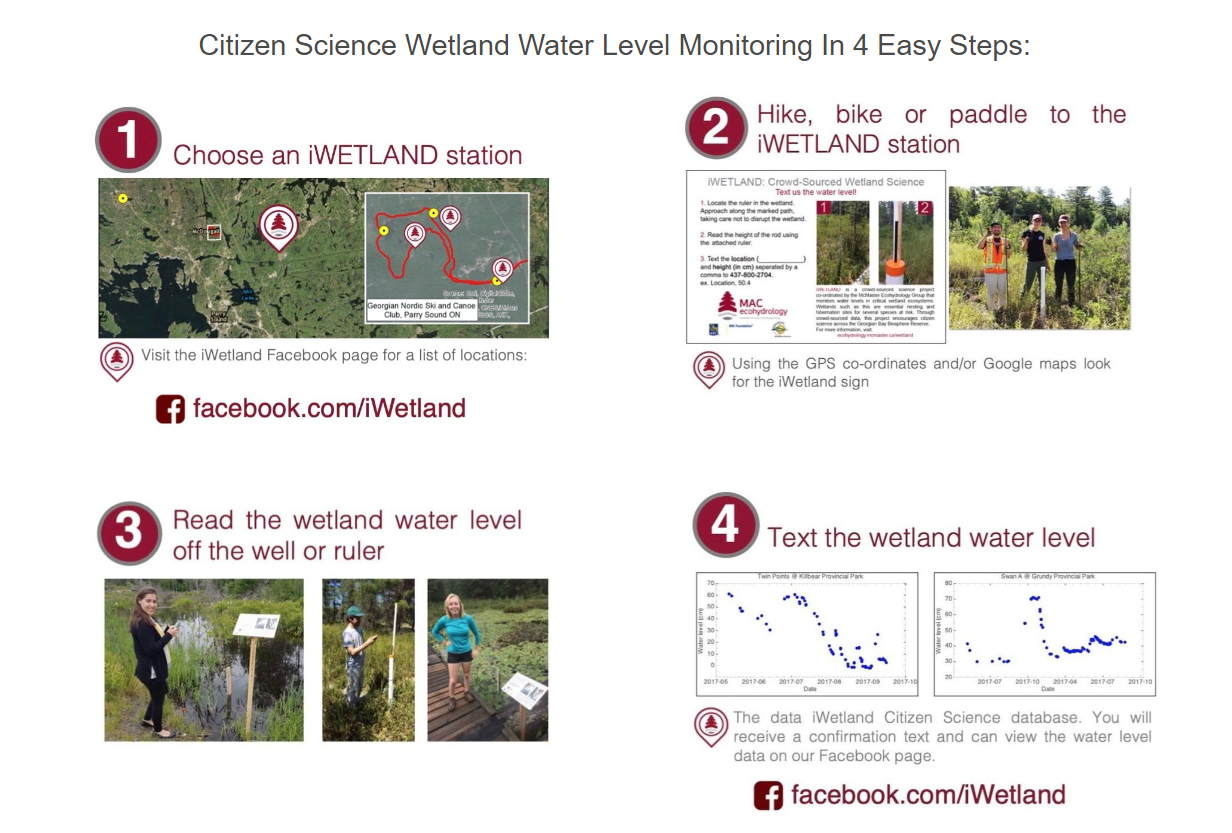
Beyond the App Challenge, towards possibilities in the wheelhouse of the McMaster Ecohydrology Lab that I am a part of, I am hoping to put these tools to use in the service of mobilizing our findings and involving the public in a more meaningful way akin to our previous citizen science project known as iWetland. In short, we set up water level monitoring stations in wetlands across the eastern Georgian Bay areas for citizens visiting trails and parks to record and submit measurements, as well as engage them on the importance of those ecosystems. This initiative relied on SMS messages for observations but looking back, a mobile-optimized GIS application would have been just the ticket to improve upon this, by easily giving participants access to live measurements, navigation to stations, and allowing them to submit pictures. Concluding with a publication in 2023, iWetland was able to engage nearly 2000 participants to record over 2600 water levels across its three years of operation in 24 wetlands. While there are no current plans for a revival, I would like to put its lessons to good use in the future, even if to give local communities a clearer idea of the extent, importance and status of their local wetlands (like in Step 4).
A web app will not become baked into any of my thesis chapters anytime soon, but I’d like to make a point of using this valuable tool to make data and/or data collection more accessible to others. My experiences with iWetland proved similar initiatives can be a rewarding exercise in science communication to the public. Lastly, a shout out to my excellent instructor for the Building Web Apps with ArcGIS Experience Builder and for others to dig into the vast learning resources available through Esri, whether to polish skills or if you’re just getting started with a program.