
2023 ECCE App Challenge: ConservNation Canada
It’s been several months since the whirlwind of the App Challenge held this past spring has come and gone. While I can’t speak to the entirety of this challenge and the resulting app developed with Team GIS (Gauging Impacted Species) consisting of myself, Daniel Van Veghel and Henry Gage, this post will elucidate upon some of the experience on my end and particular hurdles that had to be overcome to make the App a reality. First off, more documentation and link to the information video can be found at the following Esri Canada web page, where one may find our Github repository, demo and informational video.
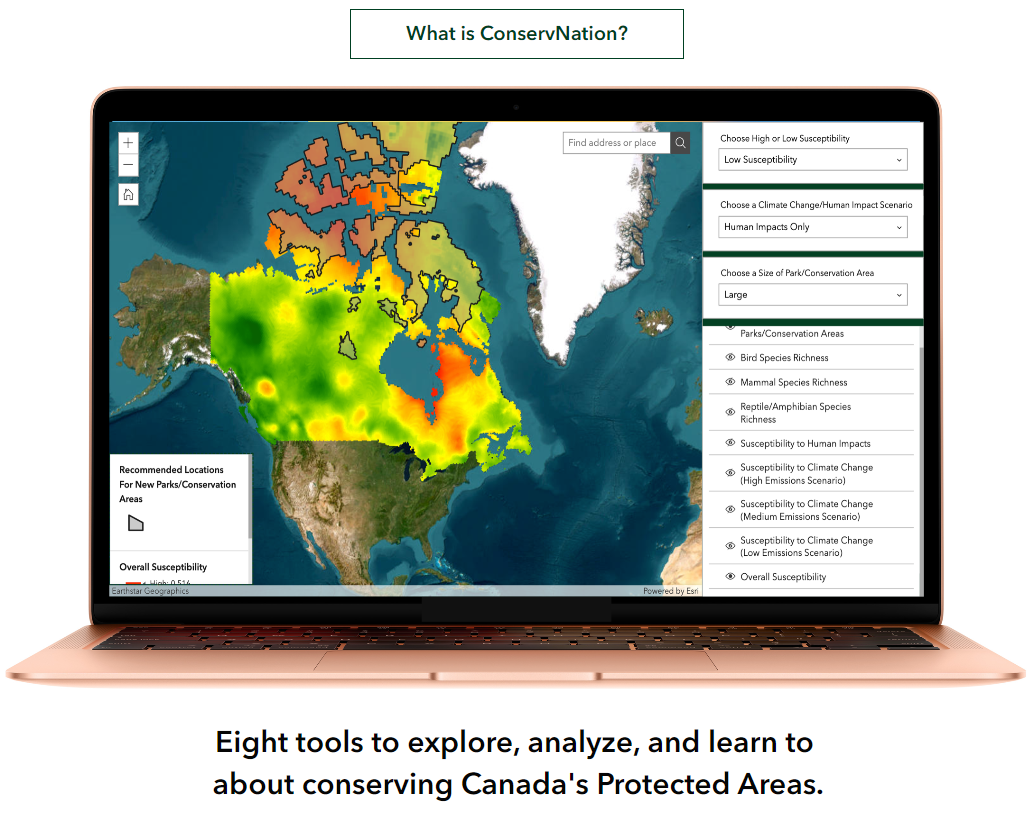
Our app, ConsevNation, was assembled in Esri’s Experience Builder, which I admittedly had no prior experience with but proved to be broadly beginner-friendly. It consists of eight modules, albeit the meat of the app in terms of data and functionality is found in those in bold:
- Canada’s National Parks
- Protected Areas at Risk
- Susceptibility Modelling
- Future Protected Areas
- Species at Risk
- What can I do to help?
- Indigenous Leadership in Conservation
- Additional Resources
The two modules where I played a large role were the following:
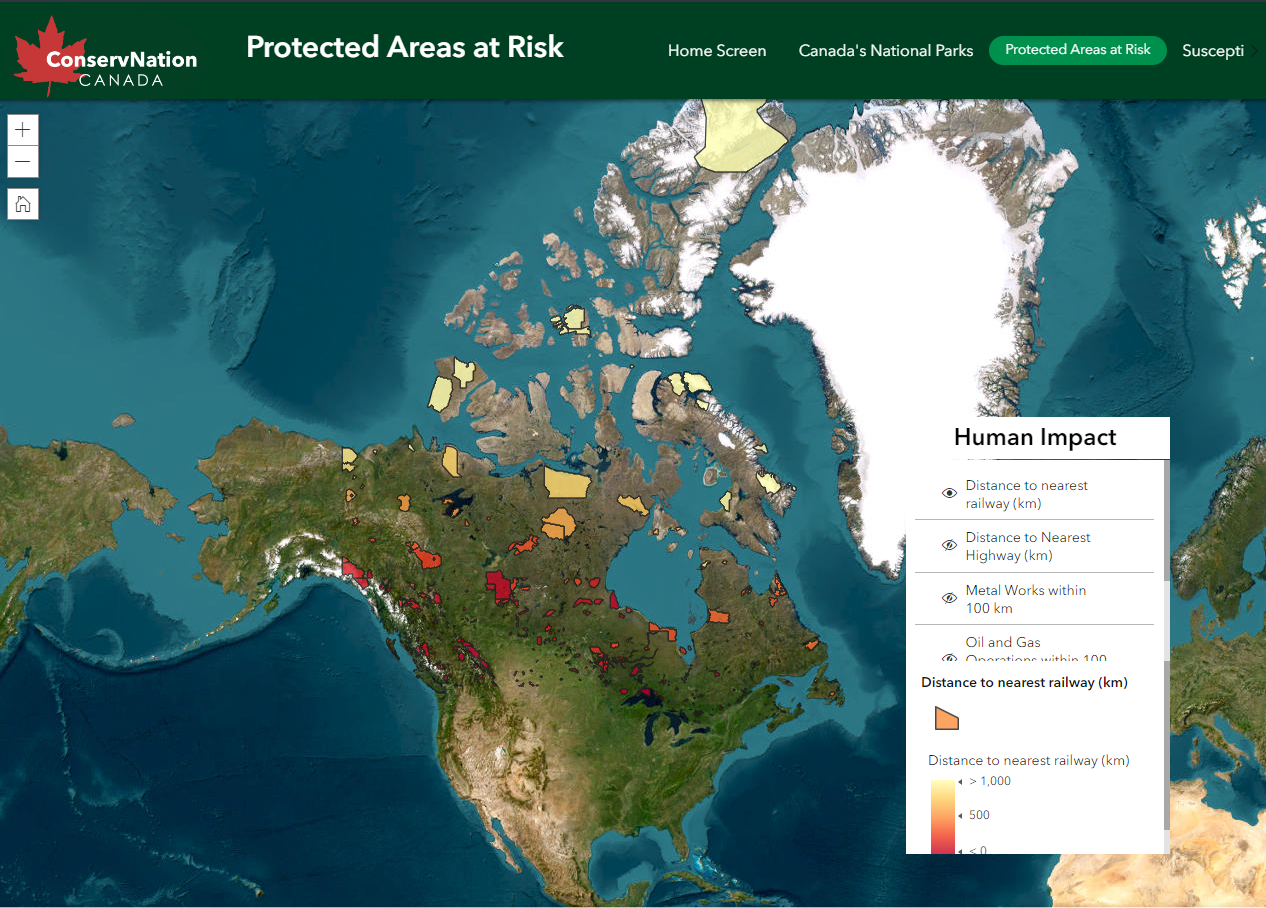
Protected Areas at Risk: This module visualizes the human impacts affecting Canada’s protected areas (National parks, Provincial parks, etc) using what is mostly a distance and buffer analysis based on protected areas’ proximity to infrastructure such as roads and railways and industrial activities such as mining. This was done rather than assessing within protected area polygons because by definition they should be free of such impacts within their bounds. The user may toggle which variable is displayed, where the lighter colours indicate less human impact and darker reds emphasize protected areas at greater risk from these activities. In addition to individual impacts, one can view the Cumulative Human Footprint drawing from a published paper from Hirsh-Pearson et al (2022) on anthropogenic pressures across Canada and its associated raster dataset.
Susceptibility Modelling: This module was initially conceptualized as a classic multicriteria decision analysis (MCDA) which is typically conducted in ArcGIS Pro using raster data format criteria layers and the Weighted Overlay or Raster Calculator to combine them. The intent, however was to allow users of the app to tailor this analysis to their needs. That is to weigh criteria for the susceptibility of Canada’s ecosystems to human and climate impacts, respectively, or exclude some entirely if they so choose. The Suitability Modeler in Experience Builder was the target, but concerns about the size of hosted rasters had us shift to a vector-based, but still gridded version. With this proving difficult to implement natively in the Experience Builder, it required yet another change of plans.
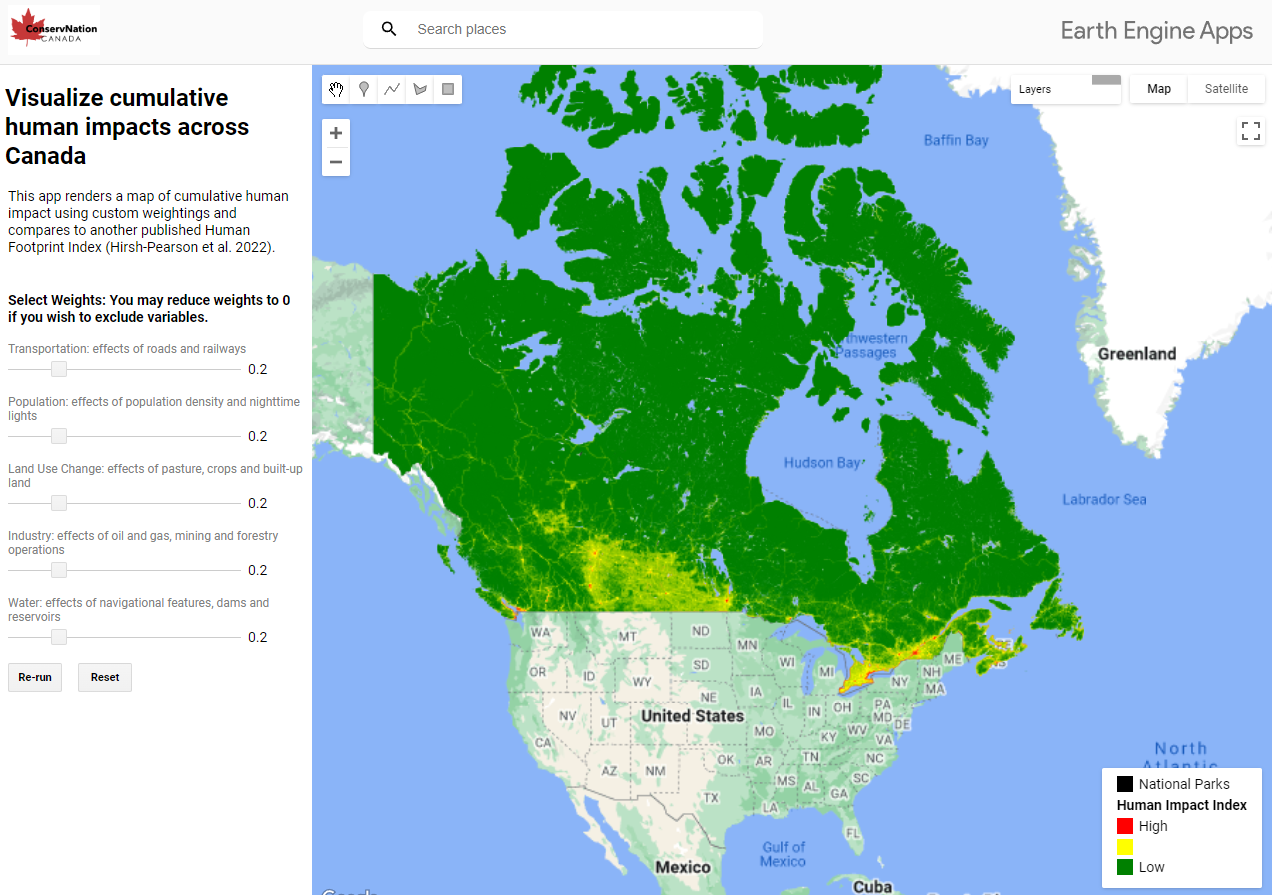
Since I was familiar with the Google Earth Engine platform and the functions needed to conduct a comparable analysis, I pivoted to coding this functionality into a Google Earth Engine App that could be accessed from our main ConservNation App. Google Earth Engine leverages a cloud based computing and storage system to facilitate geospatial analyses at greater scale than is typically practical with personal computers, with native access to common satellite data repositories such as Landsat and Sentinel. We had already prepared the criteria rasters for use in a suitability model, so what needed to be done was upload them to Google Drive storage that could be drawn upon, and convert the coded functions into an interactive App rather than the Javascript-based interface. I put together four apps in total: Cumulative Human Impact with five weighted criteria (see below), and three climate impact susceptibility apps based on different climate change modeling scenarios.
Overall, my first ECCE App Challenge was a valuable experience. Certainly stressful at times given the constraints not limited to time but the process of conceptualizing an App that an audience could find useful to translating into a GIS was immensely valuable. I greatly look forward to taking part in more App Challenges if I get the opportunity.
References
Kristen Hirsh-Pearson, Chris J. Johnson, Richard Schuster, Roger D. Wheate, and Oscar Venter. 2022. Canada’s human footprint reveals large intact areas juxtaposed against areas under immense anthropogenic pressure. FACETS. 7(): 398-419. https://doi.org/10.1139/facets-2021-0063