
Using Survey123 and Portal for ArcGIS to manage a large team related to COVID-19 economic recovery research
The COVID-19 pandemic situation has placed incredible stress on economies and social systems. The food retail and hospitality industry has been particularly hard hit from restrictions on indoor dining and shifts in consumer behaviour. The pandemic will have wide ranging impacts on this key sector of the economy and society for years. Food-based businesses are one of the largest employers in Canada, provide basic goods and services, and contribute immensely to the cultural capital of communities. There is a clear need for research that focuses on supporting the recovery of this vital industry.
The Challenge
The Food Retail Environment Study for Health and Economic Resiliency (FRESHER) project is tracking the impacts of COVID-19 on restaurants, fast food, grocers, cafes, bars, pubs, alcohol retail, and other food-related businesses in Ontario. The project is led by the Human Environments Analysis Lab (HEAL) at Western University, with support from colleagues at the University of Guelph, Wilfrid Laurier University, and University of Waterloo. The information gathered from the FRESHER project will be used to inform policymakers and business leaders to (re)develop programs, policies, and strategies that will aid in the recovery of this industry. The project consists of three data collection activities:
- Mapping retailers to track their operating conditions
- Surveying employees and employers about impacts
- Interviewing owners, employees, and associated professionals about their experiences
The first data collection activity has required the use of many Esri products to gather, organize, and analyze the necessary spatial information. The HEAL at Western University is privileged to have access to an ArcGIS Enterprise deployment that enabled the research team to quickly roll out GIS tools early in the project.
The Solution
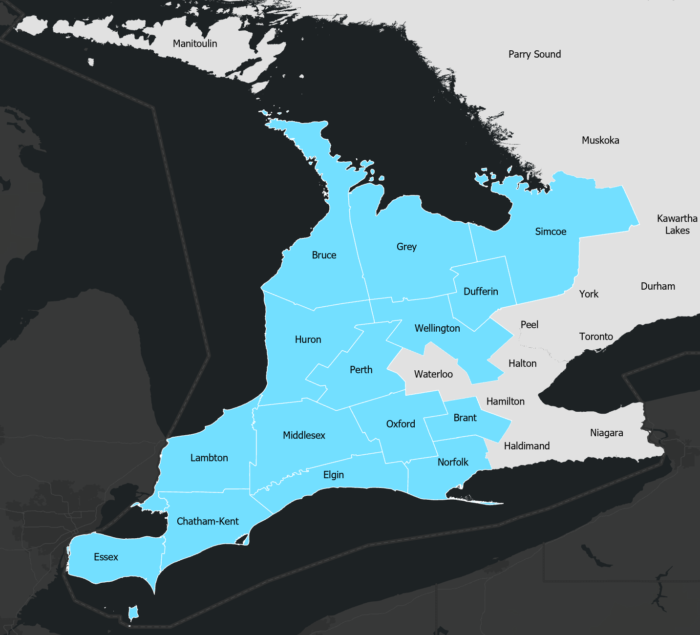
The mapping activity required gathering locations and contact information for food-based businesses in the Western Ontario Warden’s Caucus region at the outset of the project (Figure 1). Mapping activities are now being scaled to cover the entire province. Baseline information is sourced from food safety inspection databases maintained by local public health units. Data are geocoded if necessary, cleaned, and organized using ArcGIS Pro. The clean dataset is then uploaded as a feature service to the HEAL ArcGIS Enterprise portal. This feature service is used as the basis for the data collection and monitoring system to track retailers and their operating conditions.
The baseline data from the local public health units are kept up to date by the FRESHER team through web searches, phone calls, and social media interactions. This tracking procedure requires an incredible amount of labour to ensure coverage of the entire province. At peak times, the FRESHER mapping team can have over 60 undergraduate and graduate students collecting and retrieving data at the same time. The management of this many concurrent users and a dataset that covers over 30,000 features led to the decision to use advanced features of Survey123 and ArcGIS Dashboards (Figure 2).
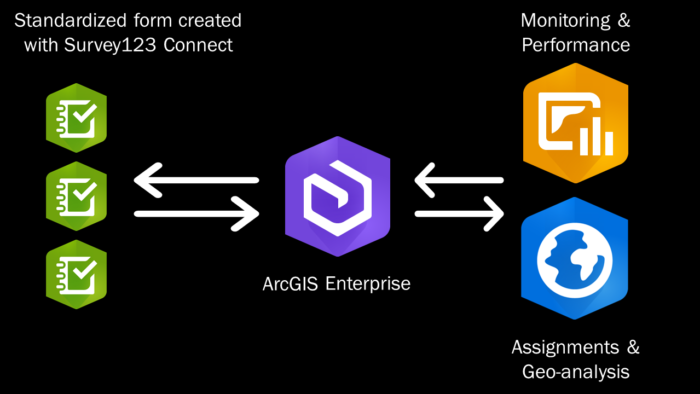
Survey123 is used to provide a standardized form for data collection. The survey form was designed using Survey123 Connect for ArcGIS to provide more control to customize the questions and the form’s functionality. For example, the prepopulate function allows for users to retrieve a retailer’s name, address, phone number, and website by entering an identification code. The validate function ensures the input identification code matches an identification code in the retailer database. In total, this customized form reduces chance of error and enables participation of novice GIS users in traditionally advanced data collection tasks.
An app created using ArcGIS Dashboards is used to provide an overview of data collection activities and a common location for users to retrieve their assigned call lists of retailers. The retailers feature layer and Survey123 feature layer were added to the dashboard to provide a visual cue of progress. A progress gauge was also set to calculate the number of calls completed versus the total number of retailers. The dashboard also offers a query system for users to select their name, and retrieve a list of calls to retailers that still need to be made, updated daily.
The next innovation for the ArcGIS Dashboards app is developing an automated tool or process to enable real-time updates of the retailers database based on the reports submitted to the Survey123 form. Presently, the project’s mapping leads update the retailer database manually in ArcGIS Pro by selecting all reports submitted in the past 24 hours, joining the status field from the reports layer to the retailer layer, selecting all retailers without a null status field, and finally running a field calculation. Instead of this manual update process, a custom tool or web app built within the ArcGIS ecosystem would be better.
Moving forward, the FRESHER project will continue to track the operating conditions of businesses across the province. To learn more about the project’s mapping activities see this StoryMap.
To learn more about the FRESHER project’s survey and interview activities, visit https://fresher.theheal.ca