
GIS for Health: An example of the modifiable areal unit problem
Hi All. This is my first post to the Esri Canada Centres of Excellence blog – it will be a short introduction to me, and an overview of a recent project I worked on for the Middlesex-London Health Unit that exemplifies the challenges of the modifiable areal unit problem (1). I am excited to be participating in the ECCE student associate program, and sharing with you how GIScience integrates into my research, teaching, and practice.
About me
I am a first-year Master of Arts, Geography student at Western University, affiliated with Dr. Jason Gilliland’s Human Environments Analysis Laboratory. I am studying smart city applications to childhood health and wellbeing, particularly the role of geospatial technologies. Hence, my involvement in the student associate program with Esri Canada. In spring of 2018, I finished my undergraduate co-operative education degree from the University of Waterloo in planning, and environmental assessment. During my time at Waterloo, I had many coop work experiences with the Ontario Ministry of Environment and Climate Change Environmental Assessment Services Section, Region of Waterloo Planning Research and Analytics team, and the Urban Growth and Change Research Group at the university. In these roles, and in my courses at Waterloo, I have learned a lot about the capabilities of Esri products. I am excited to learn more over the coming year about other products – like Insights and Scene – that I haven’t been able to use yet in my education.
The MAUP in action
The modifiable areal unit problem encapsulates the issues of aggregating information at a geographic level (1). Postal codes, census tracts, municipalities, regions, countries are all examples of modifiable areal units. These units are used in administration of policies and programs, decision-making, and market analysis to mention a few applications. The problem is these units are both arbitrary and inherently modifiable. Lines must be drawn somewhere, and often slight variations in the boundaries result in wildly different outcomes. So what to do? Well, one approach is to base boundaries on identifiable features like rivers, mountains, train tracks, roads, etc. Another is to create heterogeneous (or homogeneous) groupings of a variable. Administrative units may attempt to have a heterogeneous representation of income within the area, while other areas may look to group by land use. Regardless, justification for boundary decisions should be clearly stated, with an assessment of the potential limitations.
This past month I was asked by the Middlesex-London Health Unit (MLHU) to advise on the creation of sampling units for the Canada Community Health Survey. The MLHU had been requested by Statistics Canada to create five areas that they could use to make sure a representative sample had been taken of London’s distinct regions. As a note, all data used in this analysis is courtesy of the City of London (2), and Statistics Canada via the CHASS Data Centre at the University of Toronto (3)
I received the following criteria from MLHU to guide the boundary definition exercise:
- The boundaries cannot cross Statistics Canada dissemination area (DA) boundaries to preserve data inter-operability
- The boundaries should closely follow existing City regional definitions, and planning district boundaries
- The units should be relatively equal in their population, while being diverse in their income
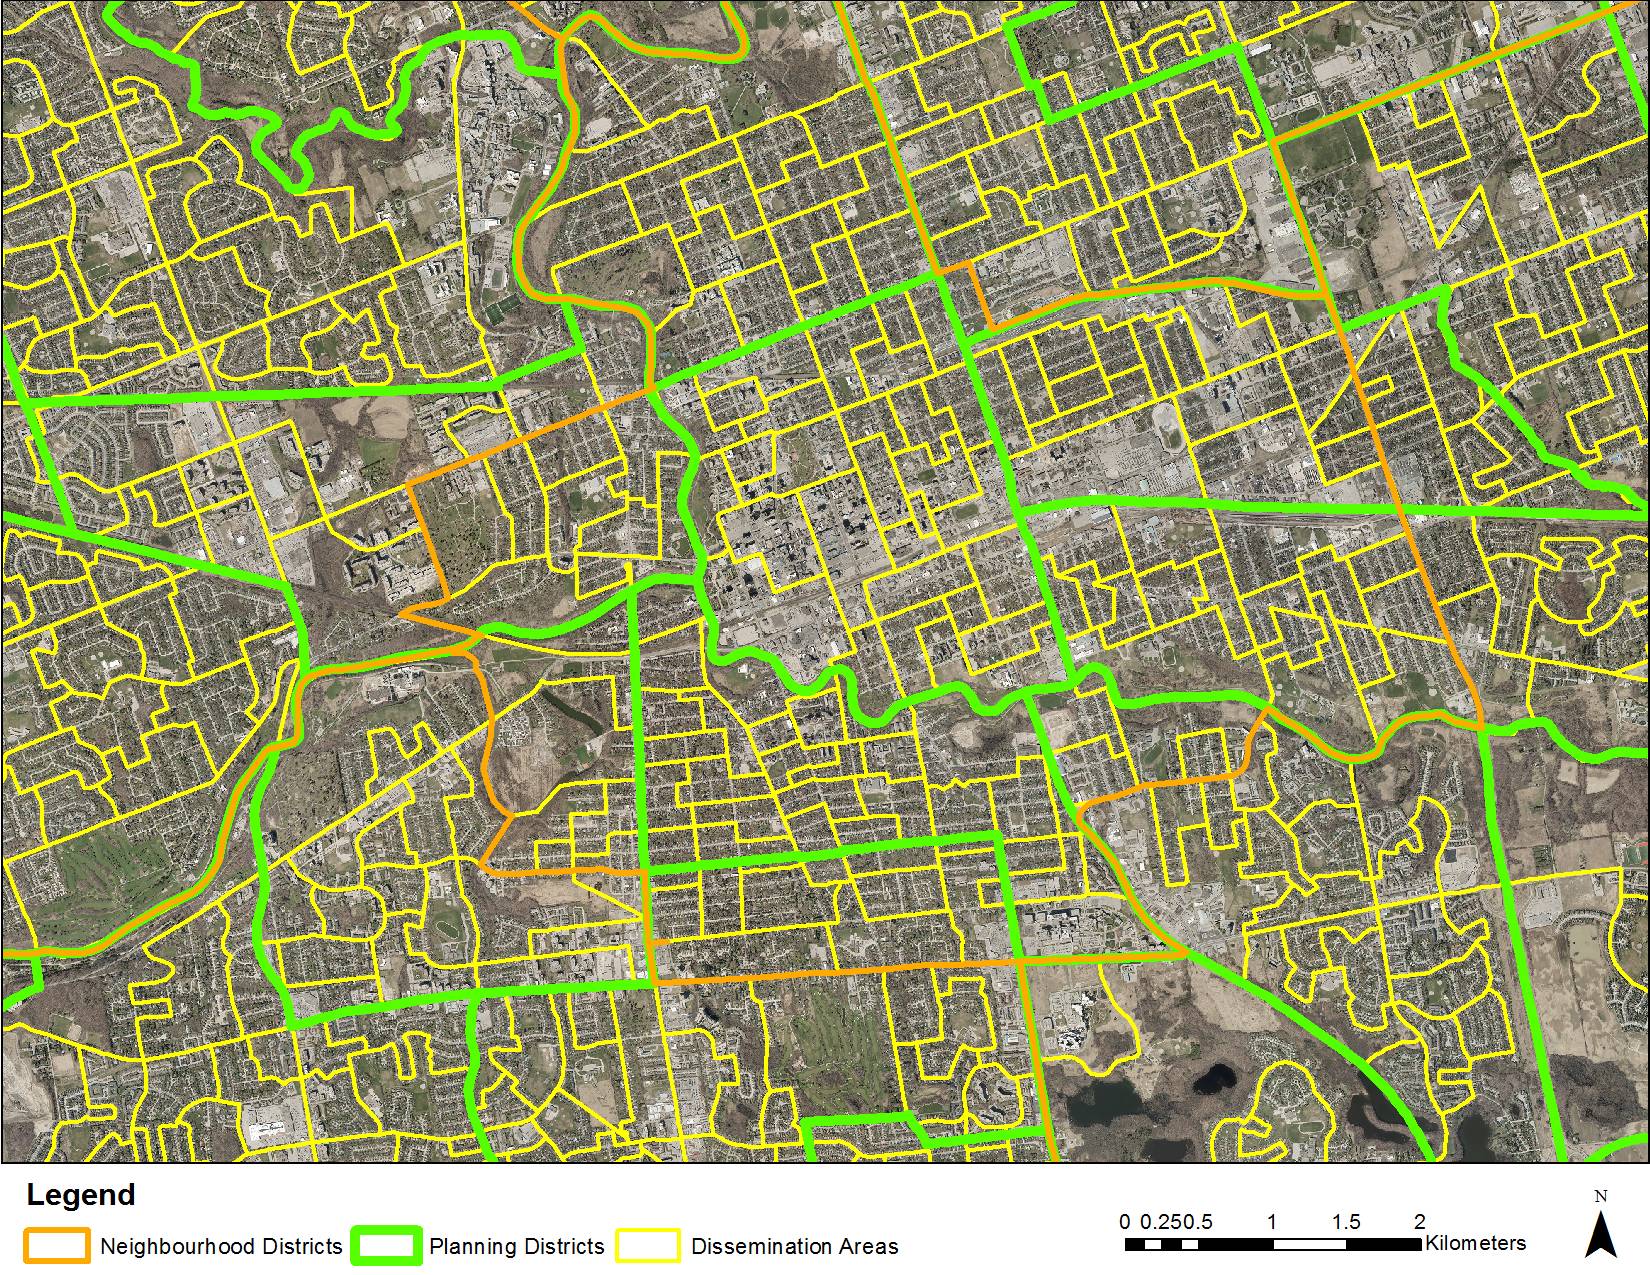
Working from these constraints, I had an interesting challenge given the mess of local and national administrative boundaries (Figure 1).
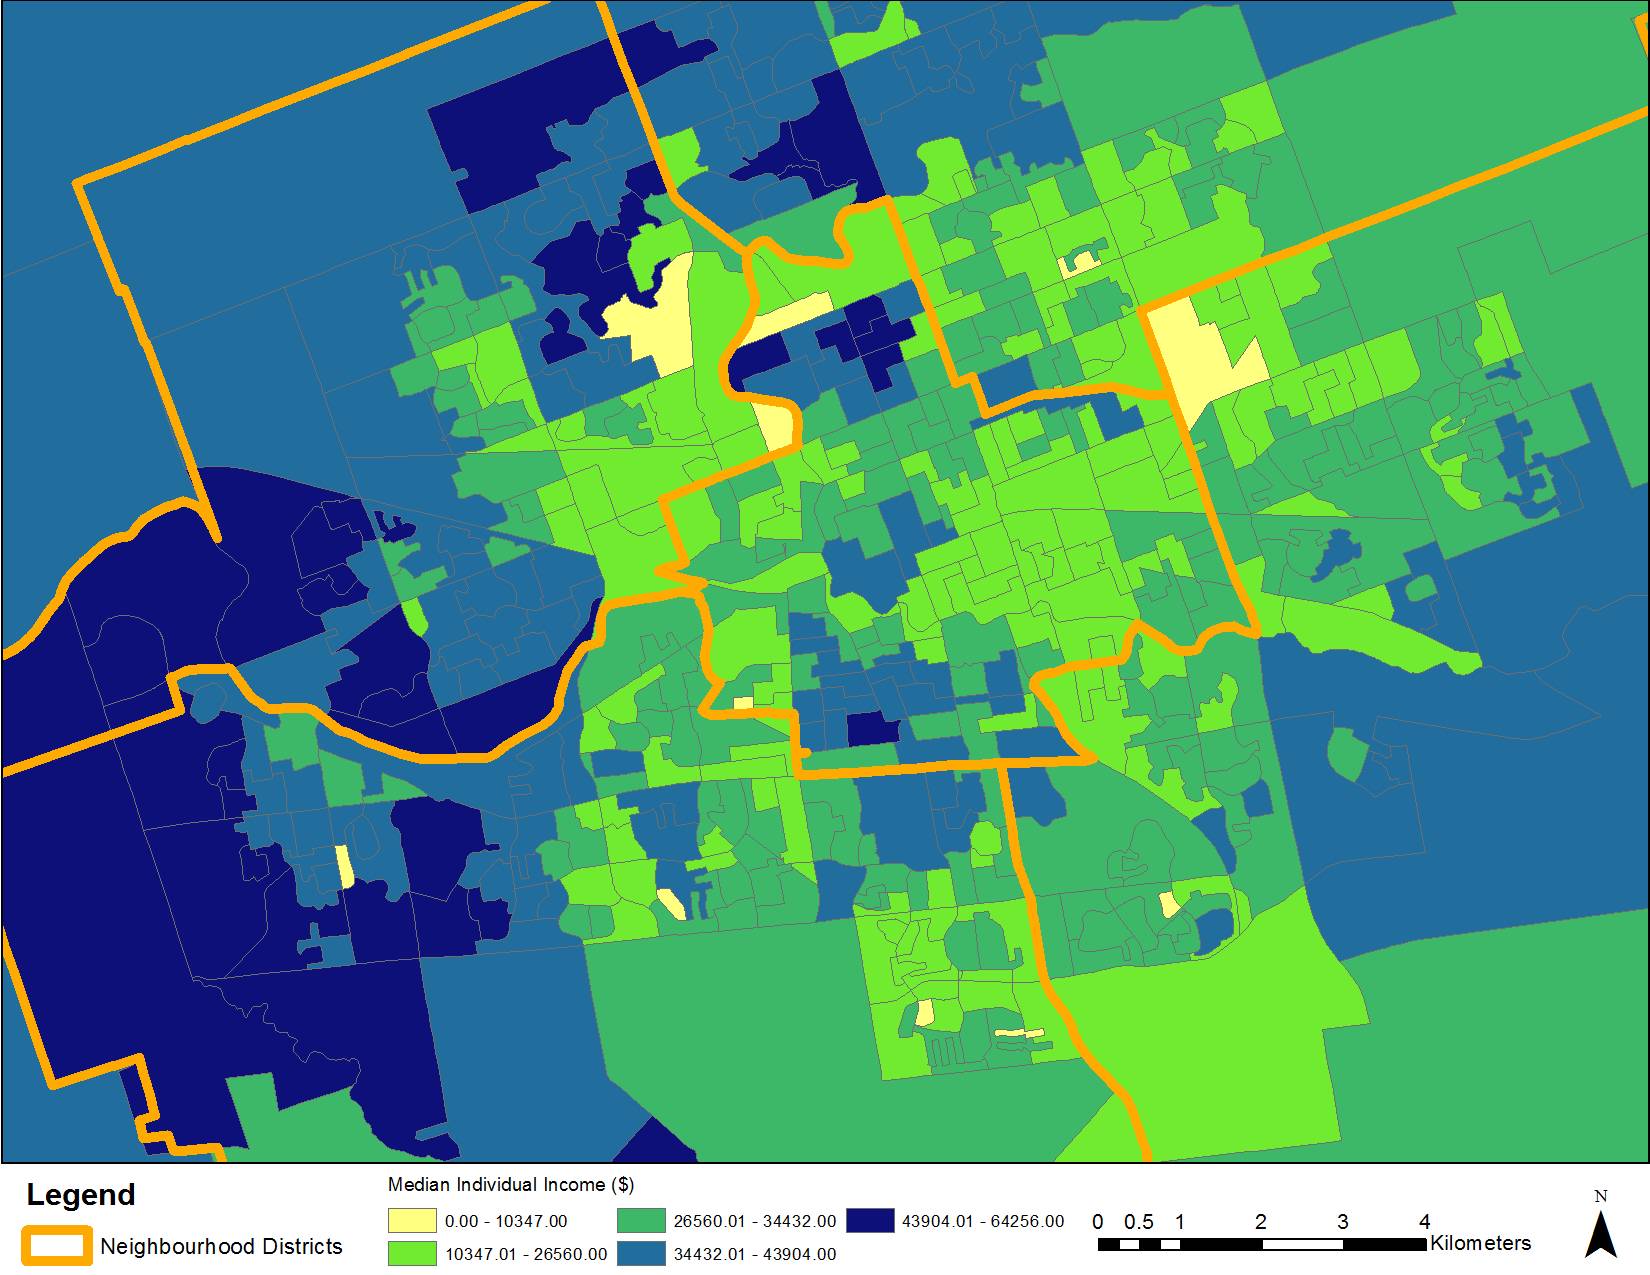
To start, I needed to first examine the distribution of income across the city’s current five neighbourhood districts (Figure 2). On visual inspection, and using the built in histogram tool it appears each area has a relatively balanced grouping of people from various incomes. The City had already checked population for me, so I knew these areas would be relatively equal in their distribution of people. The next task would be to realign the neighbourhood district boundaries – given the City and MLHU would like the new sampling boundaries to be relatively aligned with it – so they did not cross over existing DAs.
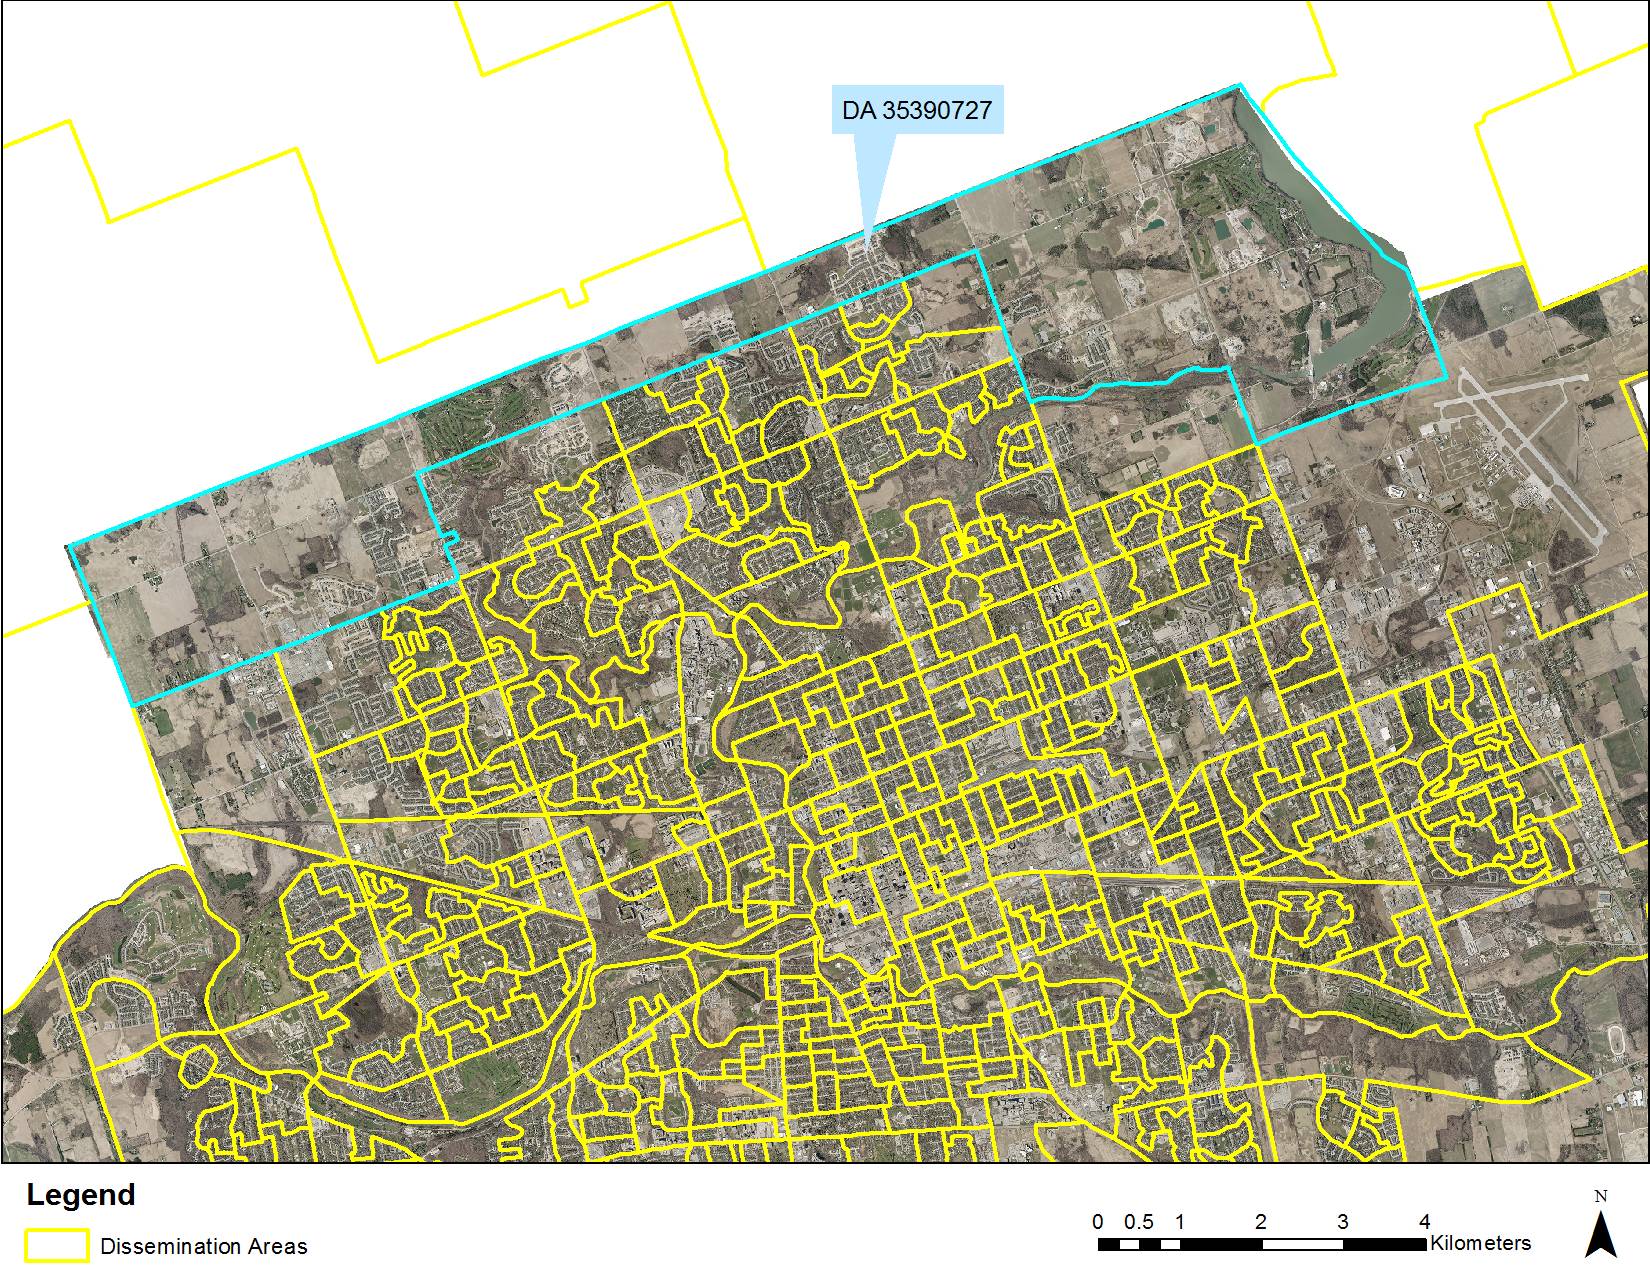
This would be the largest example of the MAUP. Many of the city’s Neighbourhood District boundaries cut halfway through some of the larger DAs. Thus, I had to figure out which new sampling unit to include the broken DAs. In many cases, it was simple boundary adjustments, but there was one DA that caused a significant headache. Lovingly referred to as the “tophat” by GISci analysts at the City, MLHU, and university – DA 35390727 runs across the entire northern boundary of the City of London (Figure 3). This DA is cut in half by the Northeast and Northwest districts, requiring often a special run from Statistics Canada to separate data at a block group level into two different units. Our team was stumped with this problem DA. Which one should it be included in? What would it do to the income and population distributions? Not to mention the sheer areal influence of moving a DA almost four times the normal size between districts.
Thinking back to the MAUP, I came up with an innovative solution. Given the sampling boundaries would not be used to represent the data to the public, and with the plan for the DA to be finally split in the next revision of Statistics Canada geography, I suggested the DA be included into both the Northwest and Northeast districts for sampling purposes. Therefore, regardless of which district the DA(s) would be included in at the time of final analysis, the sample would be representative in both districts. Therefore, we agreed on boundary changes that preserved the DA boundary criteria, but also didn’t harm the representativeness of the sample for the Canadian Community Health Survey (Figure 4). Overall, this project was an engaging way to leverage Esri tools to understand the MAUP, and collaboratively develop areal units for a public health application. I expect over the course of my Masters, I will see more of these challenges.

References
(1) Openshow S. A million or so correlation coefficients, three experiments on the modifiable areal unit problem. Statistical applications in the spatial science. 1979:127-44.
(2) City of London. Open Data. London.ca 2018. http://www.london.ca/city-hall/open-data/Pages/default.aspx (accessed November 20, 2018).
(3) University of Toronto Faculty of Arts and Sciences. CHASS Data Centre 2015. http://datacentre.chass.utoronto.ca/ (accessed November 20, 2018).