
Unveiling Parking Ticket Disparities in Mississauga, Ontario, Canada
This blog will present the findings from a project completed during a graduate course, co-authored with Leila Denise Uy.
A parking ticket is a citation for an inactive motor vehicle violating local laws, such as parking in a prohibited space or an unauthorized manner (Mucciolo et al., 2023). Usually, tickets are issued by police officers or other government traffic officials and the monetary value collected from the tickets is spent on city services and budgets (Mucciolo et al., 2023). In 2019, the City of Toronto issued about 124 million dollars in parking ticket violations but experienced a drastic decrease of 90 million dollars in 2021 (Elliott, 2023). This study found spatial patterns and predictive factors associated with the frequency of parking ticket violations by square kilometre in the dissemination areas (DA) of Mississauga, Ontario, from 2016 to 2021. We provide a better understanding of the link between parking ticket violations and land use, transportation, distance to police stations, and socio-demographic and economic variables.
Methods
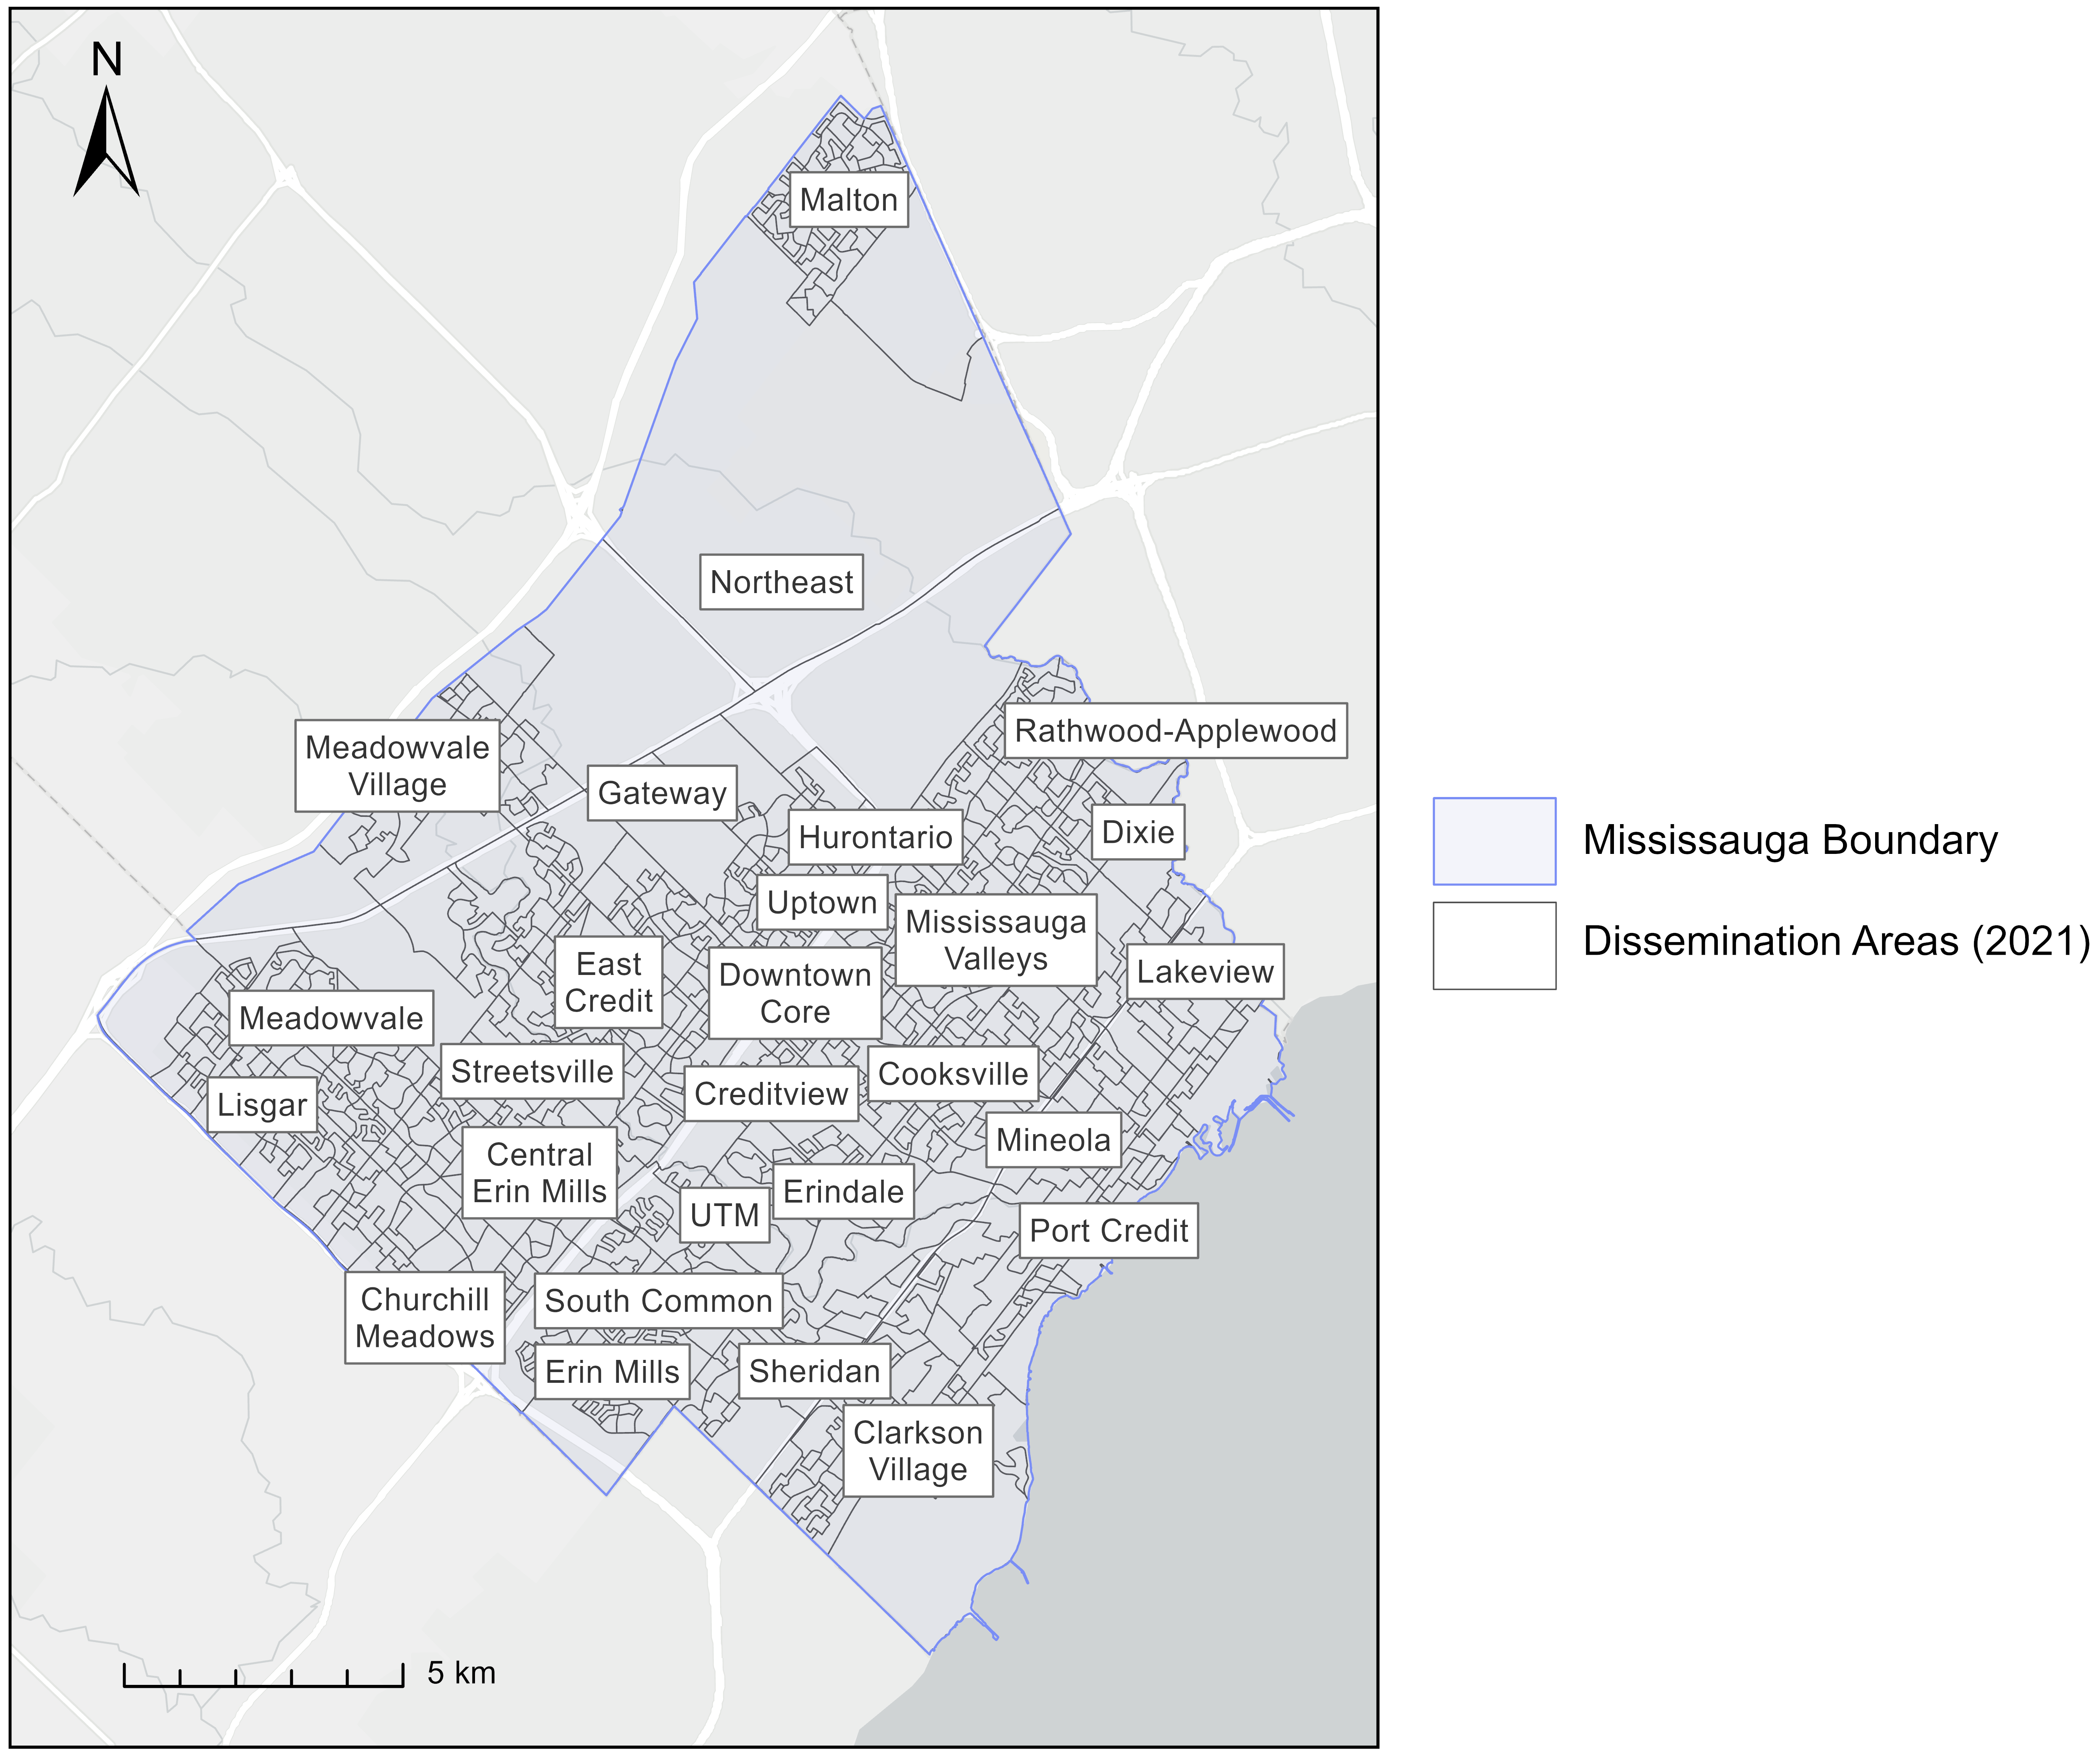
The City of Mississauga, Ontario is the 7th largest municipality in Canada (Statistics Canada, 2022). Although highly suburban, Mississauga has a downtown core, which includes the city’s largest shopping center and a public transportation hub, as displayed in Figure 1. In addition, the Lester B. Pearson Airport, the largest airport in Canada, is located in Mississauga.
Parking ticket violations are collected by the City of Mississauga’s Administrative Penalty System (APS) for each calendar year, and we obtained the data from the Mississauga Open Data Catalogue from 2016 to 2021 as comma-separated value (CSV) files (City of Mississauga, 2016; 2017; 2018; 2019; 2020; 2021). The data contain non-identifiable information relating to the penalty notices and consist of offence type, location, address of parking contravention, and the date and time of the penalty notice issued. In total, 988,459 parking ticket violations were recorded from 2016 to 2021. We geocoded the location addresses of parking ticket violations using the ArcGIS World Geocoding Service to obtain location coordinates.
Various factors were considered to understand the predictive factors associated with the frequency of parking ticket violations in Mississauga, including land use, road data, police station locations, and socio-economic and demographic data.
First, a hot spot analysis was conducted to identify statistically significant trends in parking ticket violations from 2016 to 2021, using the Space Time Cube and Emerging Hot Spot Analysis tools in ArcGIS Pro. We created an emerging hot spot analysis map with a fixed distance spatial relationship, a neighbourhood time step of 11 months and a default neighbourhood distance of 1.29 km. The emerging hot spot analysis results calculated statistically significant new, consecutive, intensifying, persistent, diminishing, sporadic, oscillating, and historical hot and cold spots.
Second, the Getis-Ord Gi* statistic was also used to identify statistically significant hot and cold spots within Mississauga’s DAs, using the How Spot Analysis (Getis-Ord Gi*) tool in ArcGIS Pro. The Gi* statistic generates a z-score and corresponding p-value for each dissemination area by comparing the local average of dissemination areas to the global average of Mississauga, where z-scores greater than 1.96 indicate statistically significant hot spots (p < 0.05) and z-scores lower than –1.96 indicate statistically significant cold spots (p < 0.05). We created six yearly (2016 to 2021) and four seasonal (winter, spring, summer, fall) Getis-Ord Gi* resulting maps using the number of parking ticket violations per square kilometre of each dissemination area with a queen’s case (edges corners) contiguity spatial relationship.
Lastly, we developed two logistic regression models to understand the relationship
between the frequency of parking ticket violations and land use types, road data, distance to police station locations, and socio-demographic and economic factors in Mississauga’s DAs. The two logistic regression models used the 2016 and 2021 p-values from the Getis-Ord Gi* statistical analysis as a binary outcome. If the p-value was statistically significant (p ≤ 0.05), we associated it with a “1”, and if the p-value was not statistically significant (p > 0.05), we associated it with a “0”. Due to our Getis-Ord Gi* statistic results not experiencing cold spots, we can investigate our results using logistic regression. Next, we found the mean value of land use type proportions, road length, distance to police stations, and socio-demographic and economic proportions to determine the high and low DAs. The independent variables are denoted as above or equal to the mean (1) or below (0). We followed a manual stepwise regression approach by including each independent variable. The logistic regressions were conducted in R.
Results & Discussion
This study investigated the total number of parking ticket violations in Mississauga from 2016 to 2021, with a total of 983,064 parking ticket violations after removing violations with missing data. The frequency of parking ticket violations in Mississauga by year, season, month, hour of the day, and day of the week from 2016 to 2021 are presented in Figure 2.
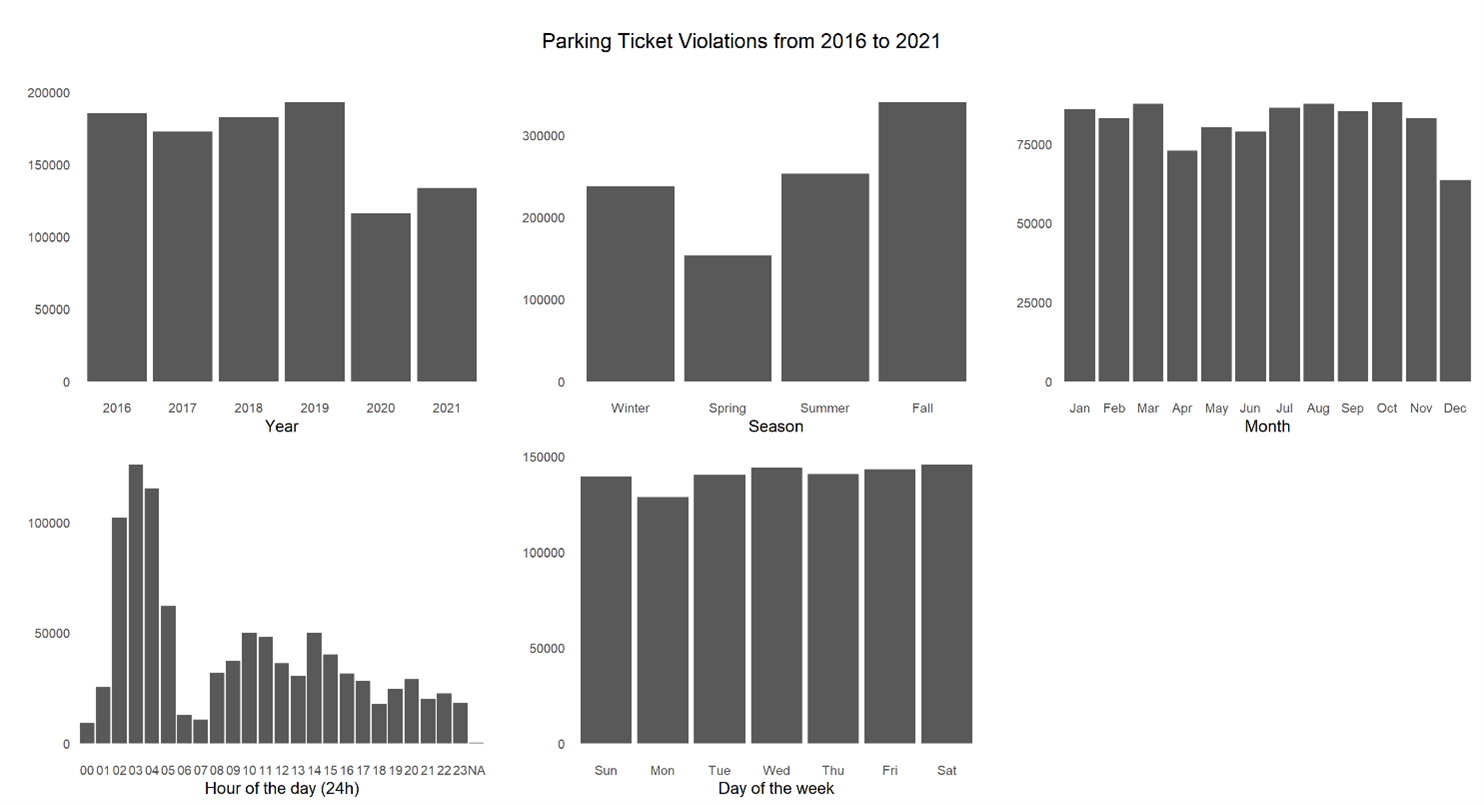
From 2016 to 2021, the top three parking ticket violation addresses include 3359 Mississauga Rd (University of Toronto Mississauga) (n = 40,762; 4.15%), 100 City Centre Drive (Square One Shopping Centre) (n = 12,570; 1.28%), and 1180 Lakeshore Road West (Jack Darling Memorial Park) (n = 8,901; 0.91%). The top three parking ticket violation descriptions include parking a vehicle on private property without owner’s consent (n = 382,979; 39.96%), parking a vehicle on a highway between 2:00 AM and 6:00 AM during a prohibited period (n = 164,308; 16.71%), and parking a vehicle in a parking space governed by a parking machine without clear displayed receipt (n = 98,695; 10.04%).
We conducted an emerging hot spot analysis of the parking ticket violations in Mississauga from 2016 to 2021. The results show areas with statistically significant hot spots in the Downtown Core, Cooksville, Creditview, Malton, Port Credit, UTM, South Common, Meadowvale, Churchill Meadows, Clarkson Village, and Dixie neighbourhoods. The results also show areas with statistically significant cold spots around the Airport and in the Churchill Meadows, Sheridan, Mineola, and Lakeview neighbourhoods. Check out this link to understand the pattern name definitions. Figure 3 displays the emerging hot spot analysis of parking ticket violations in Mississauga from 2016 to 2021.
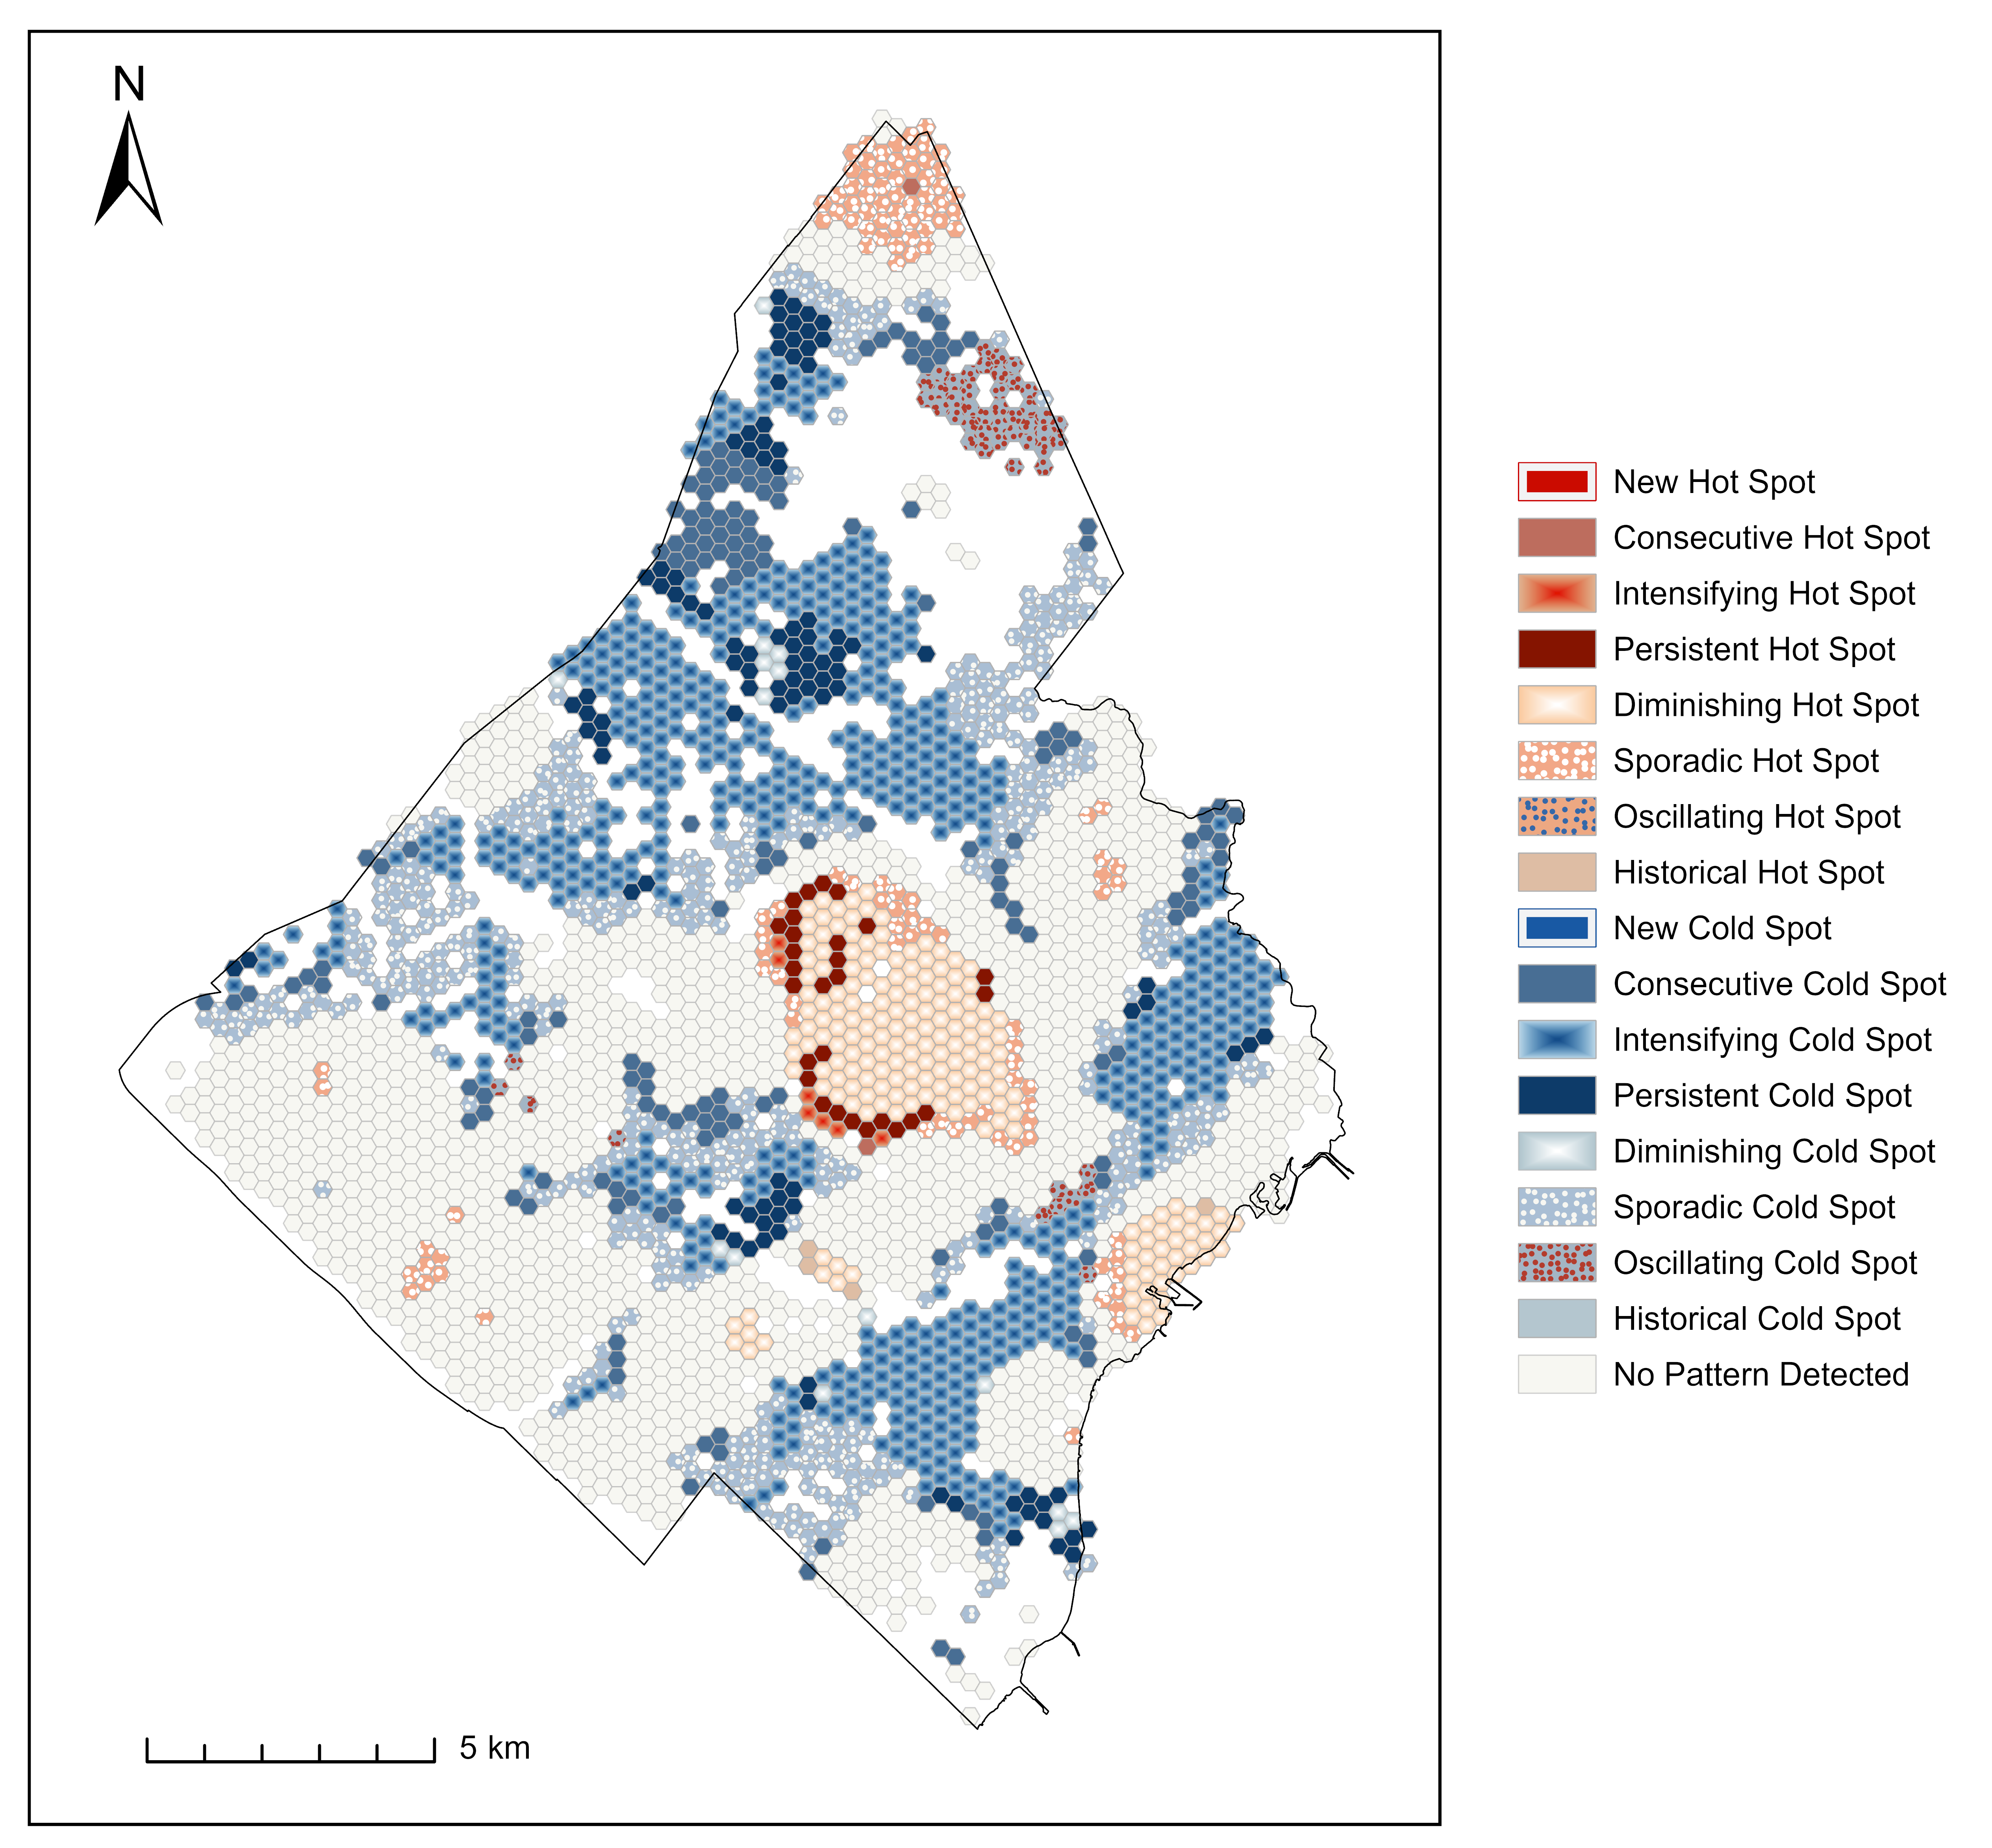
Mississauga mainly has diminishing and sporadic hot spots and intensifying cold spots of parking ticket violations from 2016 to 2021. These patterns indicate decreases in the intensity of parking ticket violation clustering and increases in parking ticket violation low counts throughout the municipality. This trend is due to the drastic decrease in annual parking tickets from its peak in 2019 (n = 192,851) to its lowest (n = 115,857) in 2020, with parking ticket numbers not fully recovering to pre-COVID values in 2021.
Next, we created yearly Getis-Ord Gi* maps to display statistically significant (p < 0.05) and
non-statistically significant hot and cold spots using the number of parking ticket violations per square kilometre from 2016 to 2021, shown in Figure 4. We also created seasonal Getis-Ord Gi* maps, shown in Figure 5. All results only displayed statistically significant hot spots, and hot spots were consistently found in the Downtown Core, Cooksville, and Port Credit neighbourhoods.
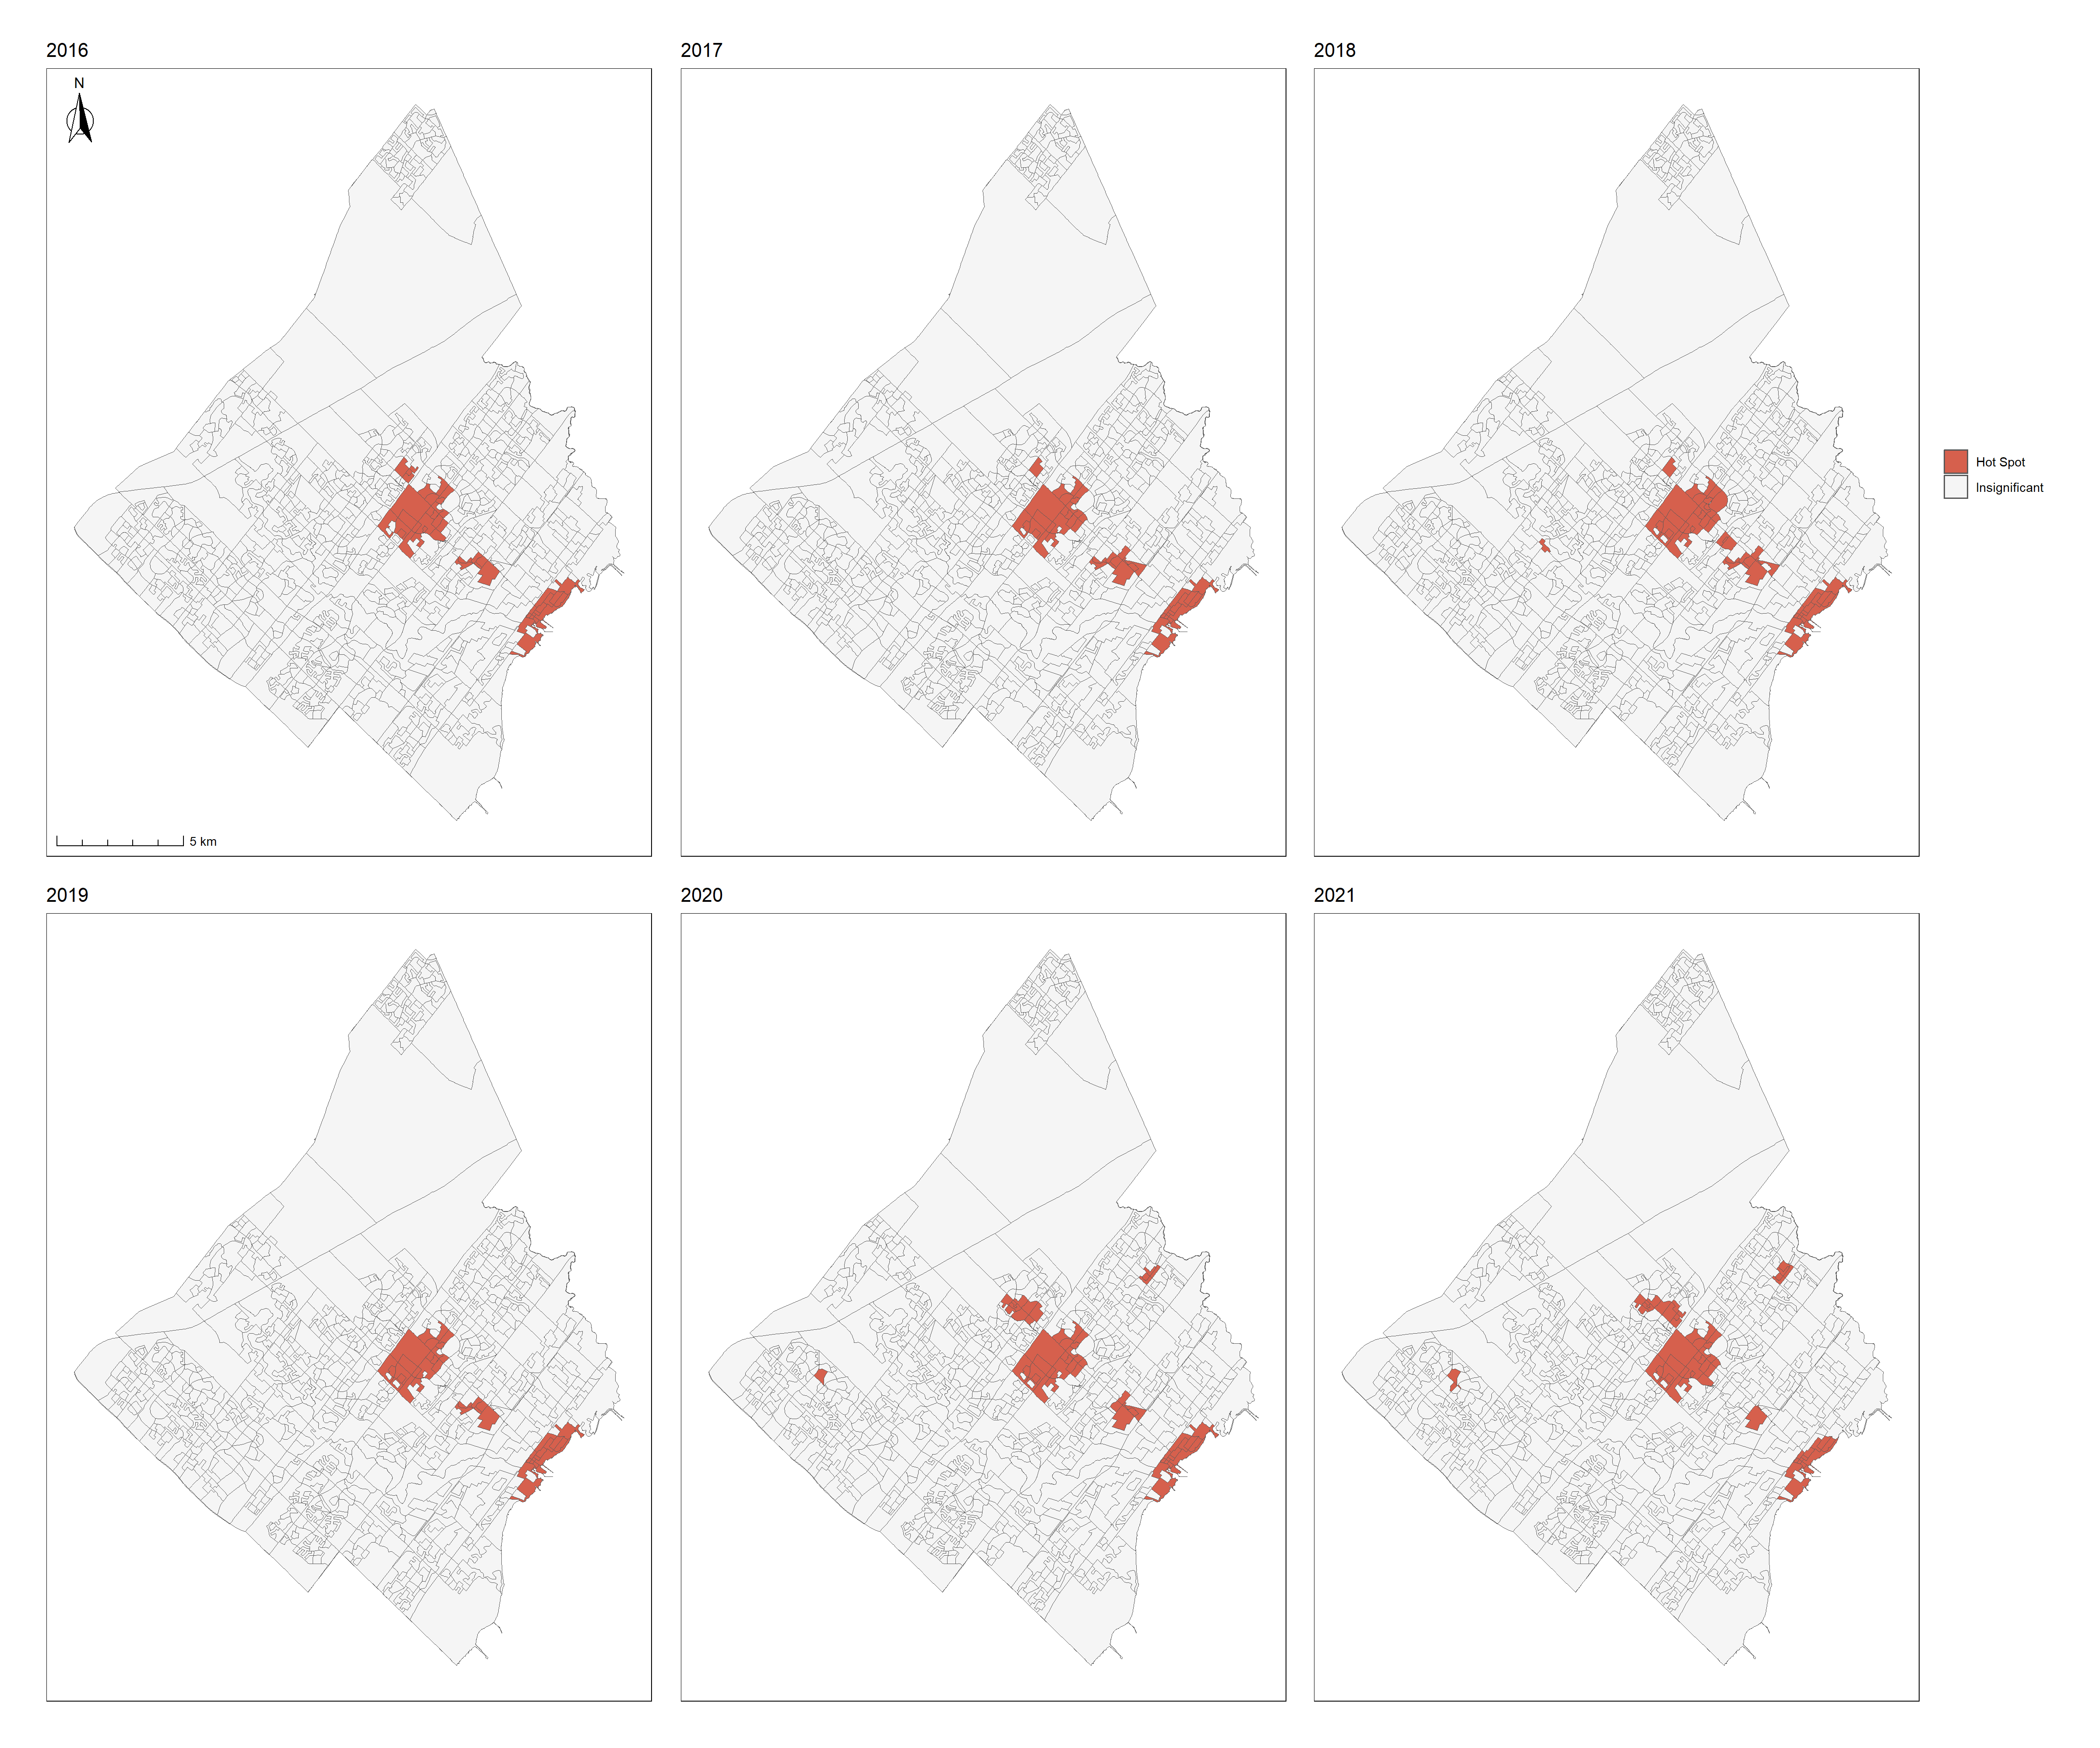
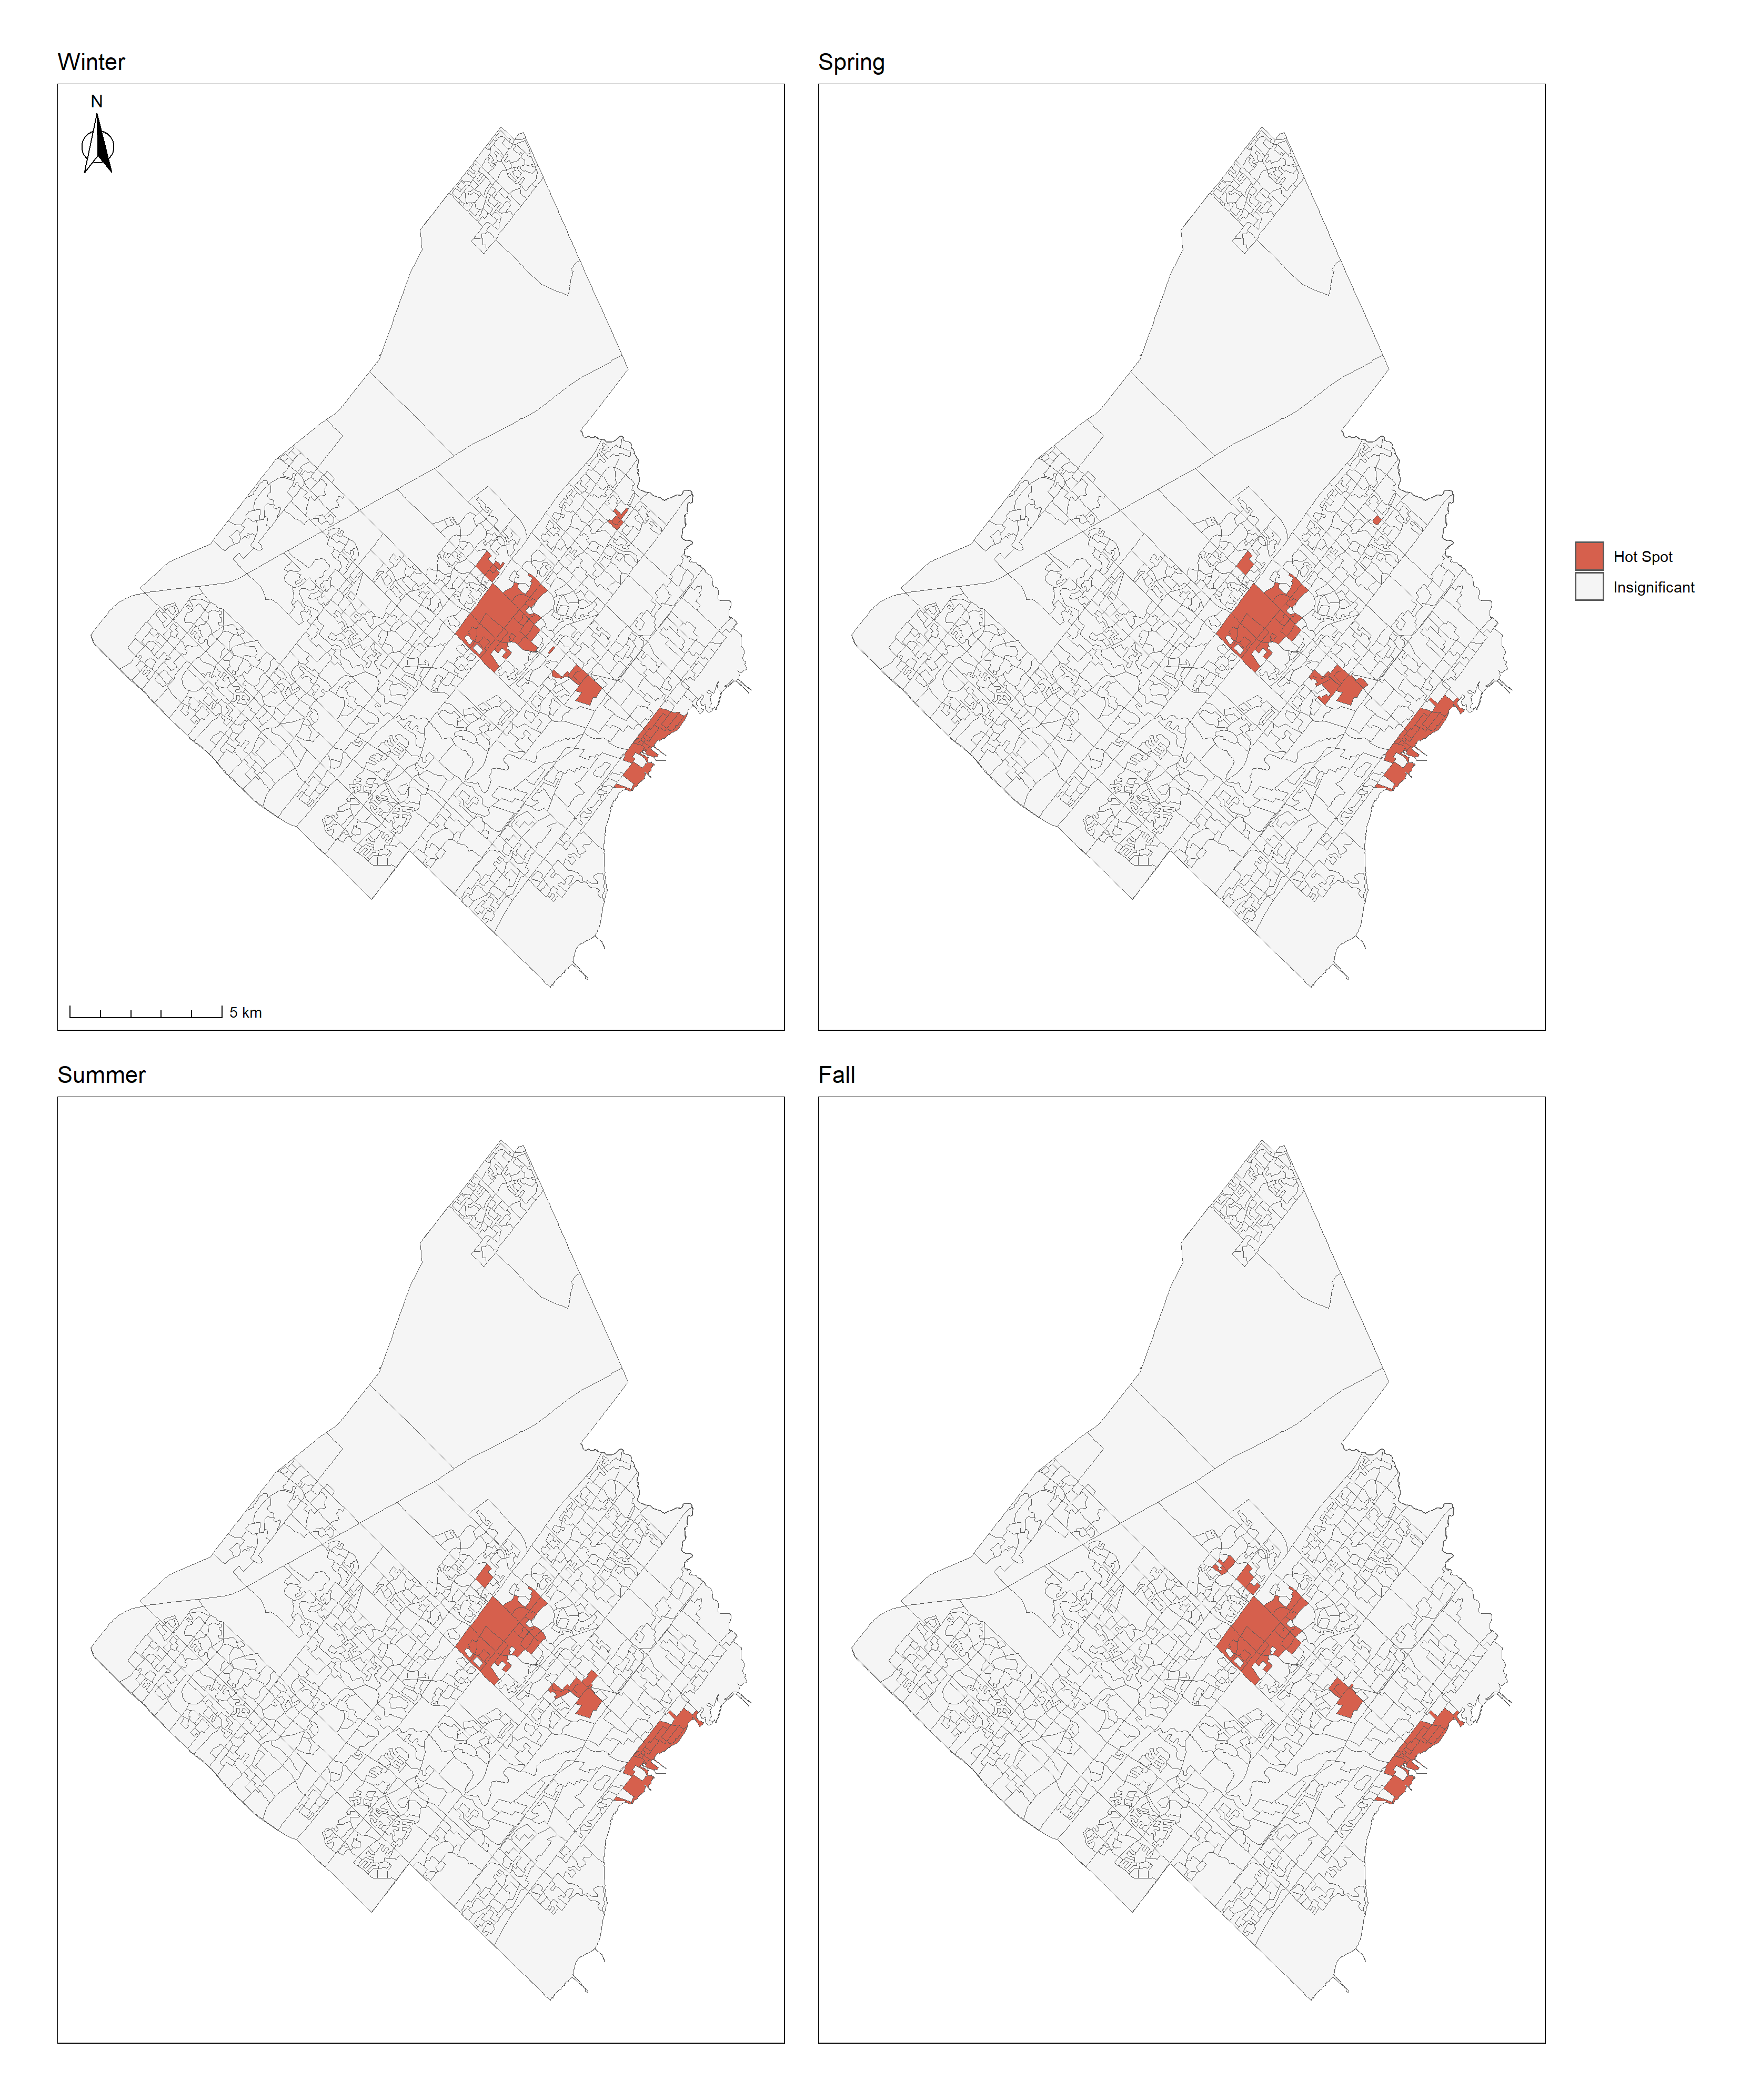
We saw results similar to those of the emerging hot spot analysis. Due to COVID-19, hot spots decreased in the Downtown Core while increasing in residential neighbourhoods. Many Ontario workers lost their jobs due to COVID-19 or adopted a work-from-home ethic, reducing the number of workers required to commute (Lemieux, 2020). Our seasonal results show decreased hot spots in the Port Credit neighbourhood, a waterfront community, while increased hot spots in residential areas during the winter.
Lastly, we conducted two logistic regression models to examine the spatial relationship between parking ticket violations and land use, and socio-demographic and economic factors in Mississauga’s DAs in 2016 and 2021. Both models were statistically significant (p < 0.001). Table 1 and Figure 6 display the model results in odds ratios.
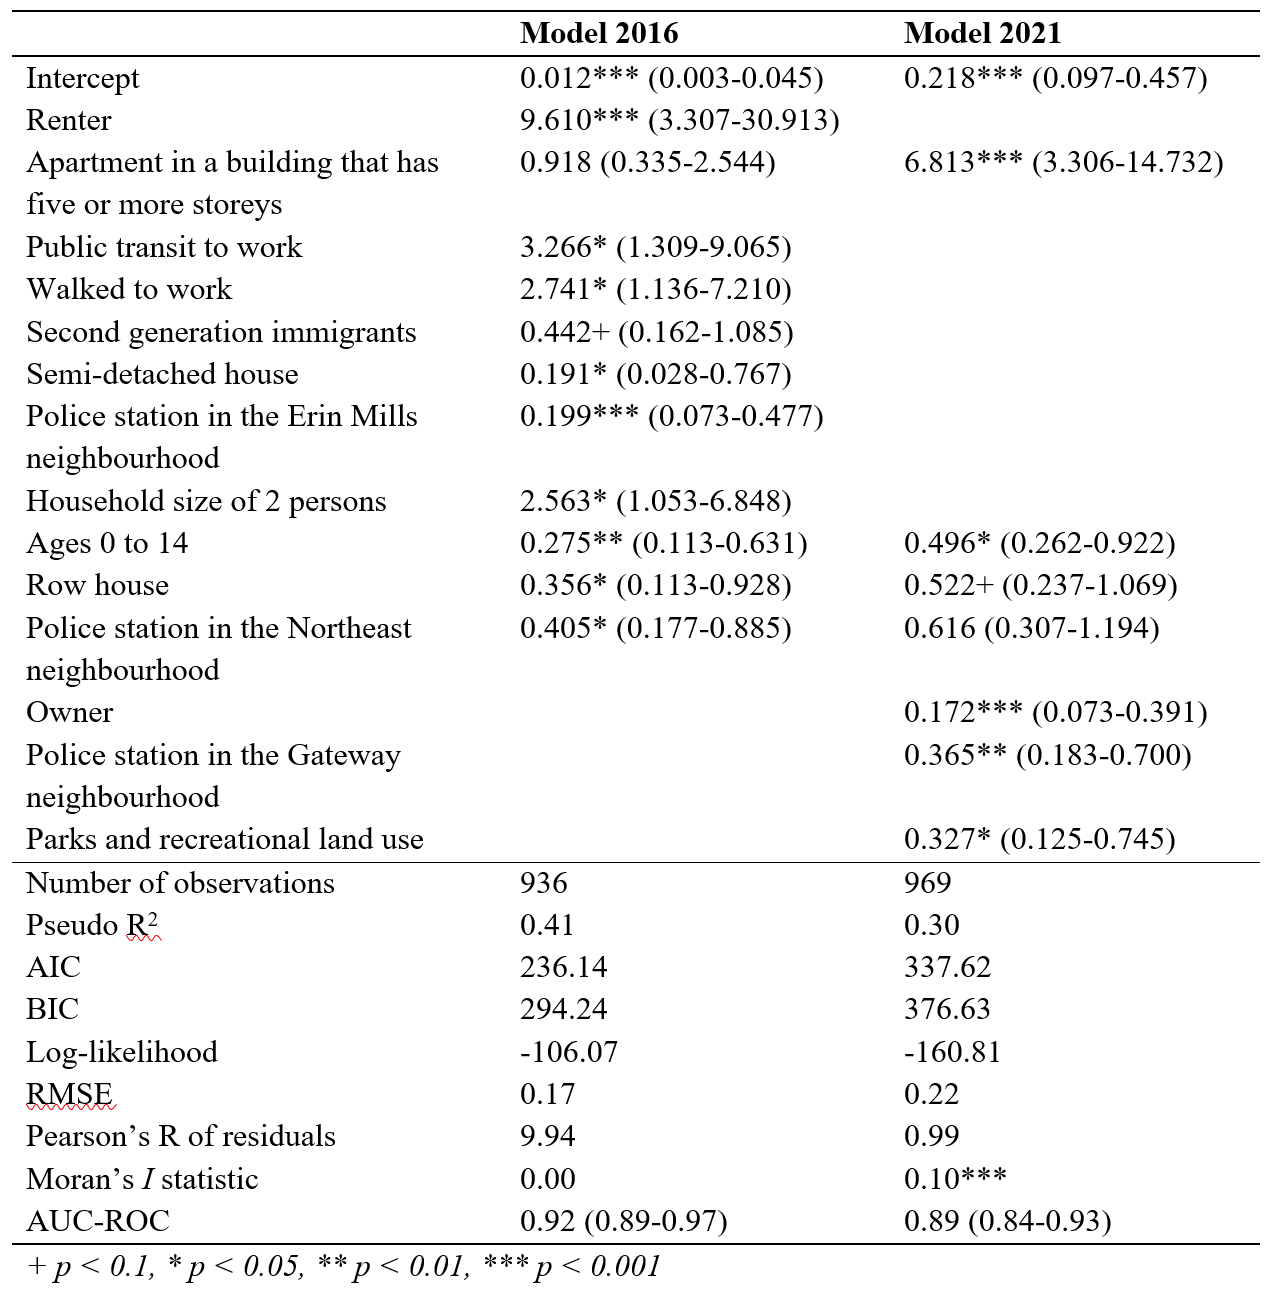
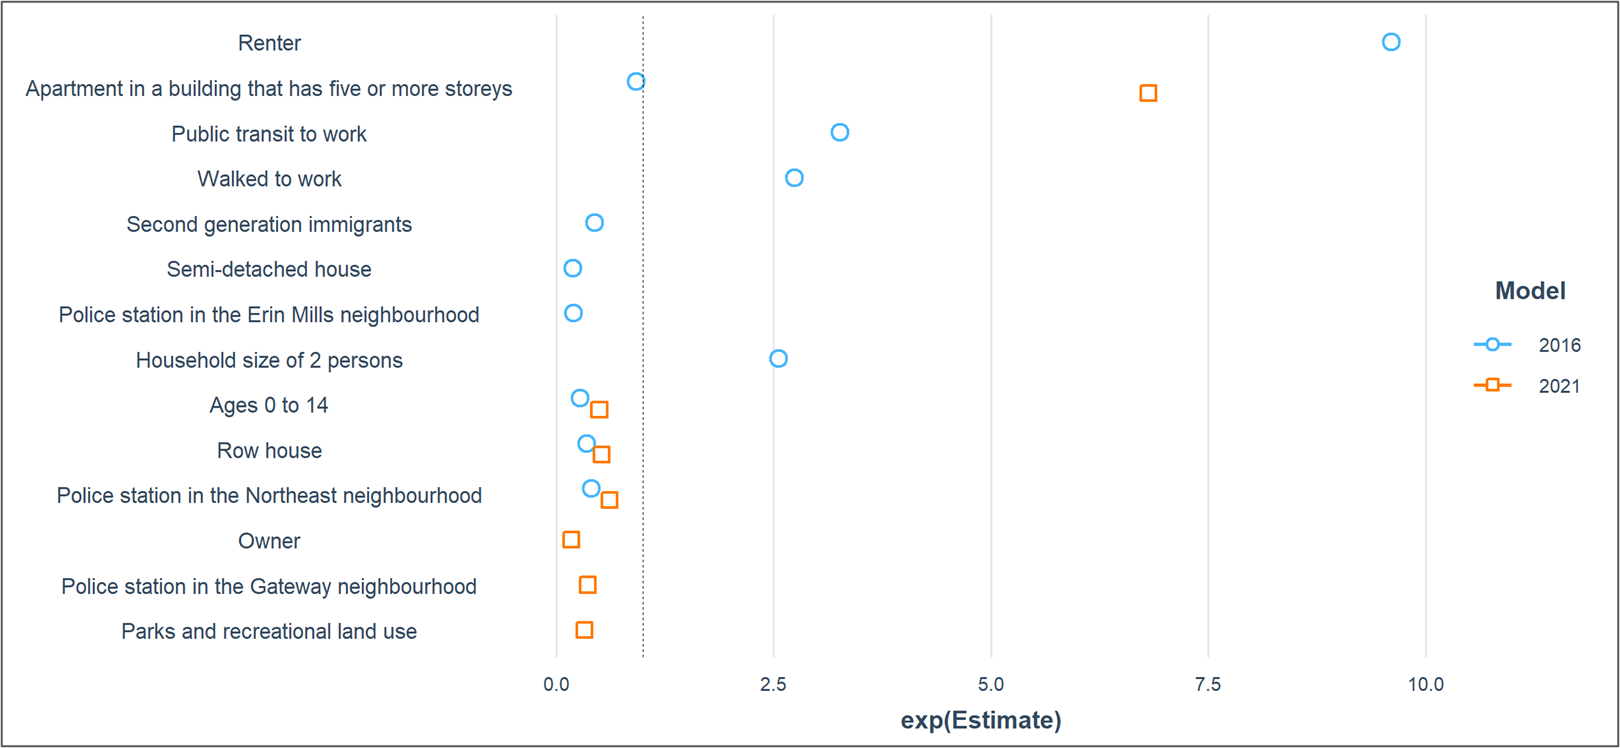
Our findings suggest that statistically significant parking ticket violation hot spots exist in
Mississauga in 2016 and 2021. We found that if a DA with a higher proportion of ages 0 to 14, row houses, and are further from the police station in the Northeast neighbourhood, there are fewer odds of a parking ticket violation. However, those odds are only statistically significant (p < 0.05) in the 2016 model and the ages 0 to 14 variable in the 2021 model. In addition, if a DA has a higher proportion of apartments with five or more storeys, there are higher odds of a parking ticket in the 2016 model but lower odds in the 2021 model. From 2016 to 2021, the proportion of apartments with five or more storeys increased from 12% to 13%, possibly increasing the odds. We found that land use, distance to police stations, and socio-economic and demographic factors are associated with parking ticket violation hot spots in Mississauga. However, we did not consider parking laws, nor did we have access to the cost amounts of the parking ticket fines or fees in different areas of the city (e.g. parking lots versus street parking).
Thank you!
— Scarlett Rakowska
References
City of Mississauga. (2016). Parking Tickets 2016. Mississauga, Ontario, Canada. Retrieved from https://data.mississauga.ca/datasets/parking-tickets-2016/explore
City of Mississauga. (2017). Parking Tickets 2017. Mississauga, Ontario, Canada. Retrieved from https://data.mississauga.ca/datasets/parking-tickets-2017/explore
City of Mississauga. (2018). Parking Tickets 2018. Mississauga, Ontario, Canada. Retrieved from https://data.mississauga.ca/datasets/parking-tickets-2018/explore
City of Mississauga. (2019). Parking Tickets 2019. Mississauga, Ontario, Canada. Retrieved from https://data.mississauga.ca/datasets/parking-ticket-2019/explore
City of Mississauga. (2020). Parking Tickets 2020. Mississauga, Ontario, Canada. Retrieved from https://data.mississauga.ca/datasets/parking-ticket-2020/explore
City of Mississauga. (2021). Parking Tickets 2021. Mississauga, Ontario, Canada. Retrieved from https://data.mississauga.ca/datasets/parking-ticket-2021/explore
Elliott, M. (2023). The number of parking tickets has plunged in cash-strapped Toronto. Why the lax enforcement? Toronto Star.
Lemieux, T., Milligan, K., Schirle, T., & Skuterud, M. (2020). Initial impacts of the COVID-19 pandemic on the Canadian labour market. Canadian Public Policy, 46(S1), S55-S65.
Mucciolo, L., Walker, F., & Boddupalli, A. (2023). The Cost of Parking: A Preliminary Analysis of Parking Tickets Data in Austin, Minneapolis, and Portland.
Statistics Canada. (2022). Canada’s fastest growing and decreasing municipalities from 2016 to 2021. Statistics Canada.