
Exploring Cycle-Level Heat – Preparing for Analysis of Remote Sensing Microscale Urban Heat
This blog post will present my current MSc Thesis project.
As human population increases, we are seeing a trend towards more people living in cities than in rural areas (Hiemstra et al., 2017). In 1861, 16% of Canadians lived in urban regions; whereas, in 2011, 81.5% lives in urban regions (Statistics Canada, 2018). Urban areas experience higher temperatures, compared to rural areas; this is known as the Urban Heat Island (UHI) effect (Hiemstra et al., 2017). It is estimated that by the end of the century, the global average temperature will increase between 1.4 and 5.8 degrees Celsius (Patz et al., 2005). The UHI effect is a spatial phenomenon with the baseline of temperatures in rural areas and the peak is in the urban core (Hiemstra et al., 2017). The intensity depends on factors, such as location, size, population, urban structure, land use distribution, urban activity, and green space (Hiemstra et al., 2017). This heat is being trapped in urban regions due to urban characteristics, such as dense buildings, industrial areas, traffic, and urban activity, resulting in solar radiation and emitted thermal radiation being unable to escape (Hiemstra et al., 2017).
These extreme urban temperatures are vulnerable to human activities and the environment. Land cover change, greenhouse gas emissions, and climate change are increasing these temperatures (Patz et al., 2005). Additionally, as vegetated areas decrease due to urbanization, evaporative cooling may also decrease (Lu & Weng 2006). These extreme temperatures are linked to increased morbidity and mortality, creating a risk for many people (Curriero et al., 2002). In 2003, Europe’s average temperature was 3.5 degrees Celsius greater than normal, resulting in 22,000 to 45,000 deaths in only two weeks (Patz et al., 2005). Unfortunately, incidences of these extreme temperatures are going to rise, and will be more intense in the future (IPCC, 2007).
However, there are many mitigation strategies for heat stress and the UHI effect. Air temperature in cities can be over 10 degrees Celsius higher than their rural areas; however, this can be significantly reduced by urban green space (Hiemstra et al., 2017). Urban green infrastructure can benefit humans living in urban regions as trees, lawns, and forested areas can create “the urban forest” (Brown et al., 2015; Yoshida et al., 2015). Urban forests create shade and evapotranspiration to reduce solar radiation from (Hiemstra et al., 2017). However, even though parks and green spaces help mitigate the UHI effect, our understanding of vegetation and urban activity through a finer spatial resolution is still unclear.
I am currently working on my MSc thesis at the University of Toronto Mississauga under the supervision of Dr. Matthew Adams. The main objective of this research is to map heat exposure at a microscale in Mississauga, a city in Southern Ontario, Canada, that is undergoing rapid urbanization. This study will integrate GIS, with remote sensing, and field data. We hypothesize that a microscale urban heat island effect exists in areas devoid of vegetation compared to areas with urban greenery. We ask two questions: can remote sensing Land Surface Temperature (LST) methods be used to estimate ground-level heat exposure?; and does vegetation reduce heat exposure?
Land Surface Temperature is a remote sensing metric and an essential parameter for surface energy as it measures long-wave radiation and turbulent heat at atmospheric surfaces (Anderson et al., 2008; Brunsell & Gillies, 2003; Karnieli et al., 2010; Kustas & Anderson, 2009; Zhang et al., 2008). Land surface temperature allows for environmental studies, such as urban climate, conducted across spatial scales over various geographical areas (Arnfield, 2003; Hutengs & Vohland, 2016). Ideally, frequent satellite observations at high spatial resolutions would help to monitor these areas, however, current spaceborne thermal imagery is limited to either high spatial or high temporal resolution, which is why methods to improve land surface temperature spatial data have been explored (Atkinson, 2013; Hutengs & Vohland, 2016; Zhang et al., 2008).
My research will explore remote sensing and modelling techniques with various data predictors, such as meteorological data, to understand how vegetation can mitigate the increased temperatures. This research will create a land-use regression model, to relate land surface temperatures to ground-level temperatures using remote sensing satellite data and other variables. This approach is common in research estimating ambient air pollution, but uncommon for temperature, and may allow us to predict a fine-scale temperature estimate for urban heat islands. Our goal is to estimate and locate microscale heat, specifically as it relates to the effect of vegetation. Can we relate known information to the scale the whole city?
The ground-level observations will be collected in July/August 2022. I will strap an air temperature sensor, data logger, and bike computer on a bicycle to cycle on cycling infrastructure in Mississauga to investigate the air temperature in different regions with various types of surfaces and surrounding vegetation. We selected 7 routes in Mississauga that each span about 20 kilometres. Each route will be repeated 4 times, resulting in a total of 560 kilometres. The selected routes will collect real-time temperature at cycling level and GPS locations every 1-second. The data logger will record the air temperature, while the bike computer will record the location coordinates. This will later be combined, analyzed, and evaluated. Then, the sample of points will be collected and considered in the land-use regression model.
Last month, I performed a test run with the equipment where I biked a 20-kilometre route in Mississauga that consists of paved paths and road cycling paths.
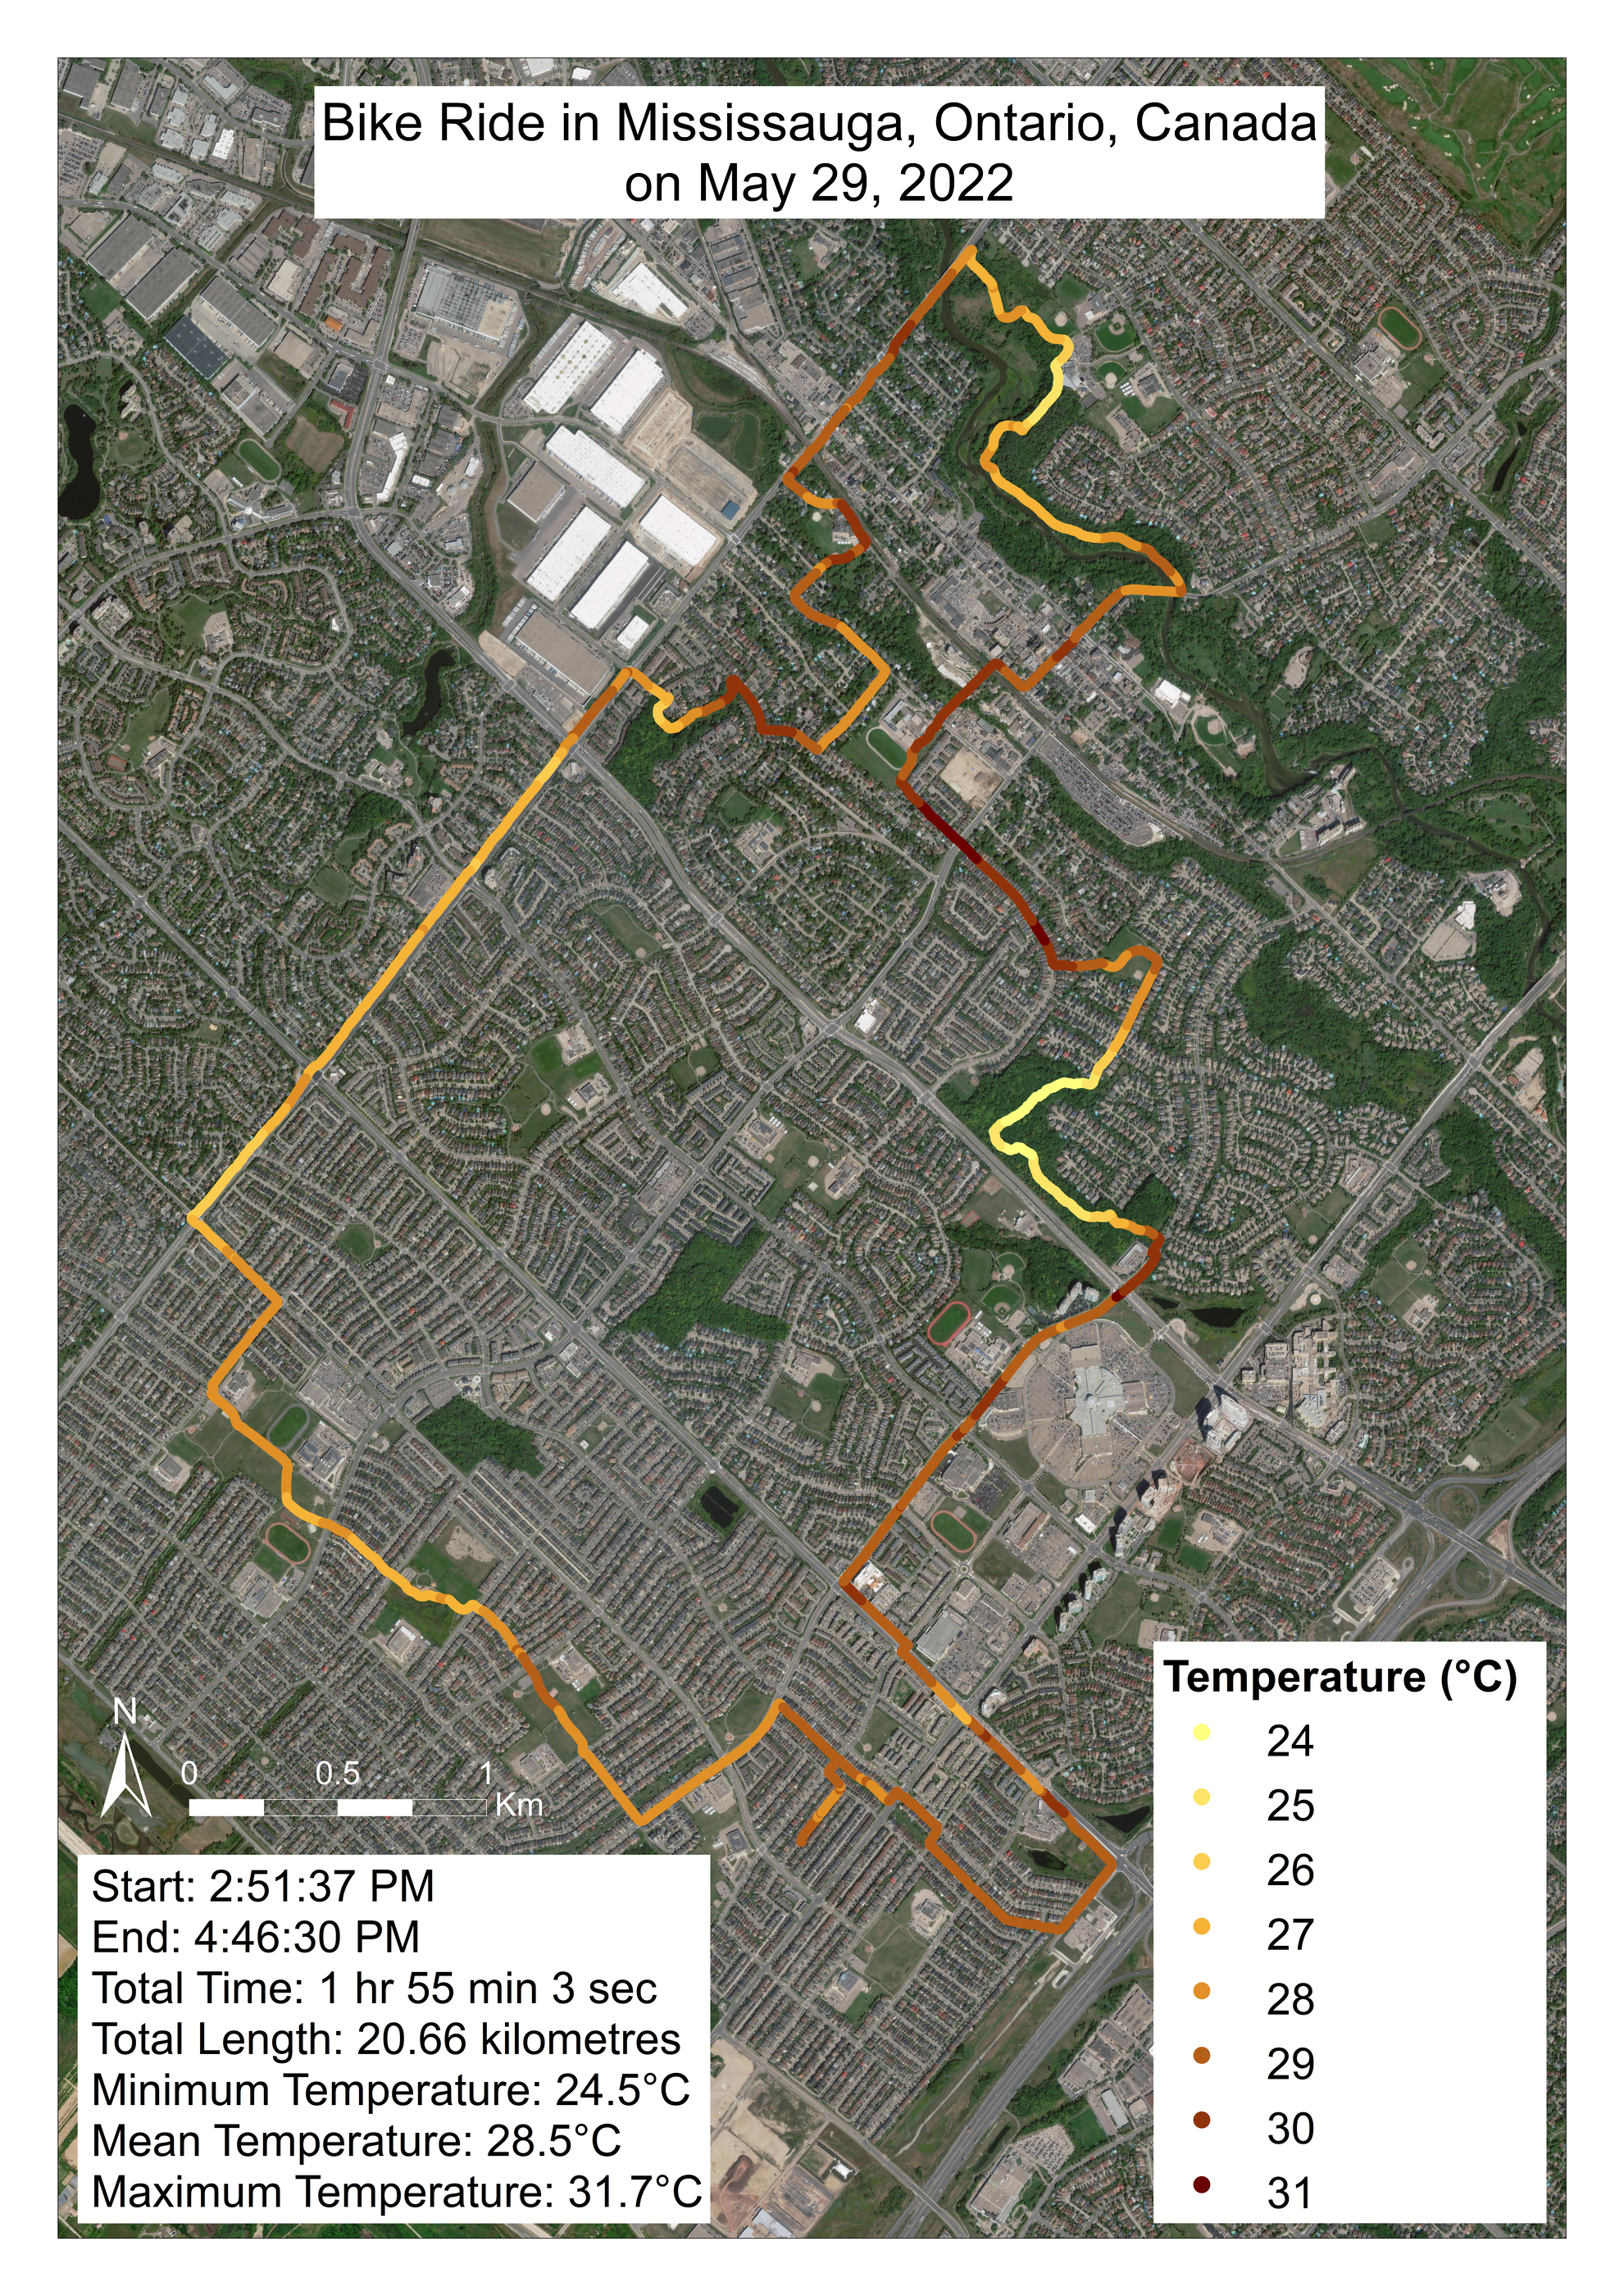
The map above was created in ArcMap to display the temperature in Mississauga on May 29th, 2022. This test ride was about 2 hours long and ended before 5 PM. According to the Toronto International Airport Weather Station, the average temperature during the time of the ride was about 24 degrees Celsius, and the mean temperature of this bike ride was about 28.5 degrees Celsius.
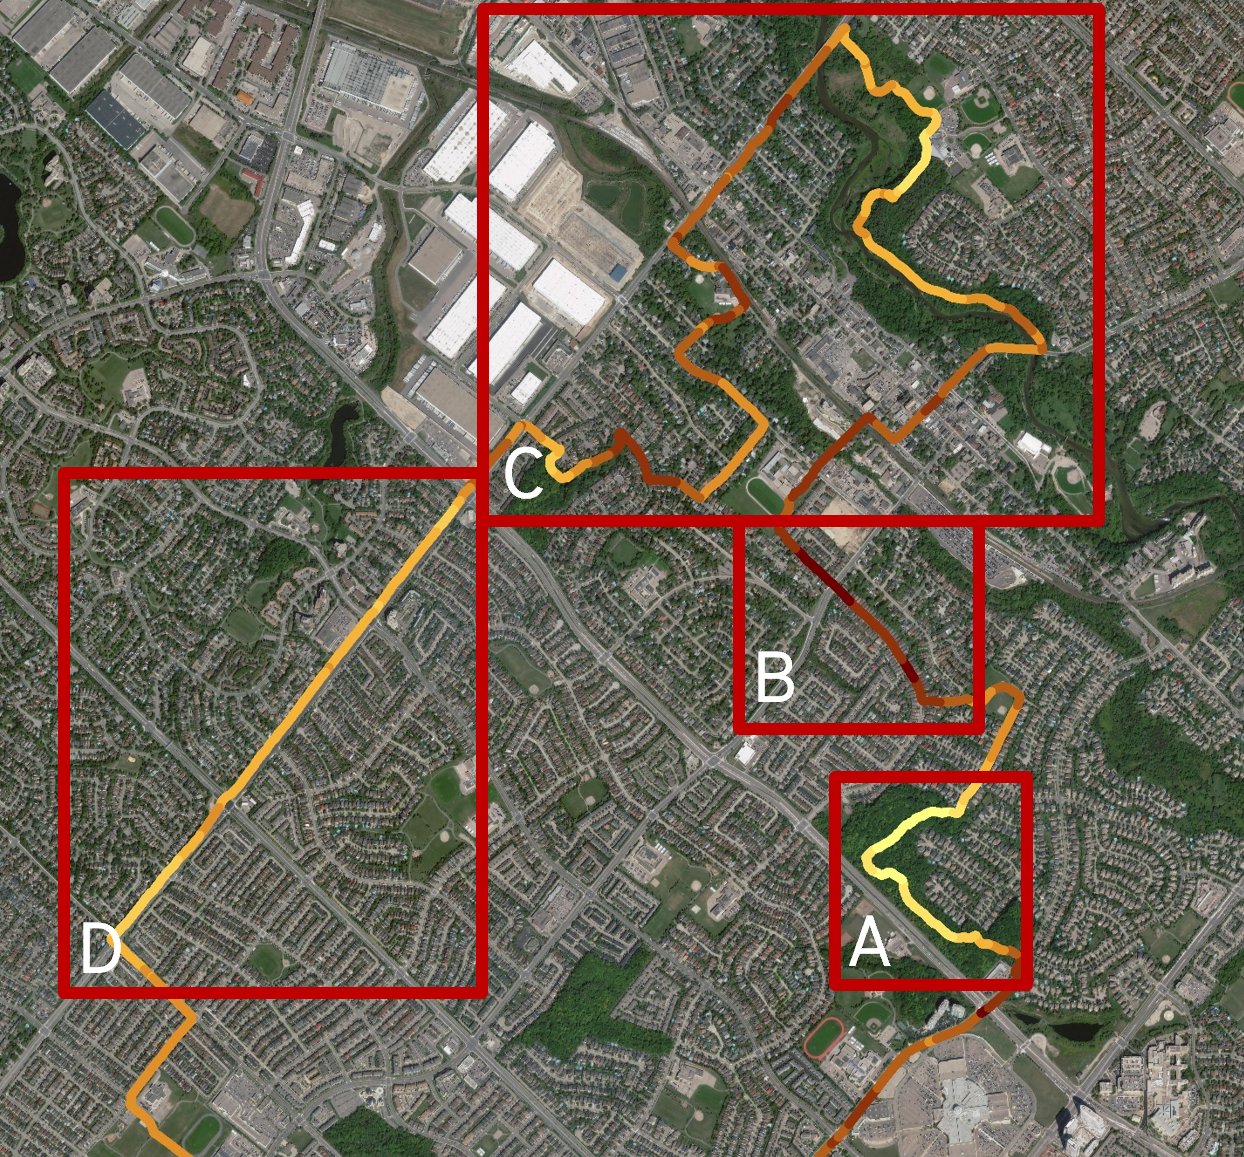
A. This area of the ride seemed to be the coldest. This was a forested gravel path, surrounded by tall trees on both sides. We are seeing interesting results of how trees and vegetation can moderate temperature.
B. This next part of the ride seems to be the hottest. I rode on a large asphalt road.
C. For part of the ride, I was going in and out of forested areas, making the temperatures increase and decrease.
D. Finally, this part of the ride was on a sidewalk covered in shade, making the temperatures slightly decrease.
So far, we are seeing exciting results of how green space can potentially decrease temperatures along various types of paths with different surrounding vegetation. The next steps are to conduct fieldwork this summer and begin to collect the remote sensing data. This research aims to improve planning in cities by understanding better the relationship between heat and vegetation to help city planners with infrastructure planning. I looked forward to sharing more updates and results in the near future!
Thank you!
— Scarlett Rakowska
References
Anderson, M. C., Norman, J. M., Kustas, W. P., Houborg, R., Starks, P. J., & Agam, N. (2008). A thermal-based remote sensing technique for routine mapping of land-surface carbon, water and energy fluxes from field to regional scales. Remote Sensing of Environment, 112(12), 4227-4241.
Brown, R. D., Vanos, J., Kenny, N., & Lenzholzer, S. (2015). Designing urban parks that ameliorate the effects of climate change. Landscape and Urban Planning, 138, 118-131.
Brunsell, N. A., & Gillies, R. R. (2003). Length scale analysis of surface energy fluxes derived from remote sensing. Journal of Hydrometeorology, 4(6), 1212-1219.
Curriero, F. C., Heiner, K. S., Samet, J. M., Zeger, S. L., Strug, L., & Patz, J. A. (2002). Temperature and mortality in 11 cities of the eastern United States. American journal of epidemiology, 155(1), 80-87.
Hiemstra, J. A., Saaroni, H., & Amorim, J. H. (2017). The urban heat island: thermal co
IPCC (Intergovernmental Panel on Climate Change). (2007). Climate Change 2007: The Physical Science Basis; IPCC Fourth Assessment Report (AR4). Cambridge University Press: Cambridge, UK; New York, NY, USA.
Karnieli, A., Agam, N., Pinker, R. T., Anderson, M., Imhoff, M. L., Gutman, G. G., … & Goldberg, A. (2010). Use of NDVI and land surface temperature for drought assessment: Merits and limitations. Journal of climate, 23(3), 618-633.
Kustas, W., & Anderson, M. (2009). Advances in thermal infrared remote sensing for land surface modeling. Agricultural and Forest Meteorology, 149(12), 2071-2081.
Lu, D., & Weng, Q. (2006). Use of impervious surface in urban land-use classification. Remote sensing of environment, 102(1-2), 146-160.
Patz, J. A., Campbell-Lendrum, D., Holloway, T., & Foley, J. A. (2005). Impact of regional climate change on human health. Nature, 438(7066), 310-317.
Statistics Canada. (2018, May 17). Canada goes urban. https://www150.statcan.gc.ca/n1/pub/11-630-x/11-630-x2015004-eng.htm
Yoshida, A., Hisabayashi, T., Kashihara, K., Kinoshita, S., & Hashida, S. (2015). Evaluation of effect of tree canopy on thermal environment, thermal sensation, and mental state. Urban Climate, 14, 240-250.
Zhang, R., Tian, J., Su, H., Sun, X., Chen, S., & Xia, J. (2008). Two improvements of an operational two-layer model for terrestrial surface heat flux retrieval. Sensors, 8(10), 6165-6187.