
Utilizing GIS in other disciplines: Implementing photos in webmap pop-ups
As an undergraduate student at the University of Toronto Mississauga (UTM), I am double majoring in Geographical Information Systems (GIS) and Communication, Culture, Information, and Technology (CCIT). I am currently taking a CCIT course that involves inclusive design and social responsibility. For one of the assignments, we had to walk around our neighbourhood and take photos of the barriers and wayfinding points we encountered. We were then asked to map our route with the barriers and wayfinding points and write a short report about them.
For some background, a barrier is an obstacle that we encounter that resists us from completing a specific task (Steinfeld, 2012). A wayfinding point is a type of information that communicates to people about a destination (Levine, 2003).
With my GIS knowledge, I thought this was an excellent opportunity to use ArcGIS Online to create a dashboard. It was my first time making a dashboard, and as I was playing around with the features, I wondered if I could implement photos. After doing some research, I was able to find a way to implement the photos of the barriers and wayfinding points to my dashboard.
In this blog post, I will explain how I created this dashboard.
Here is the dashboard hosted in ArcGIS Online:
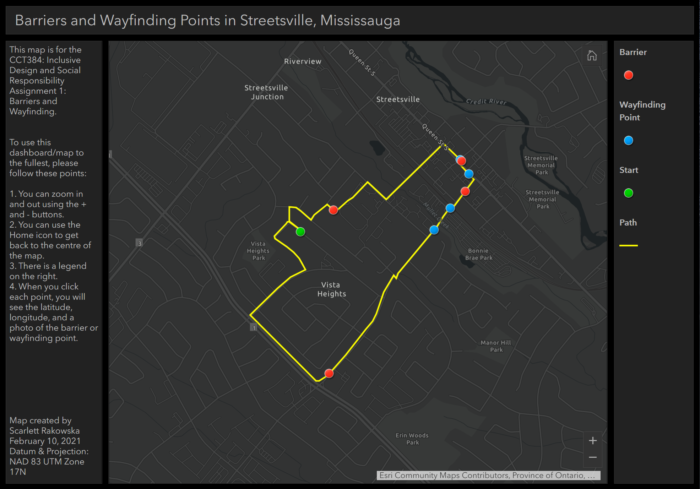
At first glance, you can see that it is a very simple dashboard. One of my main priorities for this map was to give the user some knowledge about this dashboard and how to use it. This is extremely important as this map was for a non-GIS course. I wanted the user to know how to use the dashboard to its fullest to ensure they would notice the little things that were included.
Another priority for me was to include a legend to make it clear for the user. This was also a requirement for my map for the assignment, so I knew it had to be included!
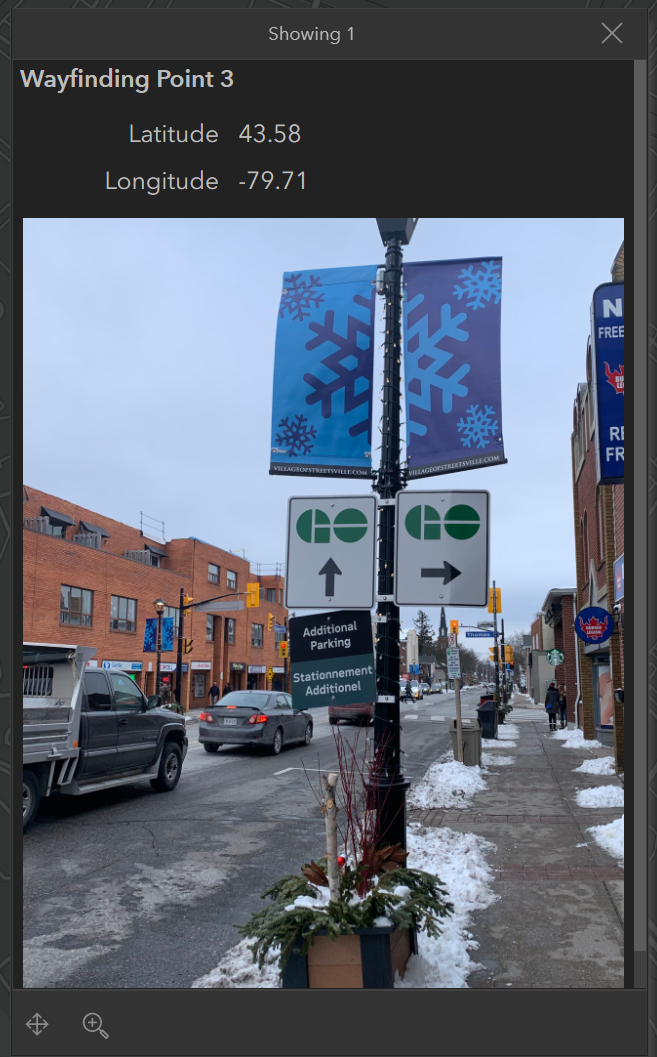
As mentioned earlier, I was really excited about implementing the photos that I took from my walk into the map. I knew I would include the photos of the barriers and wayfinding points in the appendix of my written part of the assignment, but I also wanted to make this dashboard a little more fun. When the user clicks on a point on the map, a pop-up appears with the barrier or wayfinding point’s coordinates, along with the photo.
In this article, I will provide a tutorial that explains how I implemented the photos in the pop-up of my webmap that I used for my dashboard. Creating the dashboard itself is another topic that I won’t be covering in this article.
After adding the content/data to your map, before we can continue editing our webmap, we must add the photos to our content in ArcGIS Online. We must upload the photos we want to use for our pop-up into ArcGIS Online. You can lookup details on how to do this in the ArcGIS Online documentation.
After uploading our photos to ArcGIS Online, we can go back to our webmap. There are three blue dots beside each layer when you hover over it. This button indicates more options.
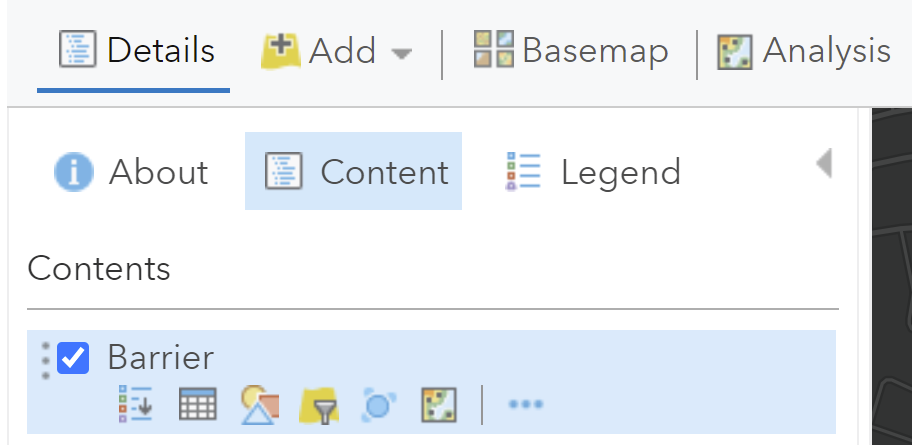
Once clicked, various options will appear. We want to implement a photo into a pop-up. So, click on “Configure Pop-up”.
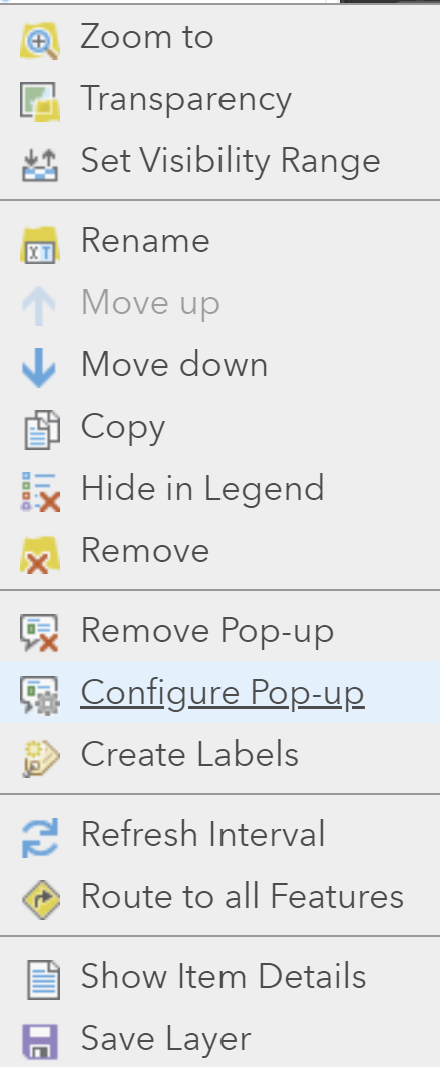
This will lead you to a new pane called “Configure Pop-up”. This is where you can edit the pop-up for your layer. This means that when a user clicks on your point, line, or polygon, a “pop-up” will appear with information about the layer.
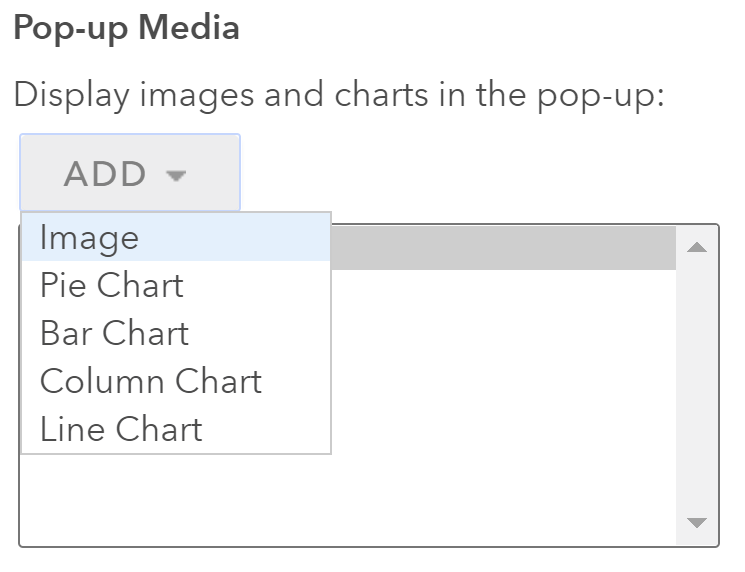
First, I changed the title of each layer’s pop-up. Then, I used the “Configure Attributes” to pick which fields I wanted to display in my pop-up. To include a photo to your pop-up, you can scroll down to the “Pop-up Media” option. Then click “Add”, then “Image”, since we want to include a photo into our pop-up.
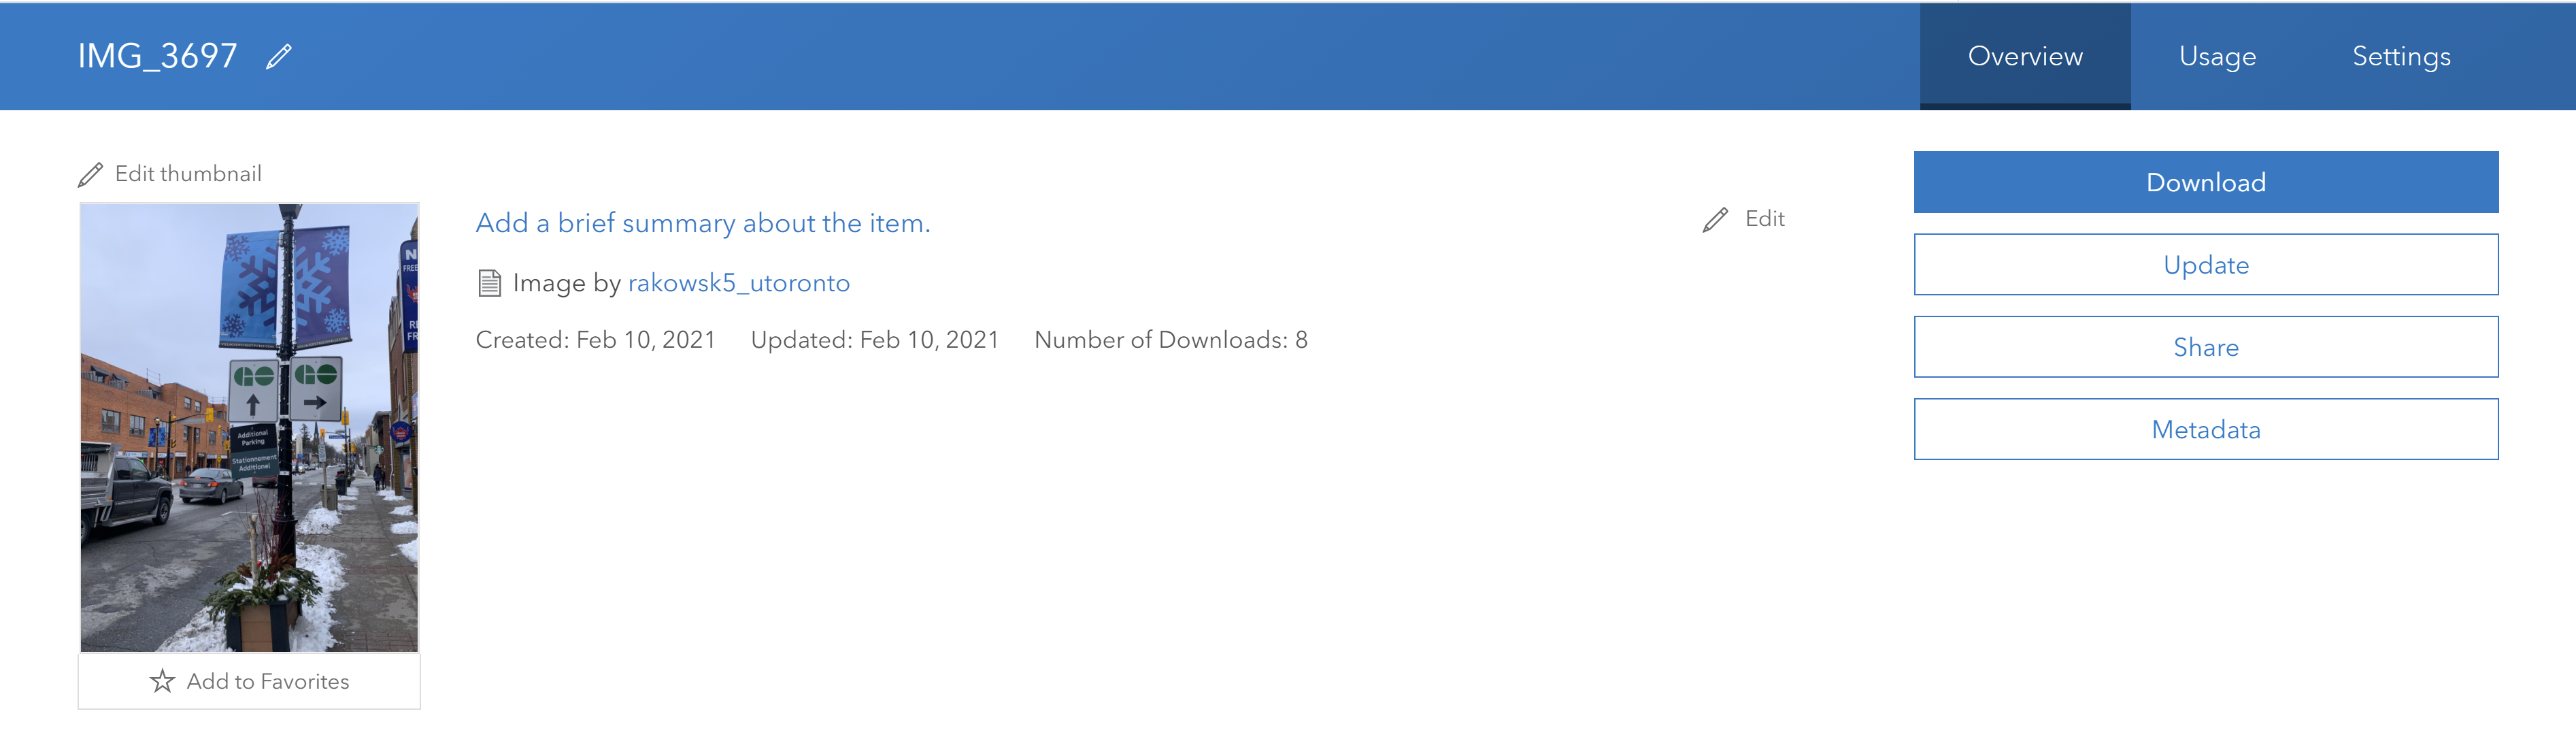
This will then lead you to the “Configure Image” option. Now, remember when we uploaded our photos into our content on our ArcGIS Online account? In a separate browser tab, open the item page for the photo in our content in ArcGIS Online, and look for its URL.
On the item page, scroll down to find the URL near the bottom of the page.
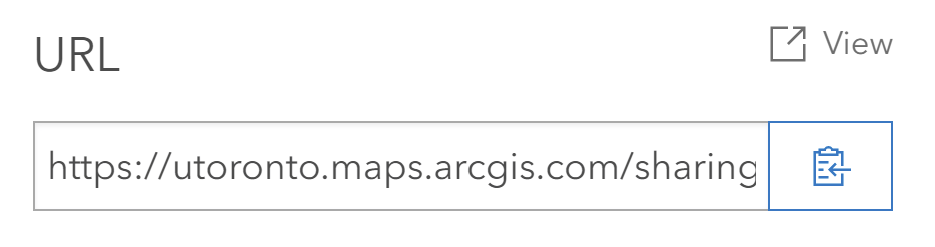
We must copy this sharable link, then go back to our webmap. Once back to the “Configure Image” option, we can simply paste the image’s shareable link in the “URL” section. Note that approach works well for my data, as I was only working with a few points, each displayed in its own layer in the map. To display unique photos for many different features, the same steps may be adapted to work dynamically with large datasets that store multiple features in a single layer. This is done by obtaining the URL for images from an attribute added to each feature in a single layer (see step 5a in the documentation for showing images in popups).

You can also include a title and caption. Now it is time to click “OK” and save the webmap. Then you can include this webmap into a dashboard. If you plan on sharing your dashboard, make sure that not only is the webmap public, but your photos are as well! You can do this the same way you would for any content.
Now that you have a photo in your pop-up to implement a visual component of data, you can now share your webmap or dashboard!
Even though this assignment was for a non-GIS course, I was excited to implement my GIS knowledge into making a quick dashboard. I love that I could include a legend, an area to include information about the dashboard, and photos of the barriers and wayfinding points I encountered. Not only was it an exciting learning adventure being able to figure out how to include photos into a webmap, I was also able to express my love for GIS into another discipline. I hope that with my webmap, I was able to teach some exciting GIS to non-GIS users.
Happy Mapping!
— Scarlett Rakowska
REFERENCES
Levine, D. (1997). Universal Design New York 2. Center for Inclusive Design and Environmental Access.
Steinfeld, E., Maisel, J. & Levine, D. (2012). Universal Design: Creating Inclusive Environments. Hoboken, N.J: John Wiley & Sons