
Manually Geocoding – Preparing for Analysis of Green Space Accessibility in Ontario Elementary Schools and Student Performance
This blog post will present my current undergraduate thesis project.
Houlden et al. (2017) suggest that individuals living in areas with large green space areas have higher mental well-being, such as life satisfaction and happiness. Exposure to green space might enhance well-being as it can act as an escape from stress and anxiety (Houlden et al., 2017). The relationship between well-being and academics is important because if students are experiencing stress, they are unable to learn (Currie, 2020 ). Bijnens et al. (2020) found that green space can be associated with childrens’ intelligence. It has been found that there is a positive relationship between the amount of greenness around schools and their students’ academic performance (Wu et al., 2014). A study by Wu et al. (2014) performed in Massachusetts found that there is a positive relationship between Normalized Difference Vegetation Index (NDVI) and student performance. They used a Geographic Information System (GIS) to examine various buffers around the schools in Massachusetts and academic performance from standardized testing in the third-grade (Wu et al., 2014). Their findings show that students with higher exposure to greenness show better academic performance in both English and Mathematics (Wu et al., 2014).
I am currently working on my undergraduate thesis at the University of Toronto Mississauga under the supervision of Dr. Matthew Adams. I am analyzing the accessibility of green space at Ontario elementary schools and their academic performance. Unlike the study (Wu et al., 2014) I mentioned earlier, I will be looking at the greenness within the school boundaries, along with a surrounding 1km buffer to identify green space. Green space is identified as the lawn space used by students during school hours. It is also important to look at a green space buffer around the schools because not only do students spend most of their day at school, they also spend time at parks near their home. The school locations were obtained by extracting school information from the Ontario Ministry of Education website. Enrollment numbers, school board information, EQAO results, and socioeconomic factors were also extracted. The property boundaries of the schools were obtained through parcel data from the Ontario Electronic Land Registration.
In the analysis for my thesis, remote sensing data from the Landsat 8 satellite will be used to identify green space within the school boundary, along with the 1km buffer. There will be a Normalized Difference Vegetation Index (NDVI) threshold to identify green space. The Normalized Difference Vegetation Index (NDVI) is a spectrum-based greenness index that detects vegetation. The index ranges from -1.0 to 1.0, where an index below 0 indicates non-vegetation features such as water, snow, and ice, while an index above 0 indicates healthy vegetation. This study will use Landsat 8 data from the summer months as it will give the best representation of greenness. Student performance will be based on EQAO results from the third- and sixth-grade levels in Reading, Writing, and Mathematics. EQAO is a standardized test performed by the Education Quality and Accountability Office in Ontario. A statistical regression will access greenness spatially and aspatially. The statistical correlation between green space and student performance may help with the planning and development of schools in Ontario. School performance will be the dependent variable and the independent variables will be green space and the socioeconomic factors, which include school-aged children who live in lower-income households, whose first language is not English, etc. Our anticipated results are that we will find a statistical correlation with higher amounts of green space and higher overall student performance after controlling for socioeconomic factors, and that higher-income neighbourhoods will have higher student performance.
In this blog post, I describe my process of geocoding and manually validating and editing the locations of nearly 4000 Ontario elementary school addresses, as well as their property boundaries using ArcMap.
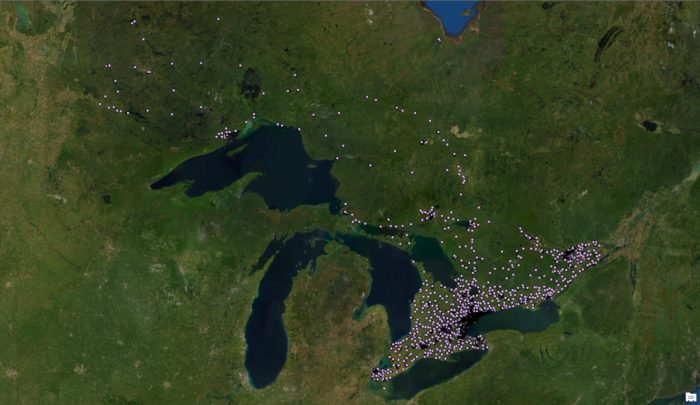
After extracting the school information from the Ontario Ministry of Education website, I was able to obtain the school addresses. I used ArcMap to geocode the addresses. The geocoding utility in ArcMap allows you to import a table of records with addresses, and have those translated into x,y coordinates as point features coordinates using the ArcGIS Online geocoding service. Even though this sounds like a simple task, I ran into multiple problems. After adding the parcel data of the school boundaries, my goal was to perform a spatial-join between the polygons with the points. From there, I would be able to isolate the polygons I needed to move forward my planned analysis, using Landsat 8 data to calculate Normalized Difference Vegetation Index (NDVI) to find the levels of greenness for school properties. However, it came to my realization that something went wrong. Assuming that the geocoding results produced locations inside each school’s property parcel was part of the problem.
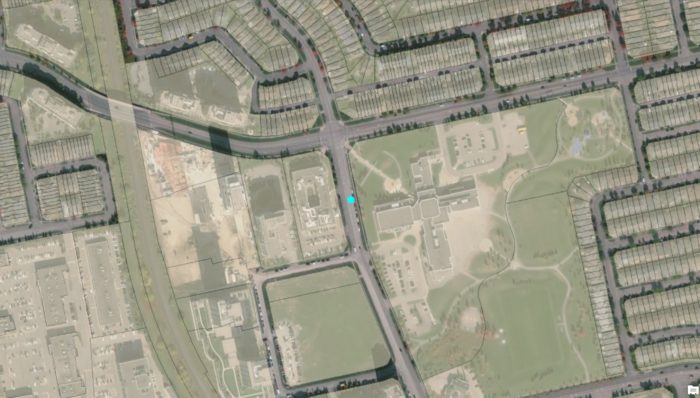

As seen in Figure 2 above, the blue point in the left photo is not located directly on the school. Along with this, it is also not inside a parcel polygon. This is an example of a street address that is located along portion of a street network based on address ranges, versus a point address that might actually be represent location of a house or building rooftop (types of address results generated by the ArcGIS geocoding service are described online). As a result, when I did the spatial join earlier, points such as the examples in Figure 2 on the left were not associated with corresponding polygons. This is one reason why the spatial join did not perform as I expected. As seen on the right photo of Figure 2, the blue point has been edited to reposition it within the school boundary.
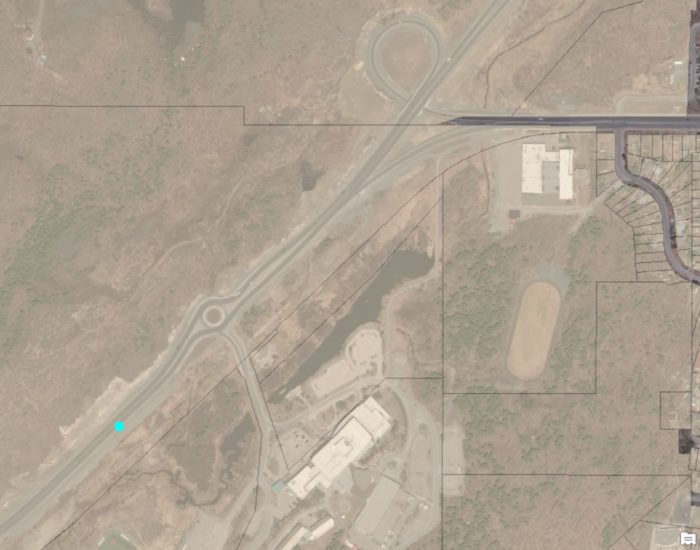
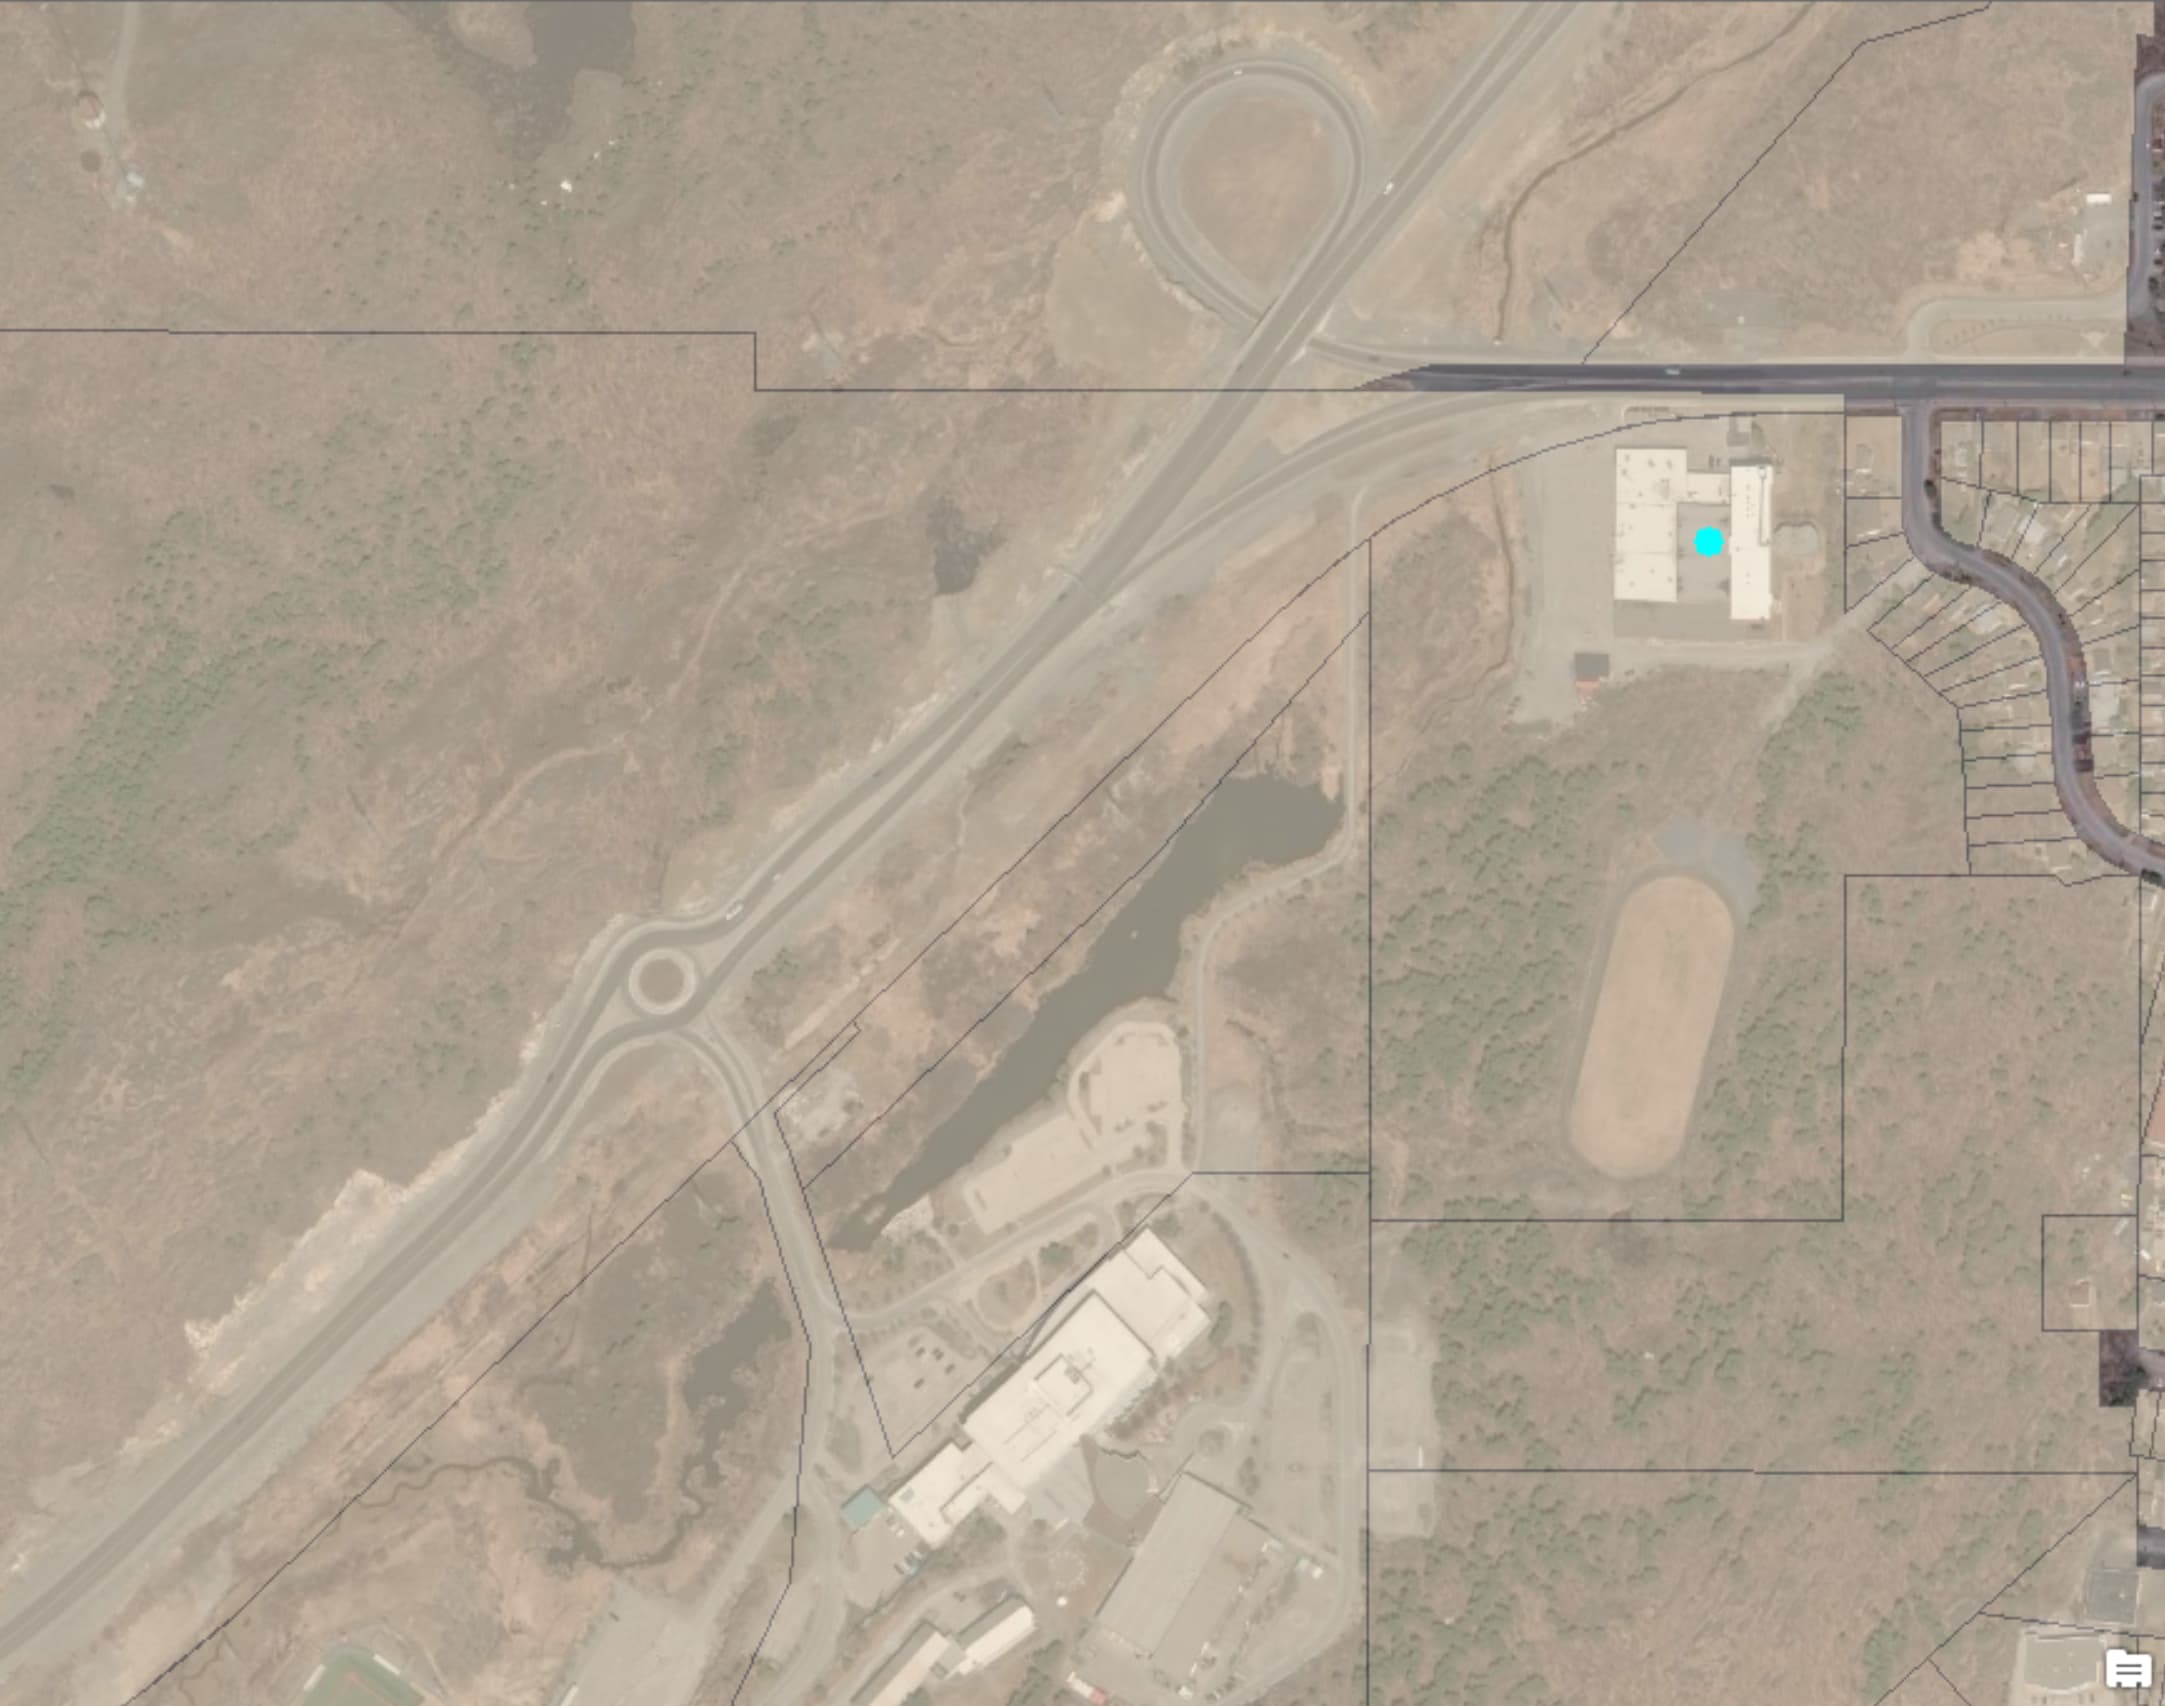
The preferred rooftop accuracy for geocoding is not available in all areas. In some areas of the province even street address accuracy was not possible, and addresses were returned with postal code accuracy (e.g., Figure 3 on the left). The locations for these addresses were often located very far away from the school’s actual location. This manual validation to make sure the geocoded points were on the school building and within the polygon of the school boundary had to be done for all 3891 schools. Where required, I needed to manually move points to place them inside the correct parcel. As you can imagine, this was very time-consuming. However, after a lot of resilience, determination, and 41.5 hours, the geocoding was officially done.
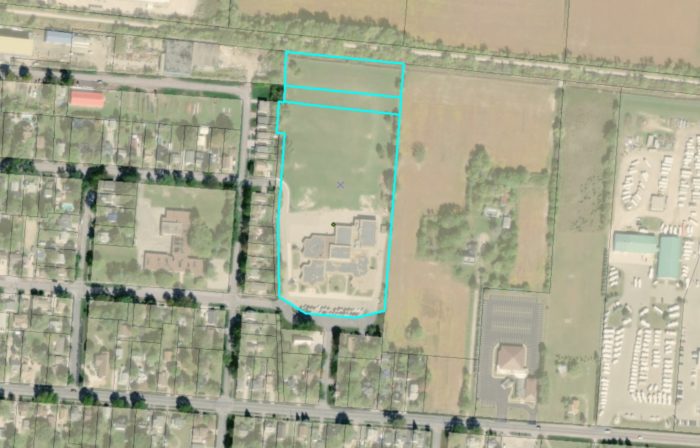

Before continuing with the rest of my project, I also needed to manually validate the boundaries of the schools. As seen in Figure 4, some of the property parcels are not simple polygons encompassing a school’s property boundary, as I need them to be. This is another reason why the spatial join I performed earlier did not work as expected. While I was visually inspecting and editing the school addresses, I was able to take note of which school boundaries also needed to be updated and return to those to edit them in ArcMap.
When working with data, it is always important to recognize that not everything will go as planned. Looking back, it would have been ideal that the school addresses were accurate. However, it is important to know that geocoding addresses may not always be as accurate as you wish.
Even after all the time spent on manually geocoding, I feel very thankful and lucky that I am able to work on this project with Dr. Matthew Adams. I have come to love what I am working on and have learned so much in the process. I am excited to share the final project in 2021.
Thank you!
— Scarlett Rakowska
References
Bijnens, E. M., Derom, C., Thiery, E., Weyers, S., & Nawrot, T. S. (2020). Residential green space and child intelligence and behavior across urban, suburban, and rural areas in Belgium: A longitudinal birth cohort study of twins. PLoS medicine, 17(8), e1003213.
Currie, H. N. (2020). Mindful Well-Being and Learning. Journal of Chemical Education, 97(9), 2393-2396.
Houlden, V., Weich, S., & Jarvis, S. (2017). A cross-sectional analysis of green space prevalence and mental wellbeing in England. BMC public health, 17(1), 460.
Wu, C. D., McNeely, E., Cedeño-Laurent, J. G., Pan, W. C., Adamkiewicz, G., Dominici, F., … & Spengler, J. D. (2014). Linking student performance in Massachusetts elementary schools with the “greenness” of school surroundings using remote sensing. PloS one, 9(10), e108548.