
Farmland Assessment Value and Potato Crop Suitability in Carleton County, New Brunswick
In New Brunswick, farmlands (> 5 ha) are classified as non-residential and are assessed at market value. In contrast, freehold timberlands are assessed at one hundred dollars per hectare, while farm woodlots are assessed at one dollar per hectare [1,2]. This blog addresses the extent to which the assessed market value of farmlands reflects soil quality using ArcMap.
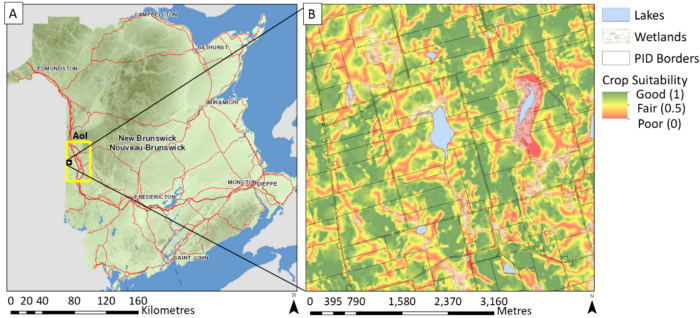
I retrieved properties assessment values and properties areas from the GeoNB website and I obtained potato crop suitability ratings (1 – good, 0.5 – fair, and 0 – poor) from the Forest Watershed Research Centre (UNB ForEM) [3,4,5].
Next, I extracted properties assessment values from the area of interest (AoI) in ArcMap using the Clip tool. Using the Zonal Statistics as Table tool, I computed soil suitability ratings for each property in the AoI.
Then, I selected properties that are farmlands only using Select By Attributes. Properties of less than 5 ha were then removed from the selection also using Select By Attributes; and properties intersecting the AoI were removed from the selection using Select By Location. Finally, I performed a regression analysis using the Ordinary Least Squares tool.

Farmlands assessment values can be predicted by the following equation: assessment value = [21.63 + 0.20 area + 9.90 crop suitability – 6.66 farm/wood]3, R2 = 0.27; p-values for regression coefficients < 0.0001. Hence, farmlands are not only valued in terms of property area, but also in terms of soil-related field cropping yields.
From a research perspective, further work could be done to examine farmlands assessment values more closely by separating buildings and other infrastructure components from land assessments. Additionally, it is important to note that some farmlands included in the analysis also contain forested areas.
I conducted a regression analysis in ArcMap for the very fist time; I was pleasantly surprised by how easy and simple it was. I will be taking the course called Regression Analysis using ArcGIS shortly to gain new skills conducting regression analysis in ArcMap.
References
1. Government of New Brunswick. 2005. Report of the Auditor General. Chapter 3 Service New Brunswick Property Assessment for Taxation Purposes. Retrieved from https://www.agnb-vgnb.ca/content/dam/agnb-vgnb/pdf/Reports-Rapports/2005v1/Chap3e.pdf.
2. Cook, B. A. 1992. Forest property taxation in New Brunswick: A comment. The Forestry Chronicle, 335-338.
3. Colpitts, M. C., Fahmy, S. H., MacDougall, J. E., Ng, T. T. M., McInnis, B. G. & Zelazny, V. F. 1995. Forest Soils of New Brunswick. Retrieved from https://www2.gnb.ca/content/dam/gnb/Departments/nr-rn/pdf/en/Publications/forest_soils_of_NB-e.pdf.
4. Furze, S. 2018. A high-resolution digital soil mapping framework for New Brunswick, Canada. UNB PhD Thesis.
5. Ogilvie, J. J. 2017. Flow-line and wet areas conformance testing of wetland locations using LiDAR and SRTM elevation data. UNB MSc Thesis.