
Handy Script Tool to Summarize Tree Characteristics within a Moving Search Window
I have been working on a project about spatial patterns of spruce budworm defoliation within plots over the past year. During the research process, I had to summarize surrounding trees’ characteristics (e.g., average diameter at breast height, total basal area, average annual defoliation, etc.) for each analyzed tree, by different tree species, within different search radii, and for every study year. The organized neighborhood data for each tree would be used to fit statistical models in the research. However, we had about 60 plots set up in the central Gaspé Peninsula region of Québec; thousands of trees were measured over 5 consistent years. The work would be endless without efficient batch processing. Fortunately, a Python script was created to help with the task, and wrapped as a Script Tool in ArcGIS Toolbox, as a “side product” of my project, for convenient application, or sharing with other people who have interests.
Here I use one of the plots in 2018 as an example, to show how the script works.
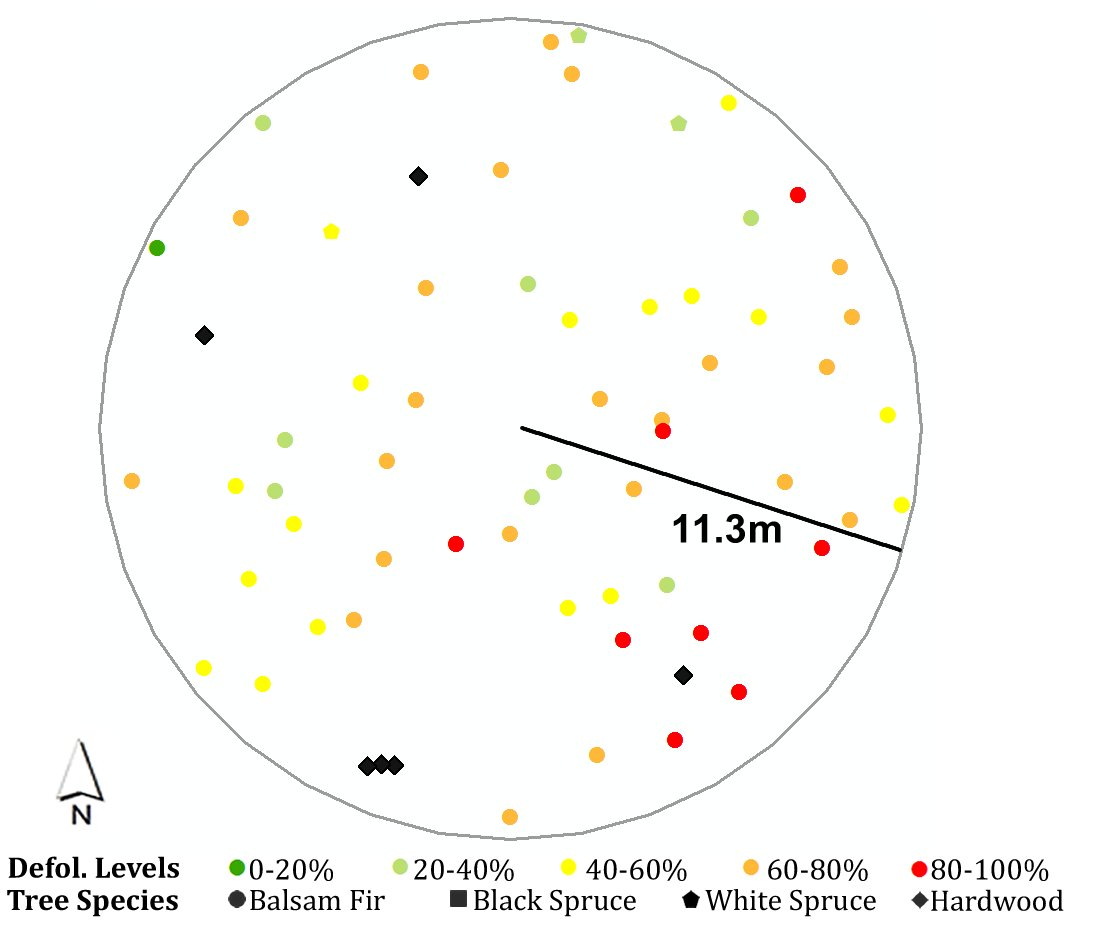
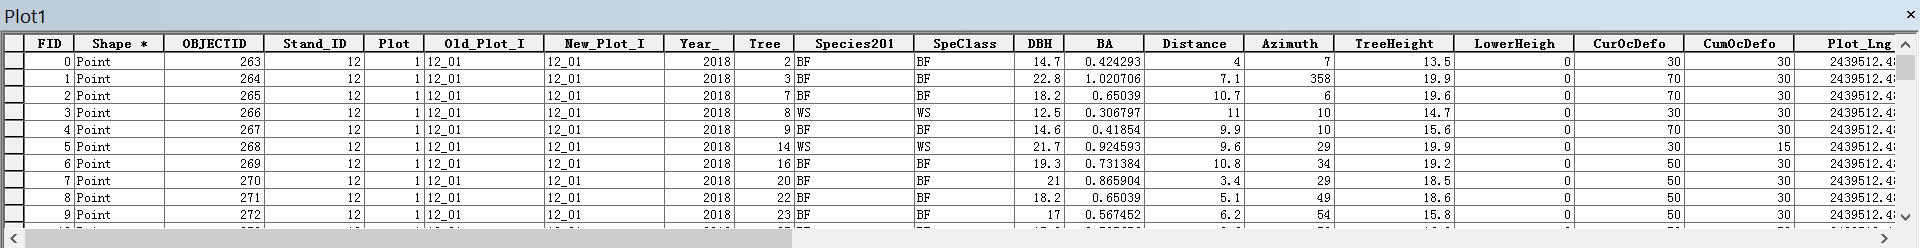
The attribute table records measured attributes for each tree in the plot, including tree species, diameter at breast height, basal area, tree height, annual defoliation, cumulative defoliation, azimuth and distance to the plot center, etc.
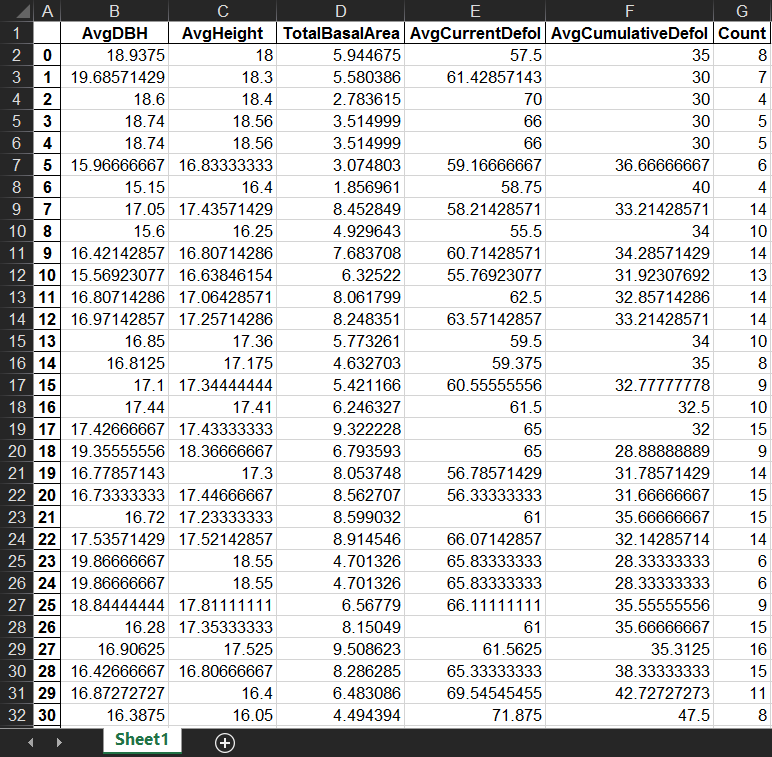
This is a summarized table with surrounding trees’ characteristics within a certain search distance (e.g., 5m in this case) which I need eventually. The first column is the index of target trees.
The following steps show how to generate the descriptive statistics for each tree’s neighborhood in batch processing, and export it as an Excel file.
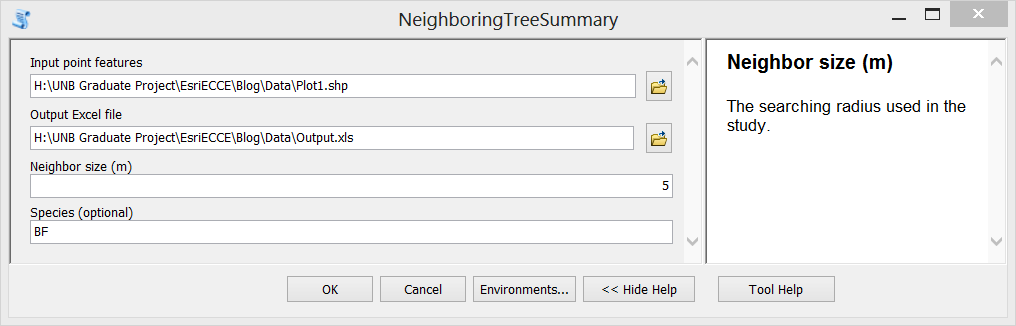
Step A. Environment settings, and define dynamic parameters which will be used as input in the Script Tool interface (input feature class, output file, neighbor size in meters, and the interested species).

Step B. Store all the treeIDs (FID of the input feature class) in a list by using “search cursor”.

Step C. Define a function with two parameters: tree_id and species, to calculate descriptive statistics.
Key sub-steps:
- Line 34 – make a temporary layer with only the subject tree in the layer.
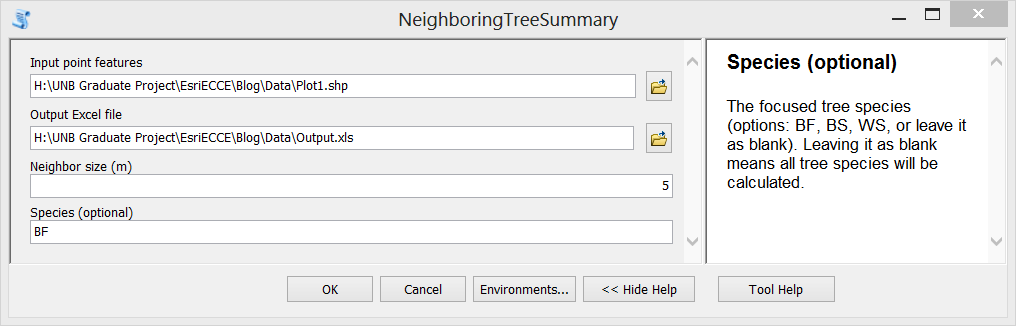
- Line 37&51 – whether the calculation is on all species or by each species will be optional in the Script Tool.
- Line 39-48 – select features from the input layer within a search distance (i.e., NeighborSize parameter) by the “Select By Location” function.
- Line 46-48 – descriptive statistics, here I did mean diameter at breast height, mean tree height, total basal area, mean current defoliation, mean cumulative defoliation, and the number of surrounding trees for my research purpose, but it can be changed easily according to one’s interests.

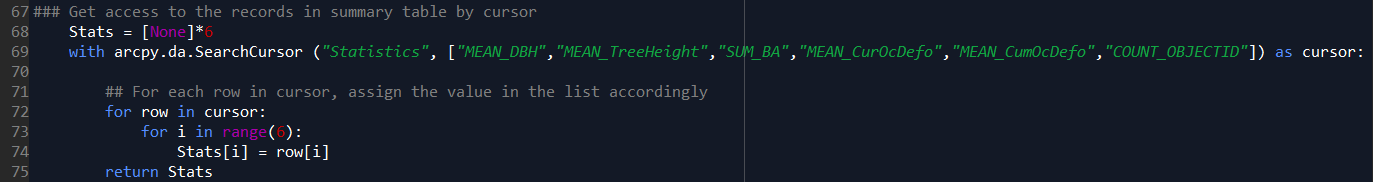
- Line 69-75 – store the results for this target tree in a list.
Step D. Organize a data frame to store the results for all trees; some useful functions are used from the “pandas” package. Then within a “for loop”, call the defined function for each tree. Finally, export the data frame into an Excel file.

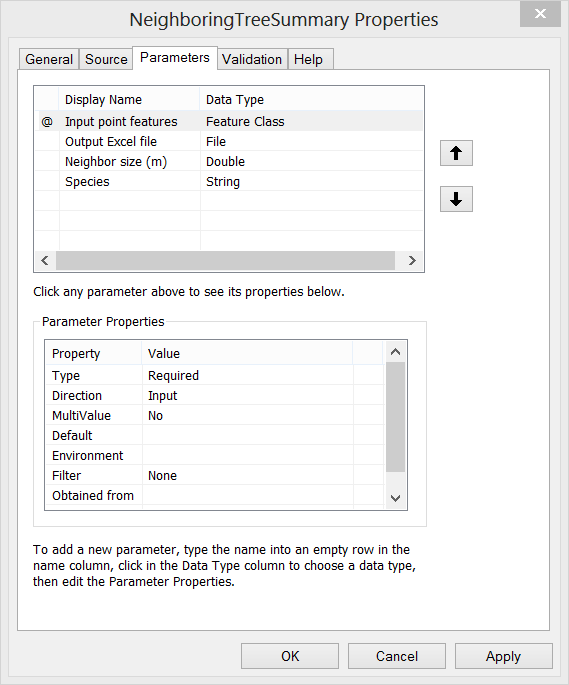
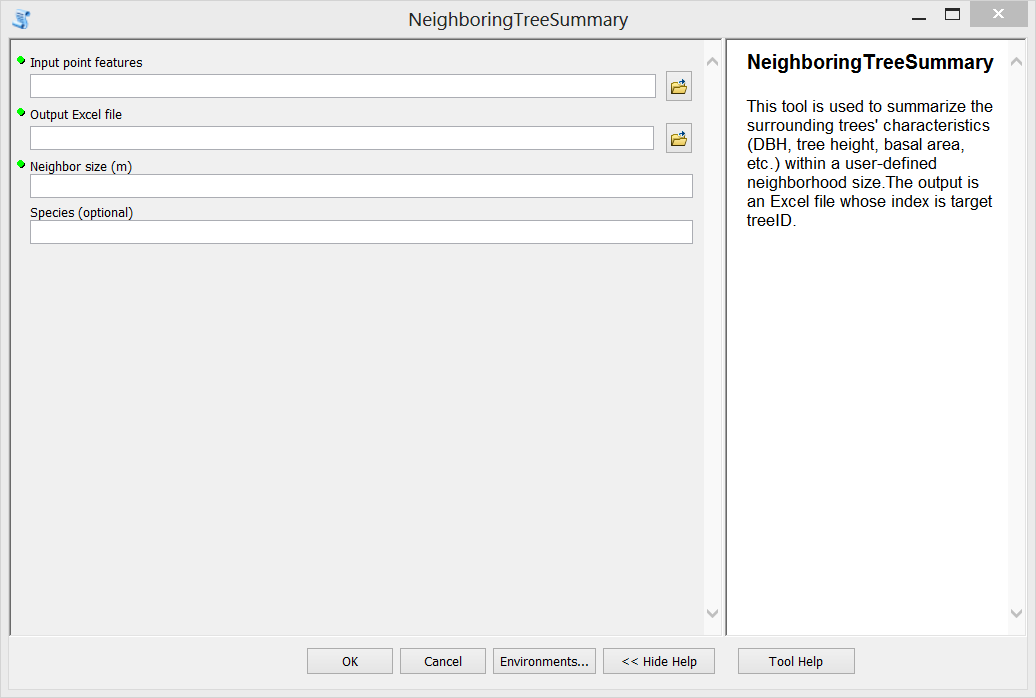
Step E. Then the script can be loaded as a Script Tool. Here I create a new tool named as “NeighboringTreeSummary”. Set proper properties for the input parameters of the tool. Also, fill in summary or explanation text for the tool.

Step F. Test the tool. Double click the newly created tool, fill in input parameters and run it. The generated Excel file is shown in the third figure above.
The summary statistics take the target tree into account during the calculation. Hence, if one hopes to remove the target tree from the calculation, additional lines will be expected in the script. One can also modify the tool to add in more functions such as other descriptive statistics.
Hope this simple exploration can offer some useful insights.
Cheers!