
GIS Insights for School Safety and Active Transportation
Identification of Collision Hotspots and Risk Levels for Pedestrian Safety in School Zones in Downtown Calgary
Introduction
In the dynamic urban landscape of downtown Calgary, ensuring pedestrian safety, especially in school zones, emerges as a critical challenge. My study employed Geographic Information Systems (GIS) tools for an extensive analysis of pedestrian-vehicle collision data, focusing on these densely populated areas known for their high traffic volumes. The noticeable increase in collisions within these downtown districts highlighted the pressing need for a sophisticated analysis of spatial patterns and risk factors impacting pedestrian safety.
The primary objectives of my research were twofold: firstly, to map the spatial distribution of vehicle-pedestrian collisions, and secondly, to conduct a thorough spatial analysis within school zones. This included identifying accident hot and cold spots and quantifying incident frequencies across different school zones. Through this analytical approach, I aimed to categorize school zones by risk levels—from low to high—to provide insights for creating safer streets near educational institutions.
This study’s data-driven methodology was designed to highlight high-risk areas, thereby facilitating strategic interventions and policy developments aimed at enhancing pedestrian and cyclist safety. The essence of this research was to contribute to ongoing urban planning and safety improvement efforts, ensuring that students and the broader school community in Calgary benefit from secure and accessible routes.
GIS Process for Pedestrian Safety Analysis
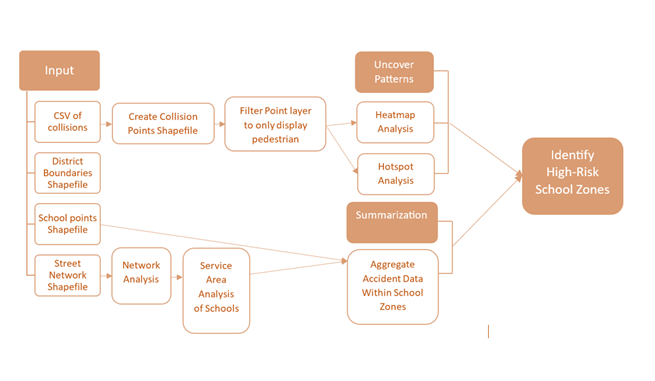
The analytical journey involved a series of steps, employing various GIS tools and methodologies to extract valuable insights into pedestrian accidents in downtown Calgary. The process commenced with adding pedestrian collision data to the map, where CSV coordinates were converted into point features in ArcGIS using XY Table To Point. This allowed for the visualization of the spatial distribution of pedestrian accidents.
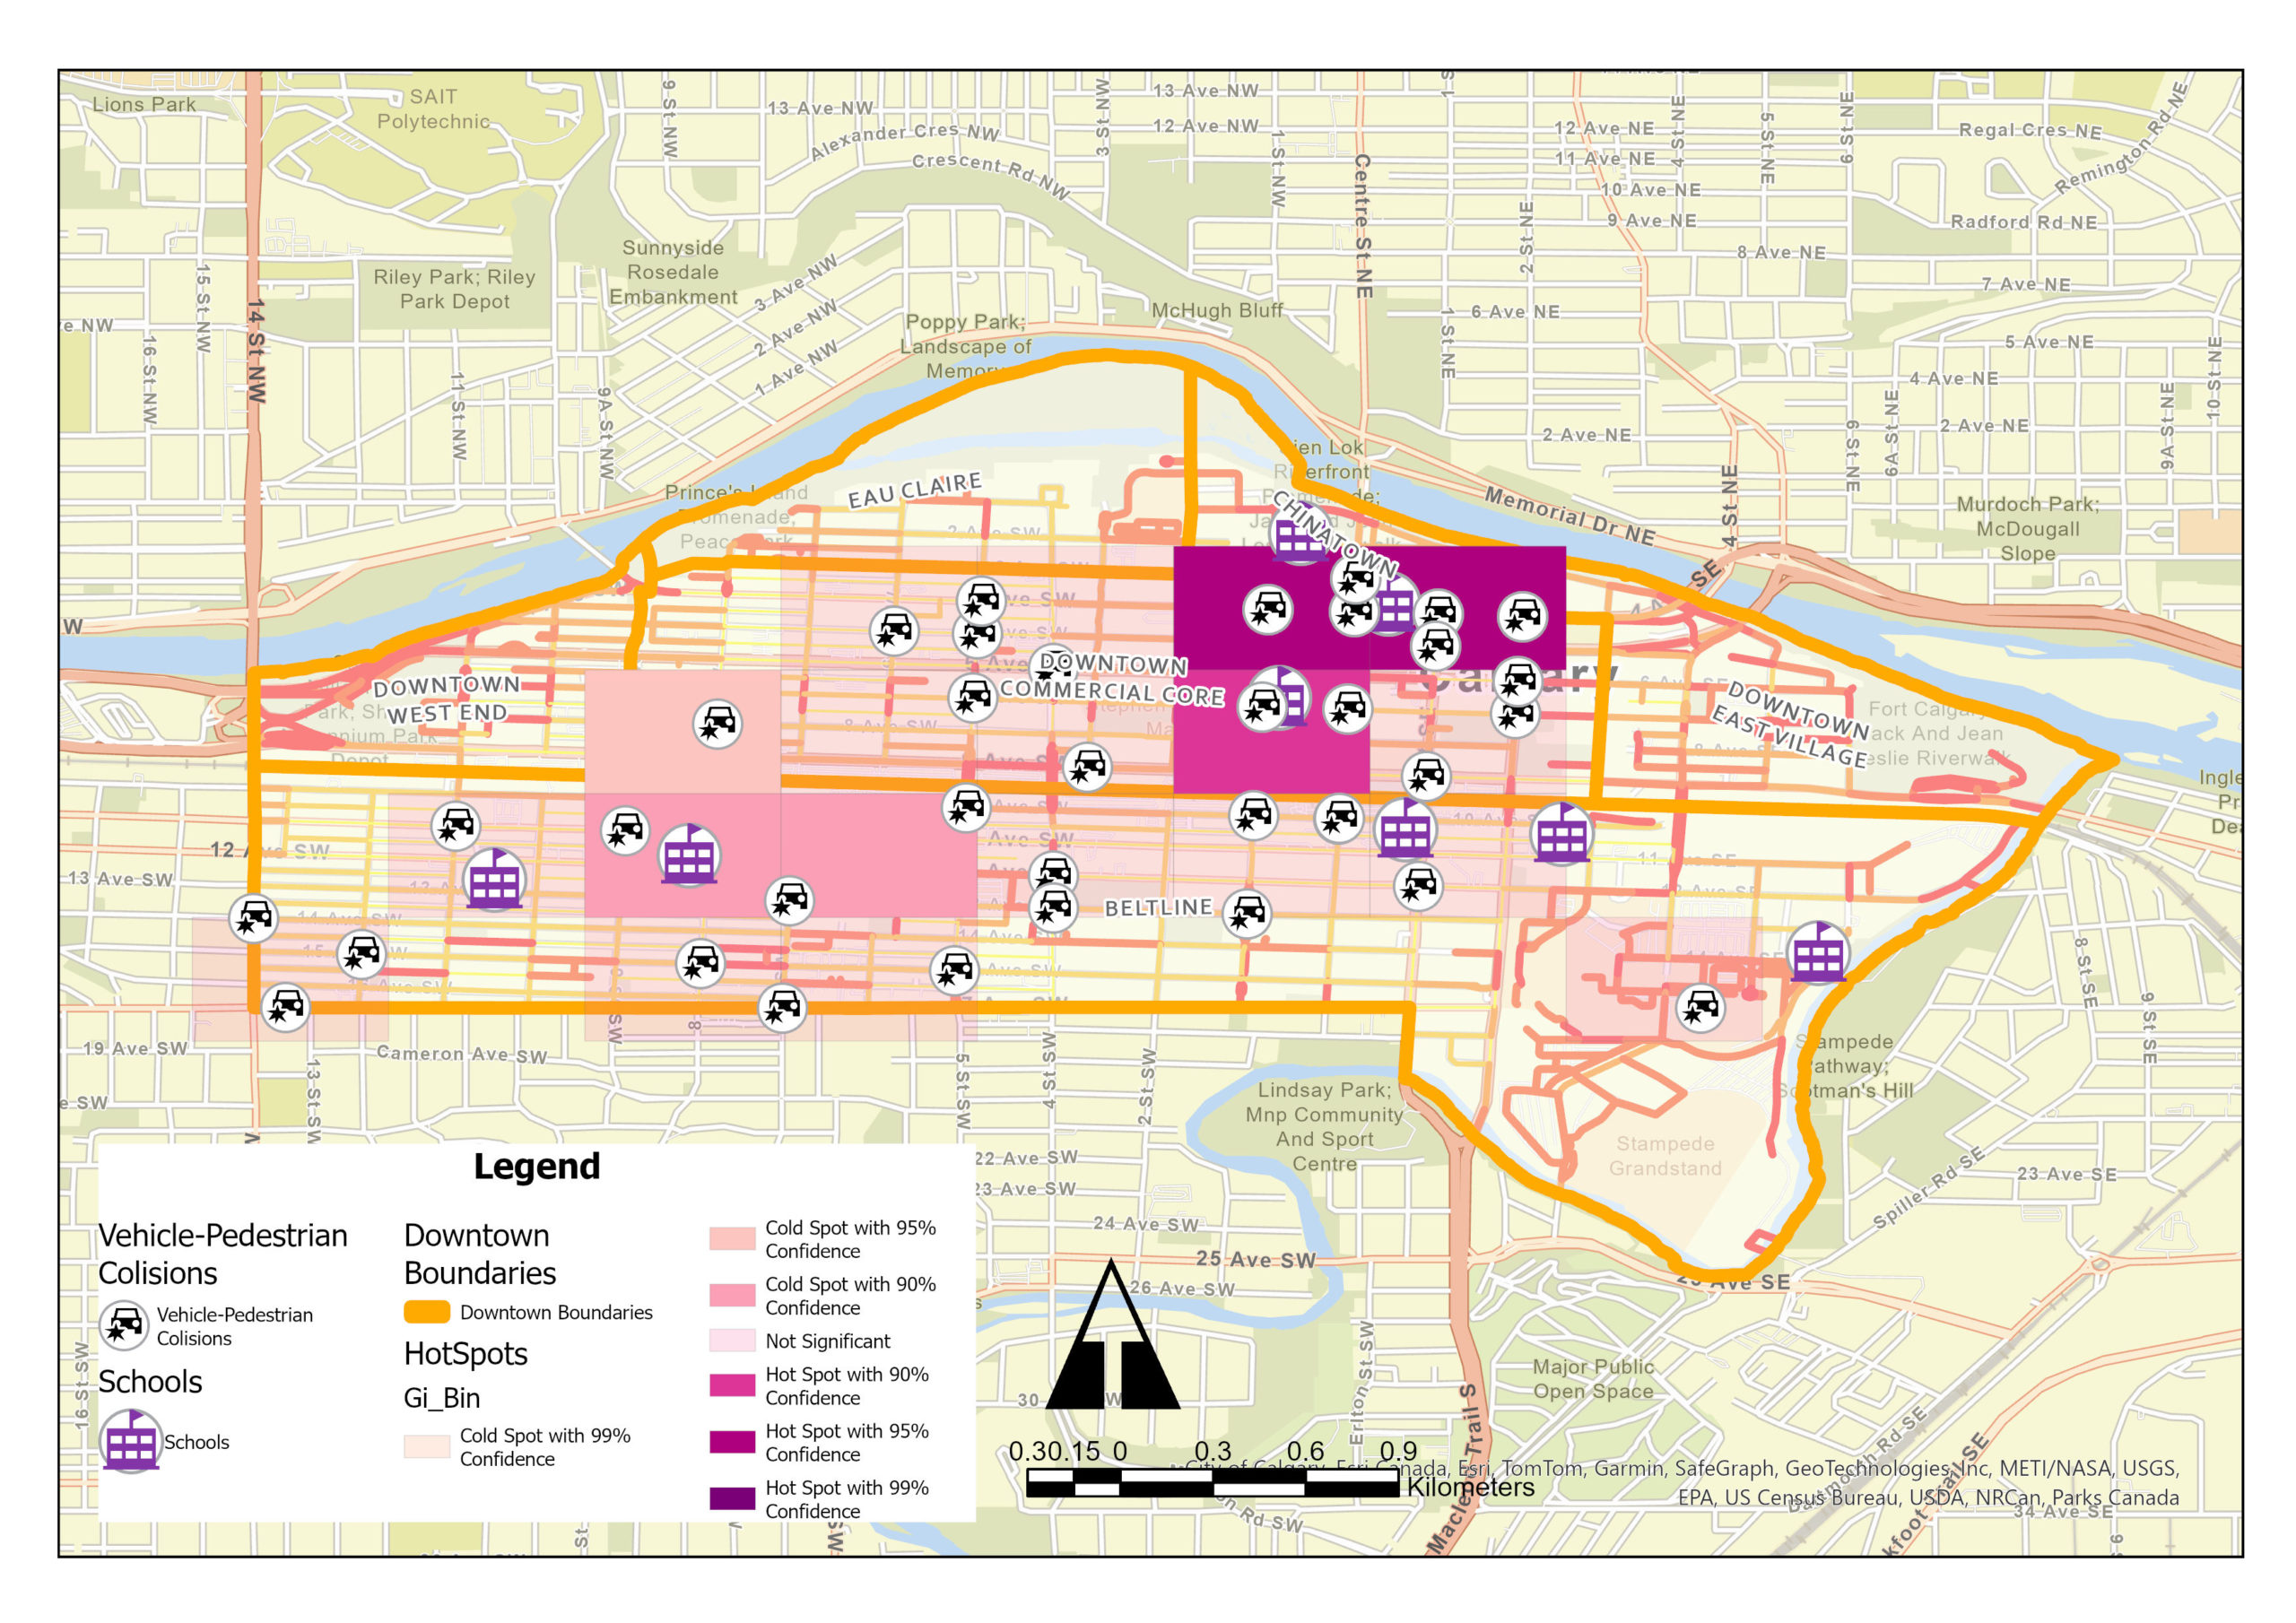
Subsequent steps included filtering the data with Definition Queries to focus on pedestrian-involved incidents and employing advanced GIS techniques like heat map symbology and hot spot analysis using the Find Hot Spots tool. These techniques helped identify significant patterns and areas of concern within the data. The “Find Hot Spots” tool was particularly useful in distinguishing clusters of high and low incident values, providing a deeper understanding than conventional heat maps could offer.
A critical component of the analysis was creating service areas around schools, defined within a walking distance of 2.4 km. This was achieved using ArcGIS Pro’s Service Area Network Analysis tools, which provided a spatial context for potential safety interventions. The most dangerous school zones were identified by aggregating collision data within these service areas using the Summarize Within tool and ranking the zones based on the frequency of incidents.
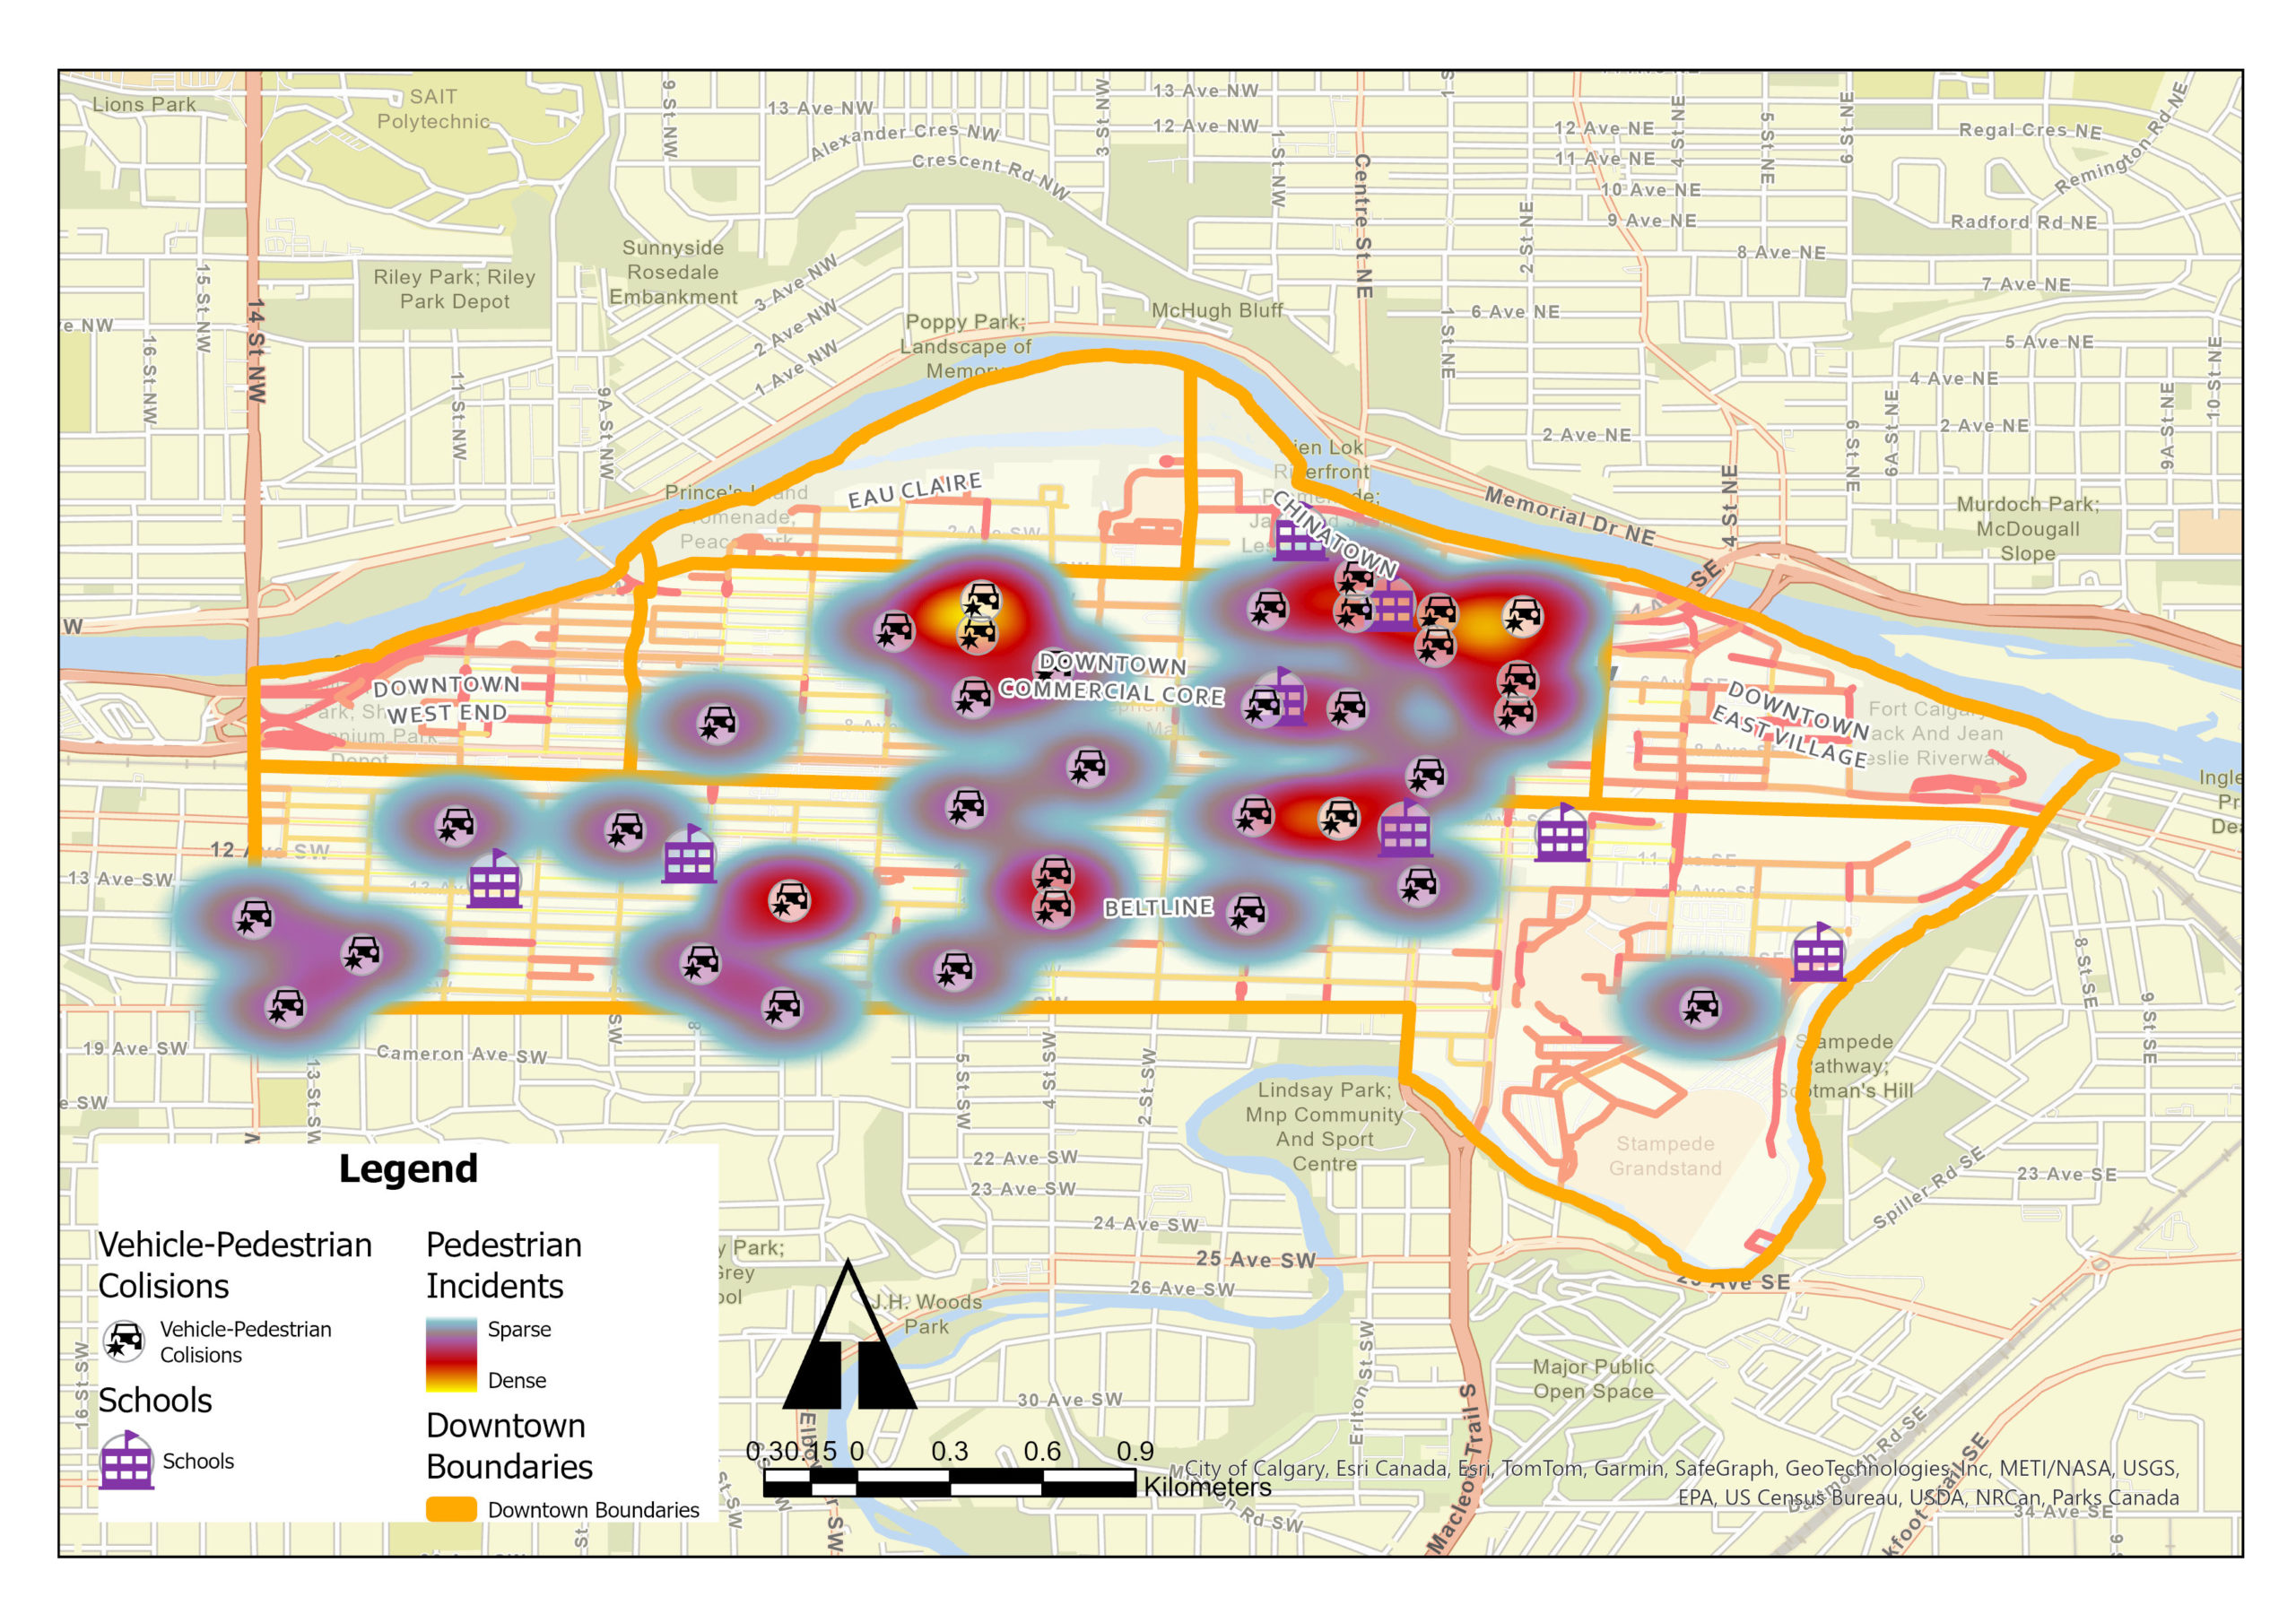
Output and Outcome
The analysis yielded several key visualizations, including maps highlighting the locations and intensity of pedestrian collisions within downtown Calgary and heat maps depicting collisions involving pedestrians. The results of the hot spot analysis identified statistically significant spatial clusters of pedestrian collision features, distinguishing between hot spots (areas with many collisions) and cold spots (areas with few collisions).
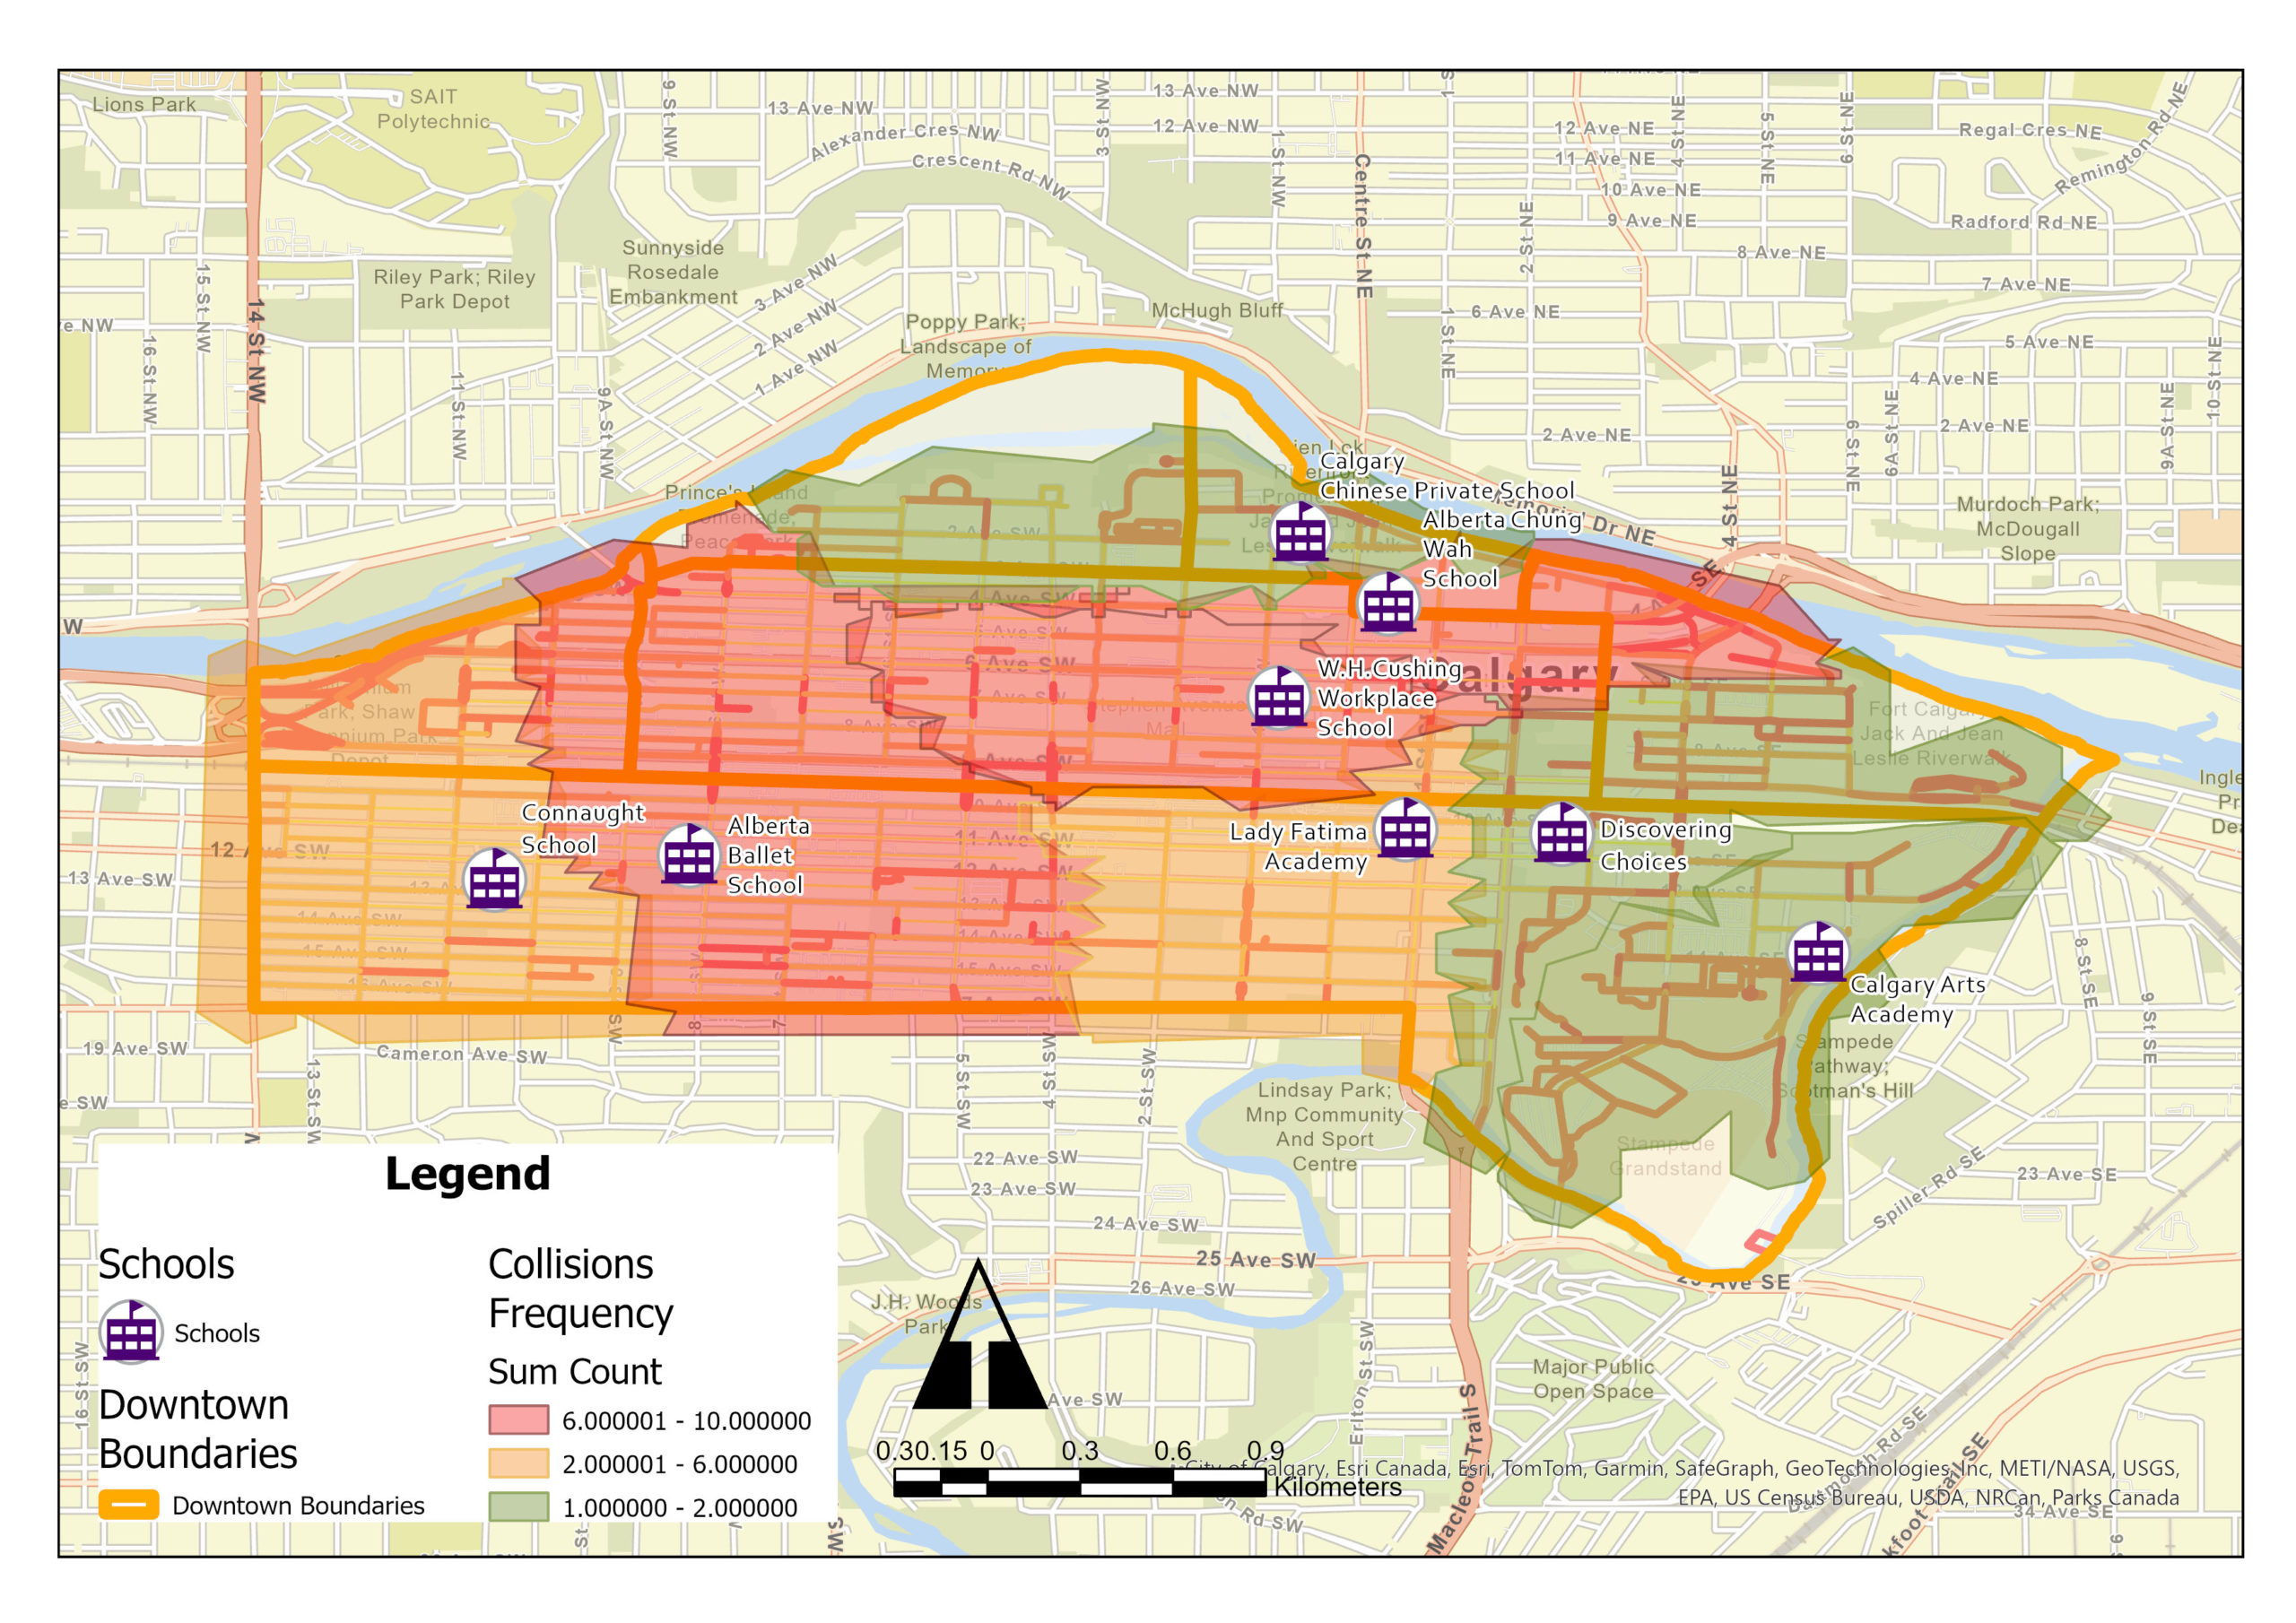
A particularly revealing aspect of the study was the school walking catchment analysis, which categorized areas based on collision frequency and identified high-risk, medium-risk, and low-risk zones. This analysis pinpointed areas where implementing safety measures could significantly enhance pedestrian safety around schools.
Conclusion
The findings from this GIS-based analysis highlight the potential for targeted interventions to mitigate pedestrian safety risks in downtown Calgary’s school zones. By identifying and prioritizing high-risk areas, this study provides a foundation for informed decision-making and policy formulation aimed at protecting our youngest citizens. Through the strategic application of GIS technology, we can take a significant step toward creating a safer, more navigable urban environment for all residents of Calgary.
Acknowledgments
This story map is part of “MODULE 1: Safe and Open Routes to School” for GEOG 588 Urban GIS, Winter 2024, University of Calgary. It reflects my contribution to our team project. Special thanks to my teammates: Tia Engelberger, Farzaneh Ahmadikordasiyabi, and Colin Davies as well as my instructor, Dr.Victoria Fast for her support and guidance.