
The McQuesten Urban Farm: A Look at Food Accessibility Using Service Areas and Origin-Destination Cost Matrices
My final year of undergrad at McMaster University was spent studying a local landmark case in urban agriculture in Hamilton (ON)—the McQuesten Urban Farm. It was built to address the food security concerns of an east-end neighbourhood in the city and is operated by a combination of paid farmers and local volunteers. Ultimately, the goal of this urban agricultural project is to act as a sustainable and affordable alternative to mainstream grocery stores.
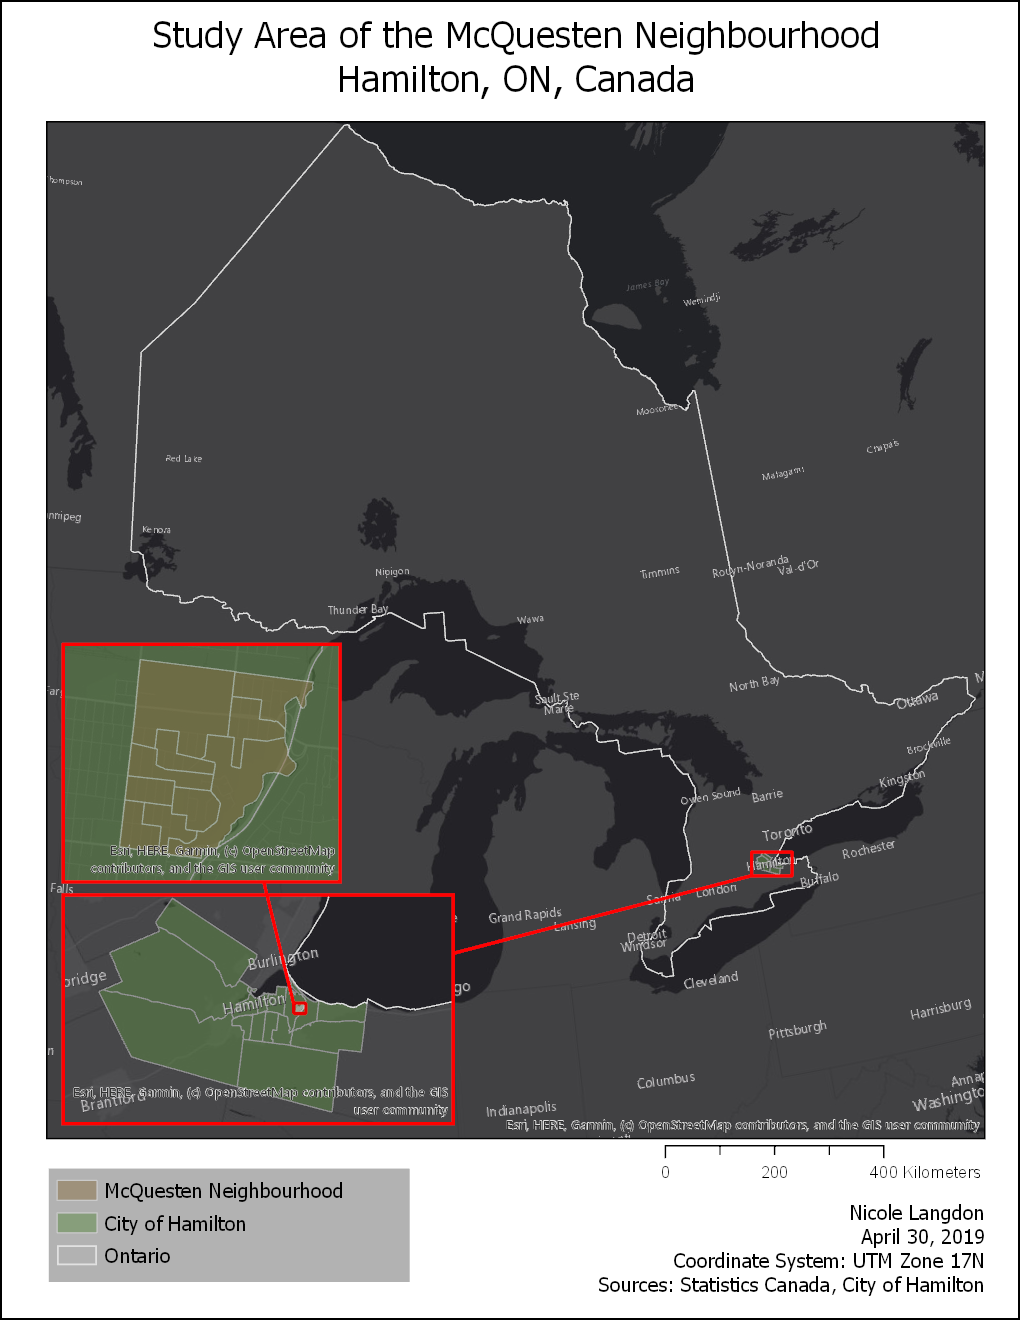
My interest in the Farm was equal parts personal and academic—I am a long-time resident of the McQuesten community and have worked on the Farm in past summers. I have also participated in some of the previous research conducted in the neighbourhood to assess the impact of the city’s Neighbourhood Action Strategy, of which the Farm is a part. However, although there have been numerous studies done in the community over the past five years, none of them collected any geographic data.
This is where my own research comes in!
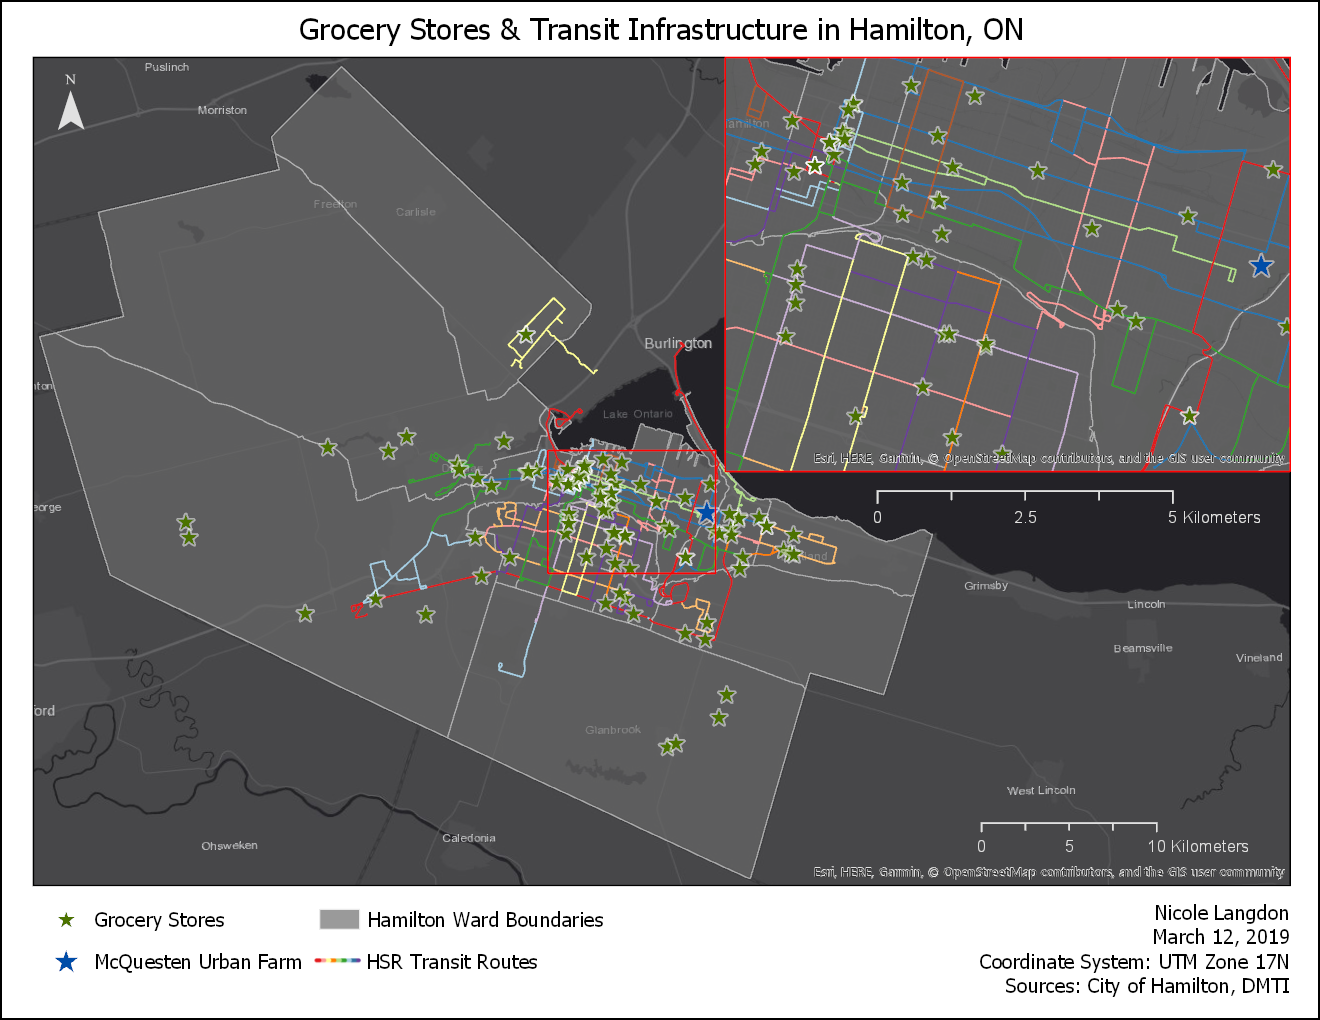
In order to get a better understanding of how the Urban Farm impacts the local food ecosystem, I first constructed a map of Hamilton’s grocery stores and any other places one could reasonably expect to purchase fresh fruit and vegetables. Bus routes were also included to see how well public transit coincided with the physical locations of fresh food. Data from DMTI were used to generate these points, and the line data for public transit were gathered from the City of Hamilton’s open access site. The Urban Farm is also represented here to give context.
Then, service areas were generated for each of the grocery stores. While the Urban Farm was indicated on the previous map, it is excluded in this portion of the analysis in order to compare Hamilton’s foodscape before and after the Farm’s construction.
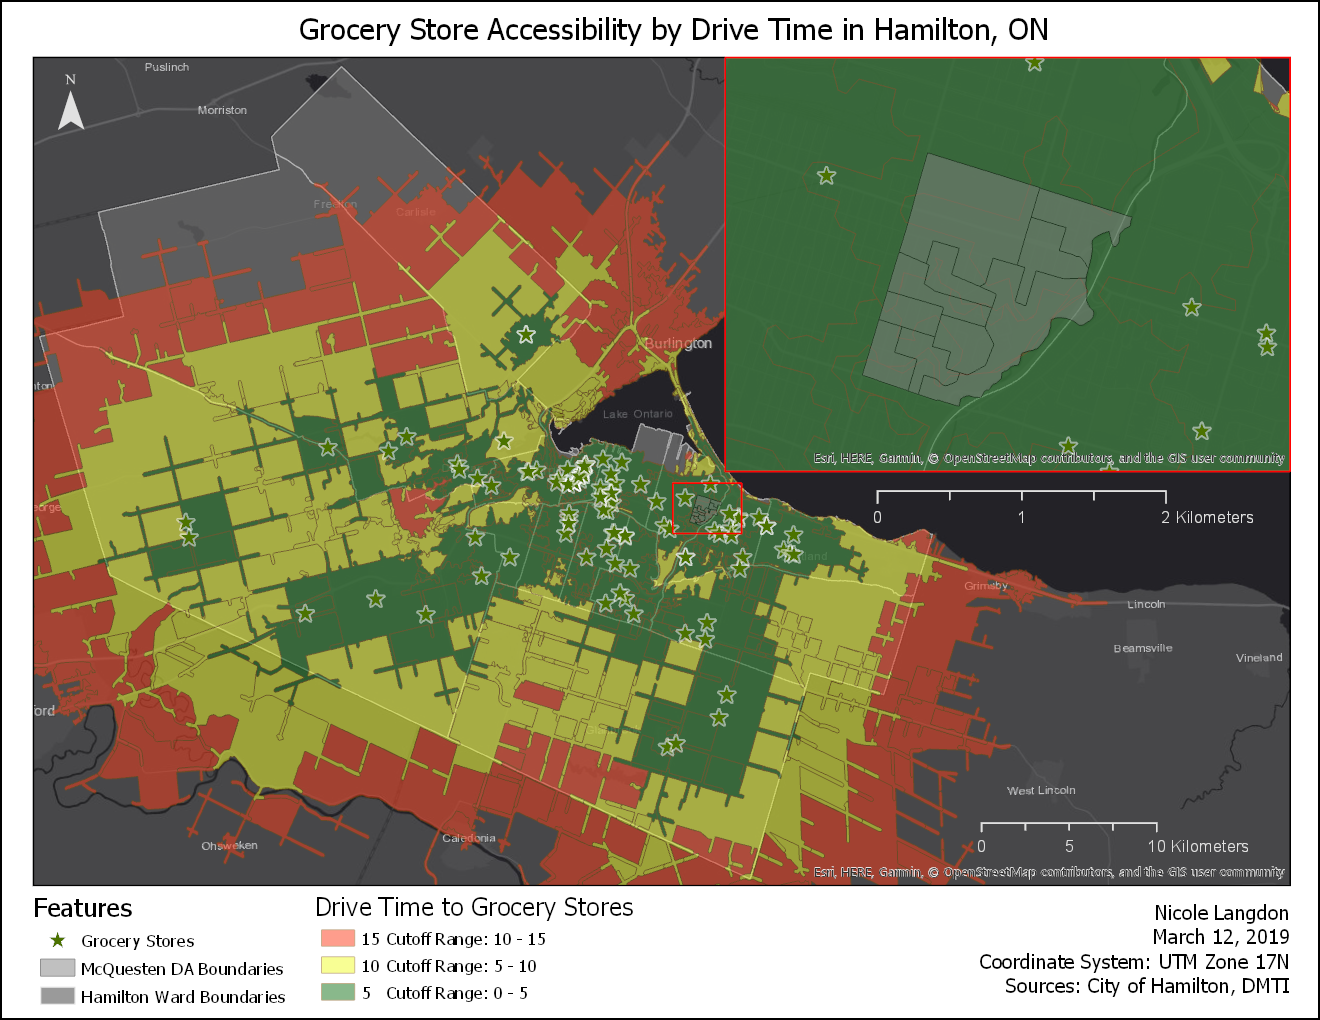
The green represents a five-minute drive time, the yellow a ten-minute drive time, and the red a fifteen-minute drive time. We can see from this map that McQuesten is well within a five-minute drive time to multiple grocery stores, yet it is still considered food insecure by the City of Hamilton. Why is this the case?
While data on vehicle ownership rates are not readily available in Canada, a proxy variable to approximate ownership was found using data from Environics Analytics. Average dollars per capita spent on a private vehicle over a one-year period was gathered for each dissemination area in McQuesten.
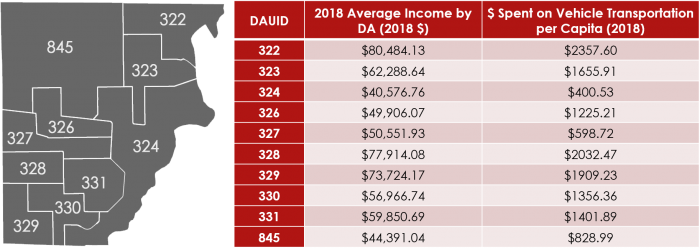
Three DAs spent under a thousand dollars per person in a one-year period, and even the highest-spending DA (322) still spent relatively little on a car. While this is not directly indicative of how many people own vehicles in McQuesten, it is reasonable to assume that ownership is likely low.
With that in mind, I then mapped out how long it would take for McQuesten residents to walk to the nearest grocery store using an Origin-Destination Cost Matrix. Looking back at Figure 2, we can see that there are no major bus routes that go into the interior of McQuesten, and so for many people, the only option is to either walk or pay for a taxi—which, for low income families, is prohibitively expensive on a regular basis.
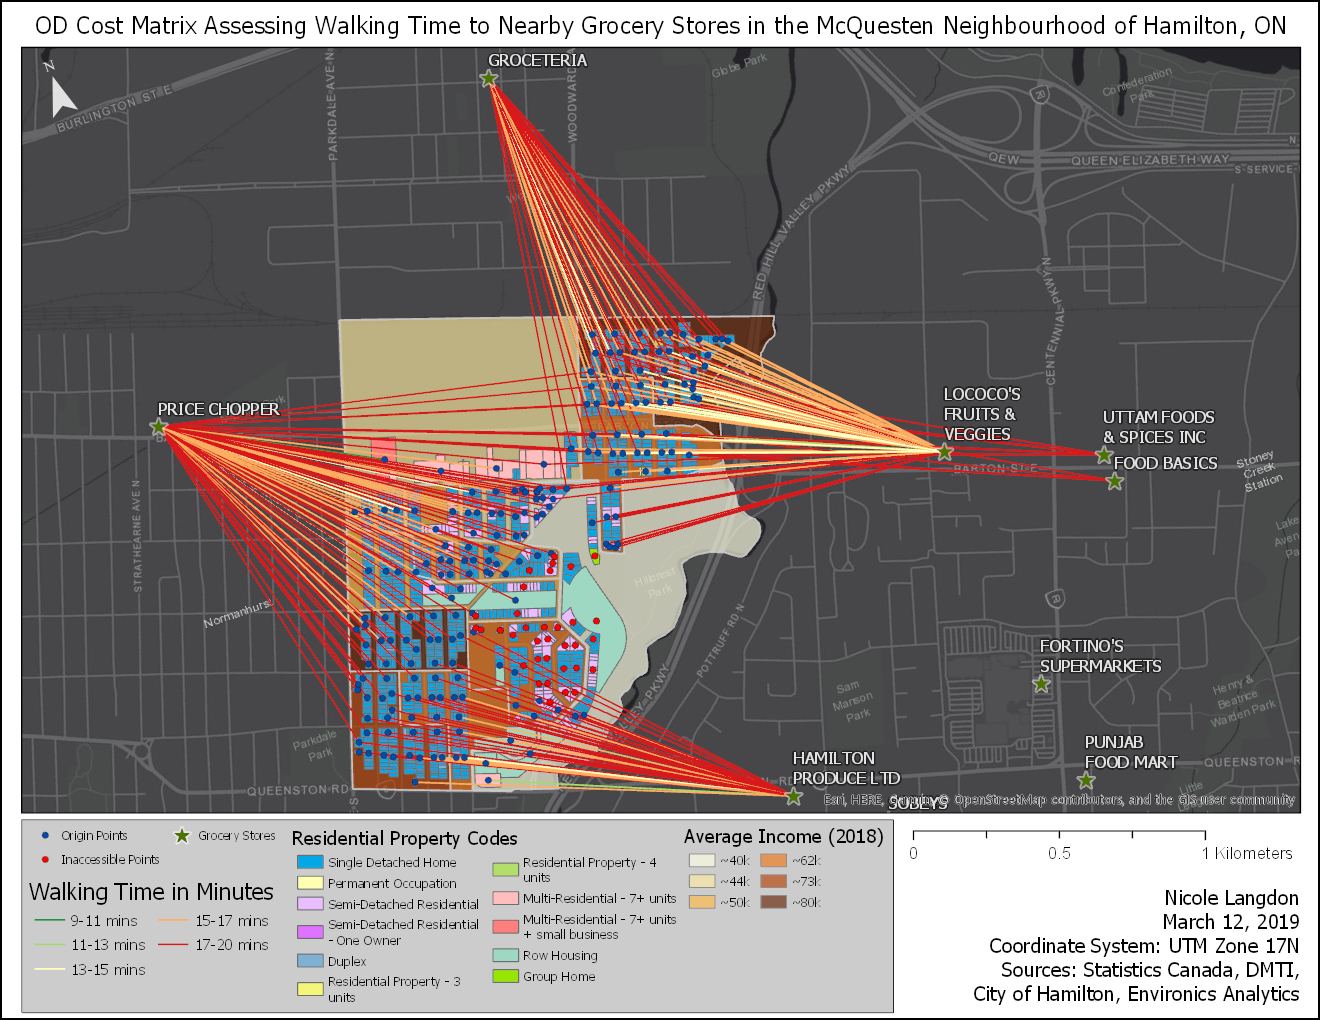
The average walking distance for the entire neighbourhood was ~14 minutes one-way, and many blocks in McQuesten have no grocery store within a twenty-minute one-way walk, which are indicated with a red dot.
As you can see, some of those dots are in DA 324 & 327, which we saw in Figure 4 had low median incomes and low spending on a private vehicle. This means that people in the poorest parts of the neighbourhood with little or no access to a car or public transit also have the furthest to walk if they need to go grocery shopping.
So how does the Farm impact this landscape?

Conducting the same OD Cost Matrix analysis on the Farm, we see a much more hopeful picture. Average walking distance has been cut down to ~9 minutes, and most significantly, those previously the furthest from a grocery store are now the closest to the Urban Farm, with many having to walk less than two minutes to get there! While this analysis was done after the Farm was already built, future urban agricultural projects in the city can utilize this analysis to plan for other locations.
Now, more work must be done in order to capture the full scope of McQuesten’s food insecurity issues. Walk time assumes a lot about the resident—mainly that they are able-bodied, unencumbered by a stroller or mobility device, and that they are always taking the shortest path to get to their destination—and the relative price of each grocery store was not a factor in this analysis. My aim with this project was to make up for the lack of geographic data in past research, and hopefully to combine the spatial analysis done here with the qualitative data collected before (that is again, however, difficult to do, given that all data in previous research are not tied to postal codes). More research must be done that combines the qualitative data collected in surveys with the spatial data used here. Hopefully McQuesten proves itself to be a sustainable form of food security, and we see more wonderful urban agriculture projects pop up across Canada!