
Heather McGrath, Graduate Studies Summary
Heather McGrath is featured in this spotlight article, as a graduate student participating in the ECCE program at UNB since 2015. She recently participated as a member of UNB’s team in the latest ECCE App Challenge. Below, Heather shares her experiences working with GIS during her studies at UNB.
Over the past few years as a graduate student in the Geodesy and Geomatics Engineering Department at the University of New Brunswick, I’ve had the opportunity to work on several GIS projects which utilized many of Esri’s products – desktop and web-based, as well as open source applications and programming. The following summarizes some of these:
Hazus: Amalgamation of Data using Model Builder
I began with a review and understanding of Hazus Canada. Hazus is a GIS based quantitative risk assessment and decision support tool for natural hazard risk mitigation and emergency management, developed in the U.S by the Federal Emergency Management Agency (FEMA) and adopted for use in Canada. Hazus Canada is compatible with ArcGIS 10.0. Specifically, I was looking at the Flood Model.
This program comes with a National dataset, thus you can use it ‘out of the box’, but to generate better/more accurate results, uploading user defined data is recommended. The schema of the required data is very specific and data needs to match the fields, domains, etc. exactly to ensure a successful import. ArcGIS Model Builder was used to amalgamate datasets from local and provincial levels of government into a single, comprehensive dataset for flood loss estimation computations which matches the Hazus schema exactly. This project was presented as part of the Esri Canada 2015 GIS Scholarships, of which I was a winner. To view the Poster supporting this project, click: Model Builder Poster.
Towards Web-Based Flood Risk Assessment, Leveraging Open Data
The number of flood events has risen, as has the costs due to flood related damages in the past few decades. In order to better understand community exposure and vulnerability, decision makers need access to user-friendly tools. While Hazus has many advantages, I found a few disadvantages/limitations to it: (1) many GIS users are using a version newer than ArcMap 10.0, (2) a bit difficult to learn, (3) inability to generate a flood hazard. Therefore, I started to look to developing tools to compute flood hazard and assess risk using open-data and easy to use applications:
Risk Assessment in Excel: Utilizing Esri Maps for Office
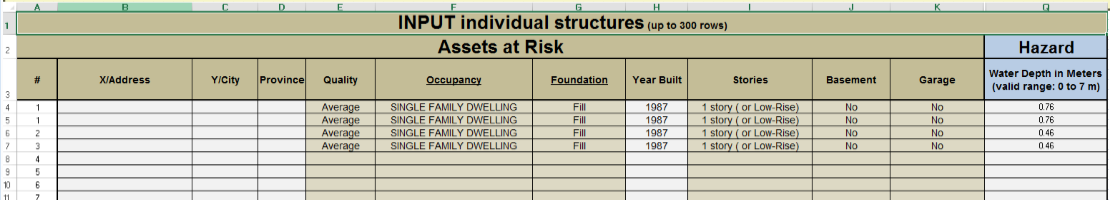
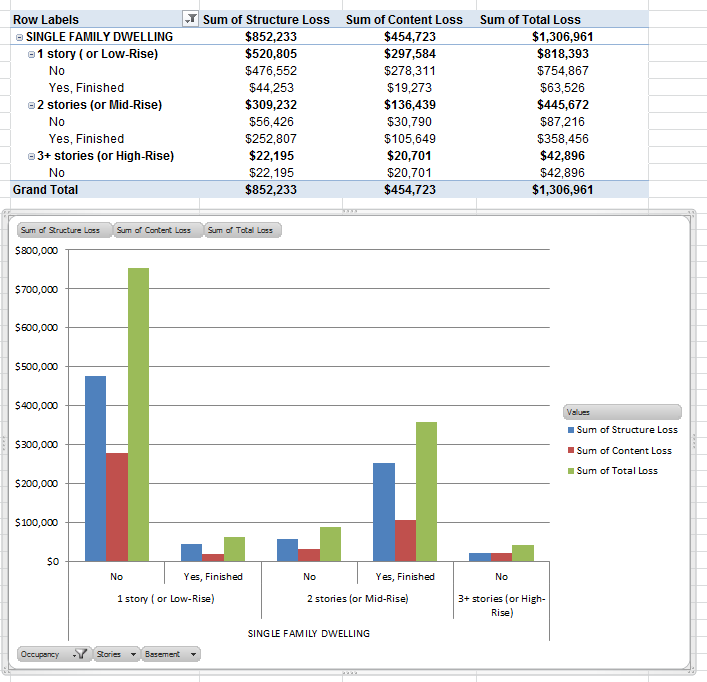
Using many of the underlying tables from Hazus, a user friendly Excel Worksheet was created which allows a user to input building details and a water level for estimation of building value and flood damage. If you want to download and try out the calculator, click here.
Inputs:
Outputs:
Simplified Flood Modeling
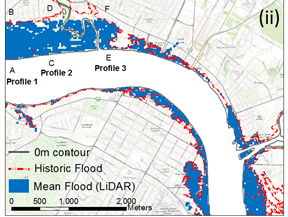
User friendly tools, which are built using Python, have been developed which utilize open source data including: elevation, delineation of watersheds, river bodies and flow channels, river gauges, intensity duration frequency curves, etc. These are accessed on-demand based on the user input location and flood scenario. A sample below shows an example of 5 river gauges, with water depth readings from max flood level of the 2008 flood in New Brunswick. These data have been interpolated via kriging to create a water surface. LiDAR digital elevation data are then subtracted from the water surface to identify those pixels which are flooded in this scenario. The digitized historic boundary is included for reference.
DEM Data: Using Elevation REST APIs
There are multiple providers of world-wide elevation data accessible through REST API services, including Esri, Google and Bing. The Esri dataset provides the most comprehensive metadata of these. A python script has been created which takes user input, in the form of a bounding box, requests the best resolution data available for a region and builds a DEM, and other derivative products such as slope and aspect maps as requested. One potential use of this elevation data is the ability to have a user digitize on-screen potential mitigation measures, such as sandbagging along a shoreline (to raise the shoreline) or other flood prevention strategies, and then re-build the DEM with these vertical adjustments. This modified DEM can then be input to the simplified flood models to recompute vulnerability.
Grand Lake Meadows – Open Source Web Mapping
Grand Lake Meadows (GLM) is a historically and ecologically significant wetland in New Brunswick. This area is known for its diverse ecology, abundant wildlife, system of freshwater rivers and lakes, rich soil and moderated climate. These are some of the reasons which may explain why human settlers have been attracted to GLM since the early 1600s. This research studied Grand Lake Meadows through the analysis of historical maps held at the Provincial Archives of New Brunswick. The map analysis aimed to uncover previously unknown societal and geomorphological information about the area. Maps from the study area were identified in collections of microfilm and microfiche and were digitally scanned, analyzed, and georeferenced. The digital versions have been posted on the Internet and made accessible through dynamic web-based map mashups using OpenLayers and Web Map Services. A series of supporting web pages were created to encourage site visitors to explore the GLM historical maps through a series of puzzles and quizzes created with Hypertext Preprocessor, JavaScript, and Scalable Vector Graphics. The website aims to support existing initiatives of the Grand Lake Meadows Project Management Committee, which promote awareness and the significance of this area and blend historical maps with present day mapping. Funding support for this research was provided by the Grand Lake Meadows Endowment Fund.