
ArcGIS in Hydrological Field Data Collection: Reflections on the 2022 Field Season
This post is an overview of our research lab’s recent usage of ArcGIS applications, specifically the mobile platform, in the collection of field hydrological data.
Our lab, the McMaster Ecohydrology Lab, has integrated ArcGIS in our field data collection since 2018 with the Collector App, and has since shifted to Field Maps in 2021 along with other upgrades. Here, I will discuss how its use, for our lab and my Ph.D research, has evolved over time.
As some background, our lab’s research largely revolves around peatlands which are wetlands that accumulate partially decayed organic matter as peat. Peatlands perform a number important functions such as water storage, carbon sequestration and habitat. Specifically, my work focuses on the hydrology of the peatlands found on the rock barrens landscape of the Boreal Shield, where peat forms in bedrock depressions.
Our preliminary use of the mobile ArcGIS applications in 2018 was simply as a replacement to handheld GPS units for navigation and taking coordinates of points of interest such as research sites – a kind of Google Maps for fieldwork. With the seasonal turnover among student research assistants in our line of work and a large number of research wetlands to learn, this has been invaluable from a safety and convenience perspective, as well helping to ensure we minimize our footprint on the landscape by avoiding bushwhacking.
From there, especially in 2021, Collector took on the role of cloud-based data sheets, wherein we created layers to support data collection of manual water level measurements, soil depth and vegetation surveys. While we continue to carry field notebooks, no longer having to carry around clipboards of datasheets that may get lost or wet has been just one of the benefits:
Data integrity: Assigned domains or certain ranges for data fields for things including water level, discharge, water chemistry and instrument status helps to ensure we collect the right kind of data that can be rapidly operationalized. At the end of the field day, collected data is backed up to the cloud via ArcGIS Online where it is shared among lab members to use the data or be made aware of equipment statuses. We can also see who collected each data point.
Spatiotemporal Context: Every data point we take can be timestamped and has geographic context based on your device’s GPS. The time aspect is useful to me directly as I am interested in the temporal dynamics of wetland water tables and it enables us to align manual measurements to calibrate our automated continuous ones. While the need to transcribe paper datasheets to spreadsheets has largely been eliminated, errors here and there are inevitable but can be cross-referenced with the spatiotemporal metadata to get them sorted out.
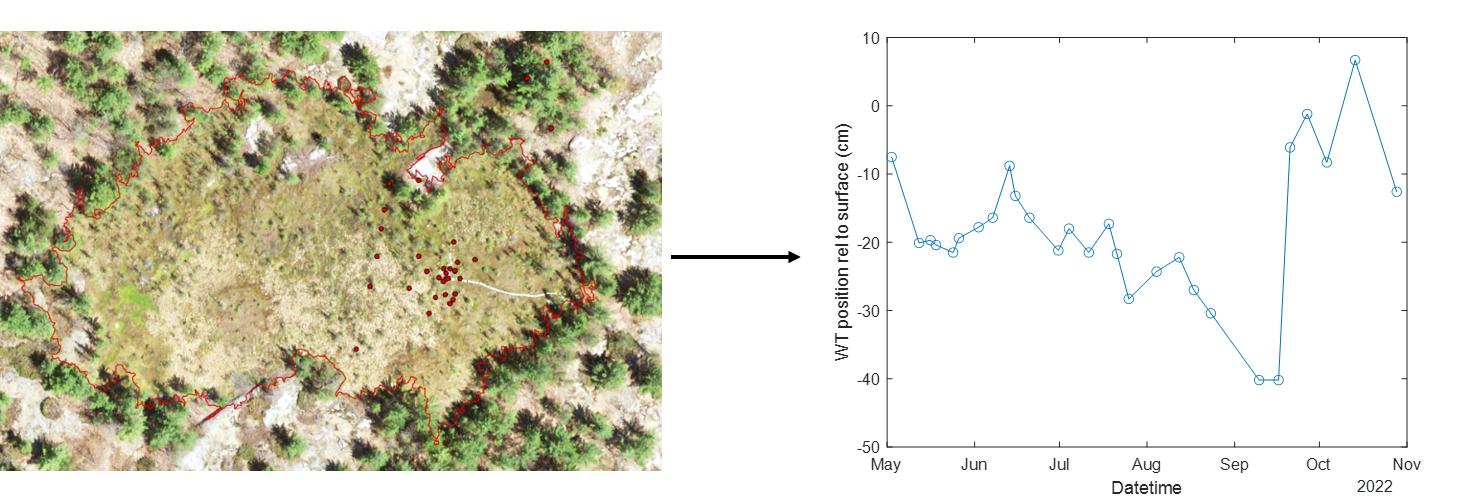
While the relatively low (~5m) accuracy of phone or tablet GPS if sufficient for providing spatial context to field collection and observations, it is not quite sufficient for mapping wetlands (or features therein) that can be as diminutive as a few meters across. We have combined ArcGIS Collector with an external GPS unit, the Juniper Geode (Juniper Systems Inc.) to record positions at sub-meter accuracy by pairing, via Bluetooth with a mobile device. The most basic mapping application is simple delineation of wetlands, which can often be tricky without on-the-ground knowledge from imagery alone but just requires a perimeter walk with Collector.

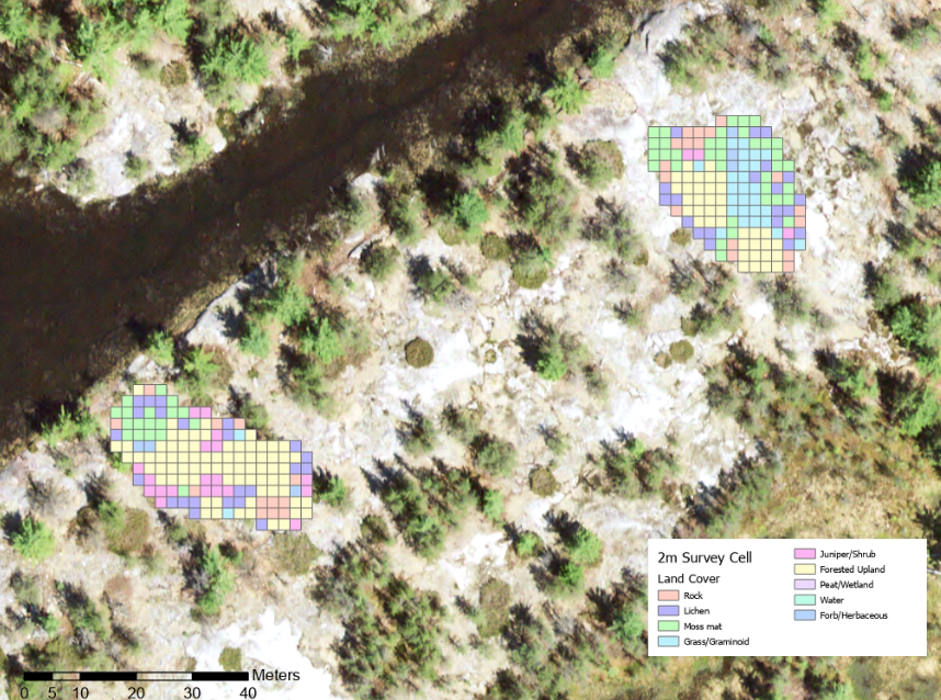
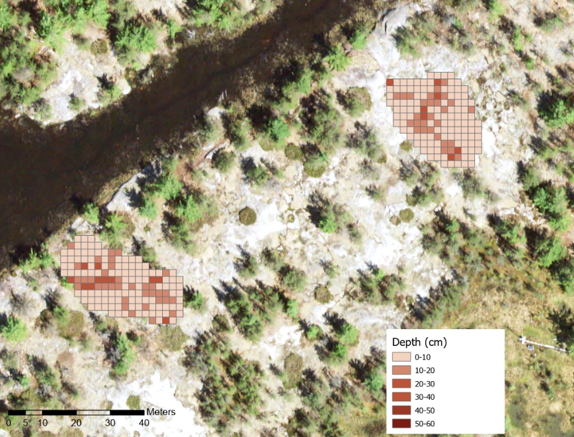
Moving to the upland rock barrens that make up the catchment areas that drain into wetlands, we used this high-accuracy GPS with Collector to conduct detailed surveys of hillslopes that we were to be instrumented for soil moisture in representative plots and channeled surface runoff into weirs for measurement. After delineating the micro-catchments contributing to this runoff, they were discretized into 2 x 2 meter cells for which the dominant land cover was classified and representative soil depths were measured. While these surveys were labour-intensive (>1000 cells), they informed where instrumentation should be located to be representative of the major land cover types and capture the storage in the bedrock depressions with appreciable soil depth. These characterizations will also inform further analysis on the effect of these mapped variables on the rainfall-runoff response and water storage in the rock barrens uplands that provide lateral run-in to wetlands.

This post mostly focused on the applications, in the form of field methods using the ArcGIS mobile platform but only scratches the surface of its potential. In future posts I hope to follow up with the resulting data and analysis from what we have collected in these and other ways.