Natural Asset Management Plan (NAMP) of Georgian Bay Mnidoo Gamii Biosphere: Data Gap Analysis
This work is part of an ongoing project conducted in collaboration with the Georgian Bay Mnidoo Gamii Biosphere (GBB) alongside Dr. Brandon Van Huizen and Dr. Chantel Markle of University of Waterloo and my supervisor Dr. Mike Waddington.
Background
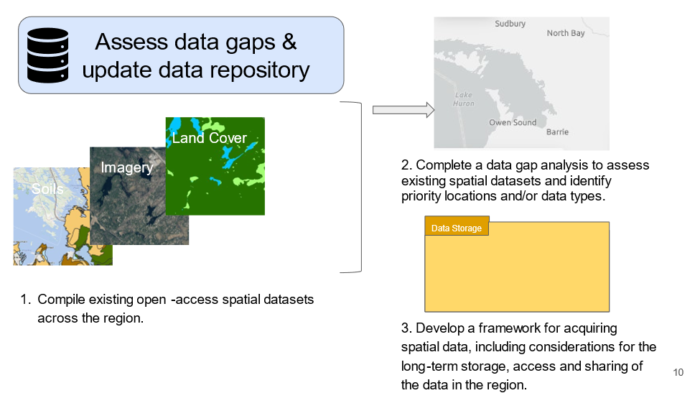
The Georgian Bay Mnidoo Gamii Biosphere (GBB) spans 175 km of the eastern coast and freshwater archipelago of Georgian Bay, Ontario, Canada. It supports a rich diversity of wildlife, particularly reptiles, that includes over 50 species at risk which has led to its designation as a UNESCO biosphere since 2004. However, it has recently faced increasing pressure from land use changes from infrastructure development and climate-mediated disturbances such increased risk of wildfire under warmer and drier conditions. This has spurred the GBB to spearhead a NAMP project to support planning, research, and land/wildlife management in the region, with a main objective being to take inventory of habitats. The first step towards this a data gap analysis of existing datasets available across the region (Figure 1).

Before proceeding, it was essential to define the ‘region’ or ‘study area’ that we would use to constrain our search and analysis. This required consideration of both natural and administrative boundaries to avoid partial coverage for municipal planners who may utilize this information. The former was defined by Ecodistrict 5E-7 (Parry Sound) (Ontario GeoHub, 2021), which was extended based on the extents of intersecting lower tier municipalities of the West Parry Sound District (Figure 2), which employed the Union tool in ArcGIS Pro.

Data Search
Our initial search for geospatial datasets applicable to the study area focused on the public repositories of the Ontario provincial and Canadian federal governments such as MNRF and NRCAN, along with open data published from academic papers. This resulted in a collection of 57 datasets that we sorted into 12 themes including imagery, flora, fauna and land use. Each dataset was evaluated based on what (format, theme), when (how recently, frequently updated) and where (resolution, % coverage of study area) (Figure 3). Format, or data type described whether we were dealing with raster or vector data, and the type of the latter (point, line, polygon). Resolution describes the cell size of datasets of the former (raster) format, which is crucial for moving forward to determine the minimum size of habitat or feature that the dataset can describe. The ‘when’ is important because to be useful for practitioners, the data should be up to date. We downloaded nearly all the datasets to cloud storage to be readily available for visualization and analysis, exceeding a terabyte largely as a result of the high-resolution imagery and Lidar datasets discussed later. Those excluded were datasets already hosted on platforms such as Google Earth Engine where there was no need to re-host and the broad extents (typically Canada-wide and multi-year) made it impractical. These were made available simply as links, as was also done for the other datasets if one wished to view the source data and metadata.

Gap Analysis: Methodology and Results
To evaluate the Study Area Coverage (%) of each dataset, the approach slightly varied depending on the format. Raster and continuous vector datasets (such as land use, land cover), were simply clipped to the study area and the Tabulate Intersection tool was used to calculate the percent coverage. For vector datasets that represent features that by nature are not continuous such as roads and wildfire extents, their extents were derived from the Minimum Bounding Geometry before being evaluated in the same way. This resulted in a wide range of coverages, from 4 to 100%, where typically those on the lower end were these feature-based datasets and those that were geared towards a specific area such as a single municipality.
To get an overview of data coverage across the region, we layered datasets that were continuous by nature and quantified what percent of the 15 can be found at each pixel. This ranged from 10/15 (66.7%) along the shoreline and among near-shore islands to 15/15 (100%) at the southern end, with most of the study area having 14/15 (93.3%) coverage (Figure 4).
Data Combinations: A Mixed Bag
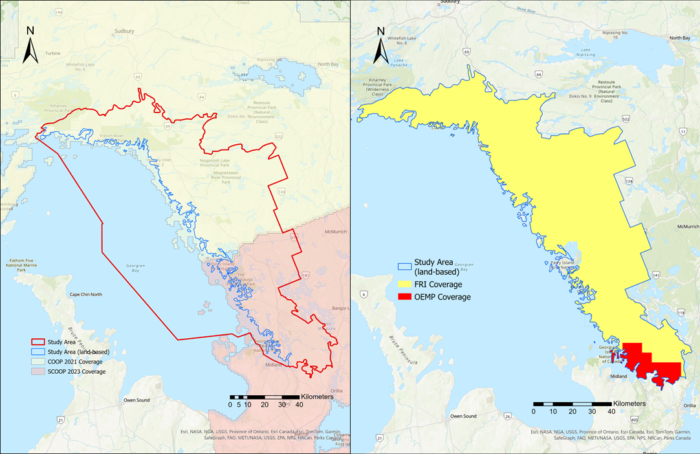
There were two types of primary datasets that had to be combined to properly evaluate their coverage across the region due to the way they were collected; orthophotography and lidar. The orthophotography is leaf-off aerial imagery collected by the province approximately every five years region-by-region and is comprised of the Central Ontario Orthophotography Project (COOP) (Ontario GeoHub, 2022) collected in 2021 and South-Central Ontario Orthophotography Project (SCOOP) (Ontario GeoHub, 2024) collected in 2023. These combined for complete coverage of the region, at least for the land (Figure 5). Acquisition of the thousands of tiles of sub-meter resolution RGBNIR imagery was facilitated through Scholars Geoportal by the Sherman Centre at the McMaster University Library.
On the other hand, lidar was collected among the region in two separate projects, the Forest Resource Inventory (FRI) (Ontario GeoHub, 2024) and Ontario Elevation Mapping Program (OEMP) (Ontario GeoHub, 2024). The FRI, collected during leaf-on conditions for the purpose of capturing forest structure, was collected in 2019 and 2021 and achieving 93.1% coverage of the study area. The OEMP was collected in 2021 in leaf-off conditions for the purposes of terrain and flood-risk mapping and filled in 4.6% of the remaining study area to reach just under 98% combined (Figure 5). While there were some areas of overlap between the FRI and OEMP in the northern and southern sections of the study area, we deferred to the FRI in those cases given it already comprises the vast majority of the coverage. For the sake of data storage and practicality, these datasets were procured in their derived raster formats; digital terrain model (DTM), digital surface model (DSM) and canopy height model (CHM).

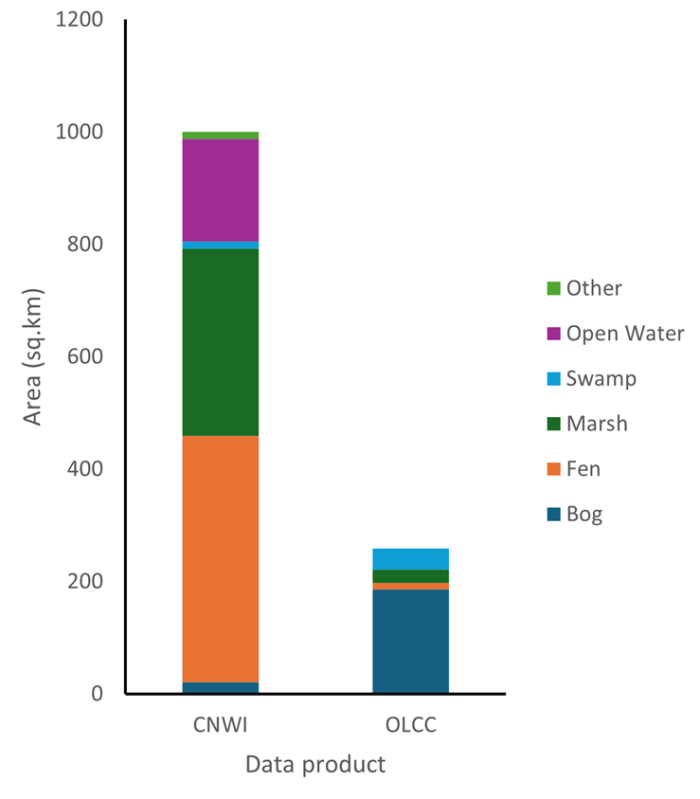
While there remain some concerns and limitations with harmonizing the prior datasets due to differences in collection, this was more pronounced in derived datasets of land cover. We evaluated the current state of wetland mapping products, given their significance as habitat for many of the Species at Risk found in the Georgian Bay region. The first was the Canadian National Wetlands Inventory (CNWI) (ECCC, 2024), a national database that currently combines 13 source datasets from seven provinces/territories that delineates wetlands as polygons across five major classes and eight subclasses. The second was the Ontario Land Cover Compilation (OLCC) that combines three provincial land cover databases into a 15 meter resolution raster product. While the OLCC is a more general land cover product, it contains wetland classes equivalent to the major classes of the CNWI. When we compared these products within the GBB, we found that the CNWI mapped over three times as much wetland area as the OLCC and a different breakdown of wetland types, with there being greater representation of fens and marshes in the CNWI compared to predominantly bogs represented by the OLCC (Figure 6). These discrepancies highlight the need for a more accurate and up to date habitat mapping product as part of this NAMP.

Next steps
Given the high resolution of some of the raster datasets spanning over 7500 km2, there are considerable storage needs associated with a data repository for the GBB, which needs to be addressed in concert with how the data is to be shared and disseminated with partners and the public (Step 3 of Figure 1). Currently, the most likely solution is an ArcGIS Enterprise server to host the data and allow integration with GIS applications but will be part of ongoing dialogue with the needs of partners and interested parties.
In the next phase of this NAMP project, we have taken some of the most current and high coverage datasets towards developing a land cover mapping process for the region that aims to be open, accurate and sufficiently precise.
References
Environment and Climate Change Canada (2024). Canadian National Wetlands Inventory. https://open.canada.ca/data/en/dataset/d5af4ac5-ebdb-4645-bb0a-8ec5cac5e29f
Ontario GeoHub (2021). Ecodistrict. https://geohub.lio.gov.on.ca/datasets/lio::ecodistrict/about
Ontario GeoHub (2022). Central Ontario Orthophotography Project (COOP) 2021 – 1km Index. https://geohub.lio.gov.on.ca/datasets/lio::central-ontario-orthophotography-project-coop-2021-1km-index/about
Ontario GeoHub (2023). Ontario Land Cover Compilation v.2.0. https://geohub.lio.gov.on.ca/documents/7aa998fdf100434da27a41f1c637382c/about
Ontario GeoHub (2024). Ontario Elevation Mapping Program. https://geohub.lio.gov.on.ca/pages/ontario-elevation-mapping-program
Ontario GeoHub (2024). Ontario Forest Resources Inventory. https://geohub.lio.gov.on.ca/pages/forest-resources-inventory
Ontario GeoHub (2024). South Central Ontario Orthophotography Project (SCOOP) 2023 – 1km Index. https://geohub.lio.gov.on.ca/maps/5ce3ba3176564c46969f064453742f1a/about

