
Creating websites using ArcGIS Hub: Atlas of Coastal Wetlands in Georgian Bay
ArcGIS Hub was used to create our interactive Atlas of Coastal Wetlands in Georgian Bay. For an ecology lab without any programmers or web design specialists, we published an interactive atlas (that is mostly under construction) to present and share qualitative, quantitative, and geographic data collected, published papers, photos and videos of sampling sites, and more.
Using ArcGIS Hub, we were able to centralize a variety of data types into one website to share with the public, students, and volunteers. The home page of the atlas is called Atlas of Coastal Wetlands, Georgian Bay. We currently have 8 pages plus 2 more that are redirected pages:
- Wetlands: The digitized coastal wetlands of Georgian Bay (GB) and how wetlands are categorized and defined.
- Fish and Wildlife: Fish, turtle, amphibian, and other wildlife datasheets, images, videos, and how it is used as an indicator for wetlands (WFI).
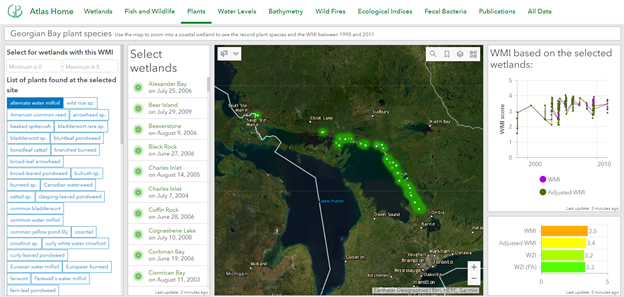
- Plants: Submersed, emergent, and floating vegetation recorded at the sampling sites, and how they were used as an indicator for wetlands (WMI).
- Water Levels: Detailed records of water levels of Lake Huron (the lake that GB is hydrologically connected to) over the decades and explanations about how it affects or may be affecting wetlands.
- Bathymetry: Uploaded data on the depth, area, and volume of the coastal wetlands.
- Wildfires: Addressing the impact of wildfires on wetland health using remote sensing and GIS.
- Ecological Indices: Includes how the ecological indices, WQI (water), WFI (fish), and WMI (plants) can be used for the indication of water quality, as well as the calculated indices for hundreds of sampled wetlands.
- Fecal Bacteria: Recorded fecal bacterial CFU (colony forming units) in the Township of Georgian Bay over the past decade.
- Redirects to publications uploaded on the Great Lakes Wetland website (created by Dr. Patricia Chow-Fraser and lab and team).
- Redirects to all data uploaded on the Hub.
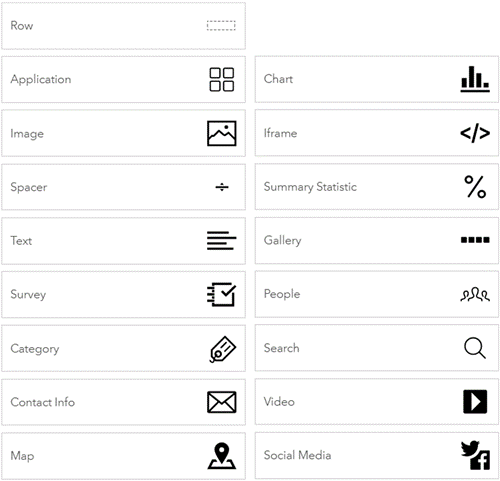
Within them, I used many layout features, such as incorporating an interactive map (as an application), images, text, category, contact info, iframe, gallery, and the search tool.
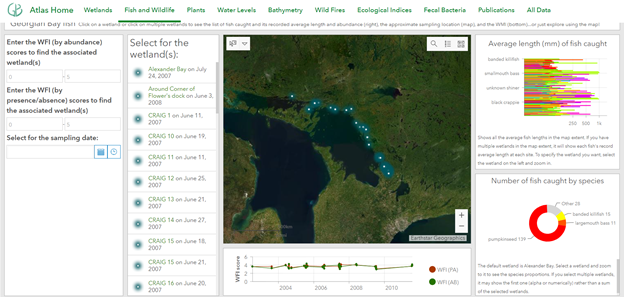
Including an application was useful for inserting maps to include functions such as showing the legend, changing basements, or searching for locations. Using the layout feature “Map” would display a map without any functions except for exploring the map. I also used the application layout item to include dashboards I created for displaying wetland water quality status based on fish (WFI) as well as wetland water quality status based on plants (WMI) for all wetlands sampled during the low water level period of GB (1992 through 2011). These dashboards allow the user to select the wetland of interest to see the calculated WFI or WMI score. Users can also select multiple wetlands and see the average scores. From zooming into the specific wetland, a list of recorded fish or plants will be displayed on the left (plants dashboard) or right (fish dashboard). These applications are still under construction to become more user friendly. If you have interest or questions from playing with the dashboards and want to send me feedback, I would appreciate that very much (contact).
Category is a useful layout item for creating large buttons (image + title) for a long list of content types including but not limited to datasets, pages, maps, documents, apps, and dashboards. For example, I included a category layout which only included datasets (such as Shapefiles) with the tag of ‘wetlands’. I used the thumbnail of the datasets (which is not always the best representation) though it is possible to substitute with different images instead.

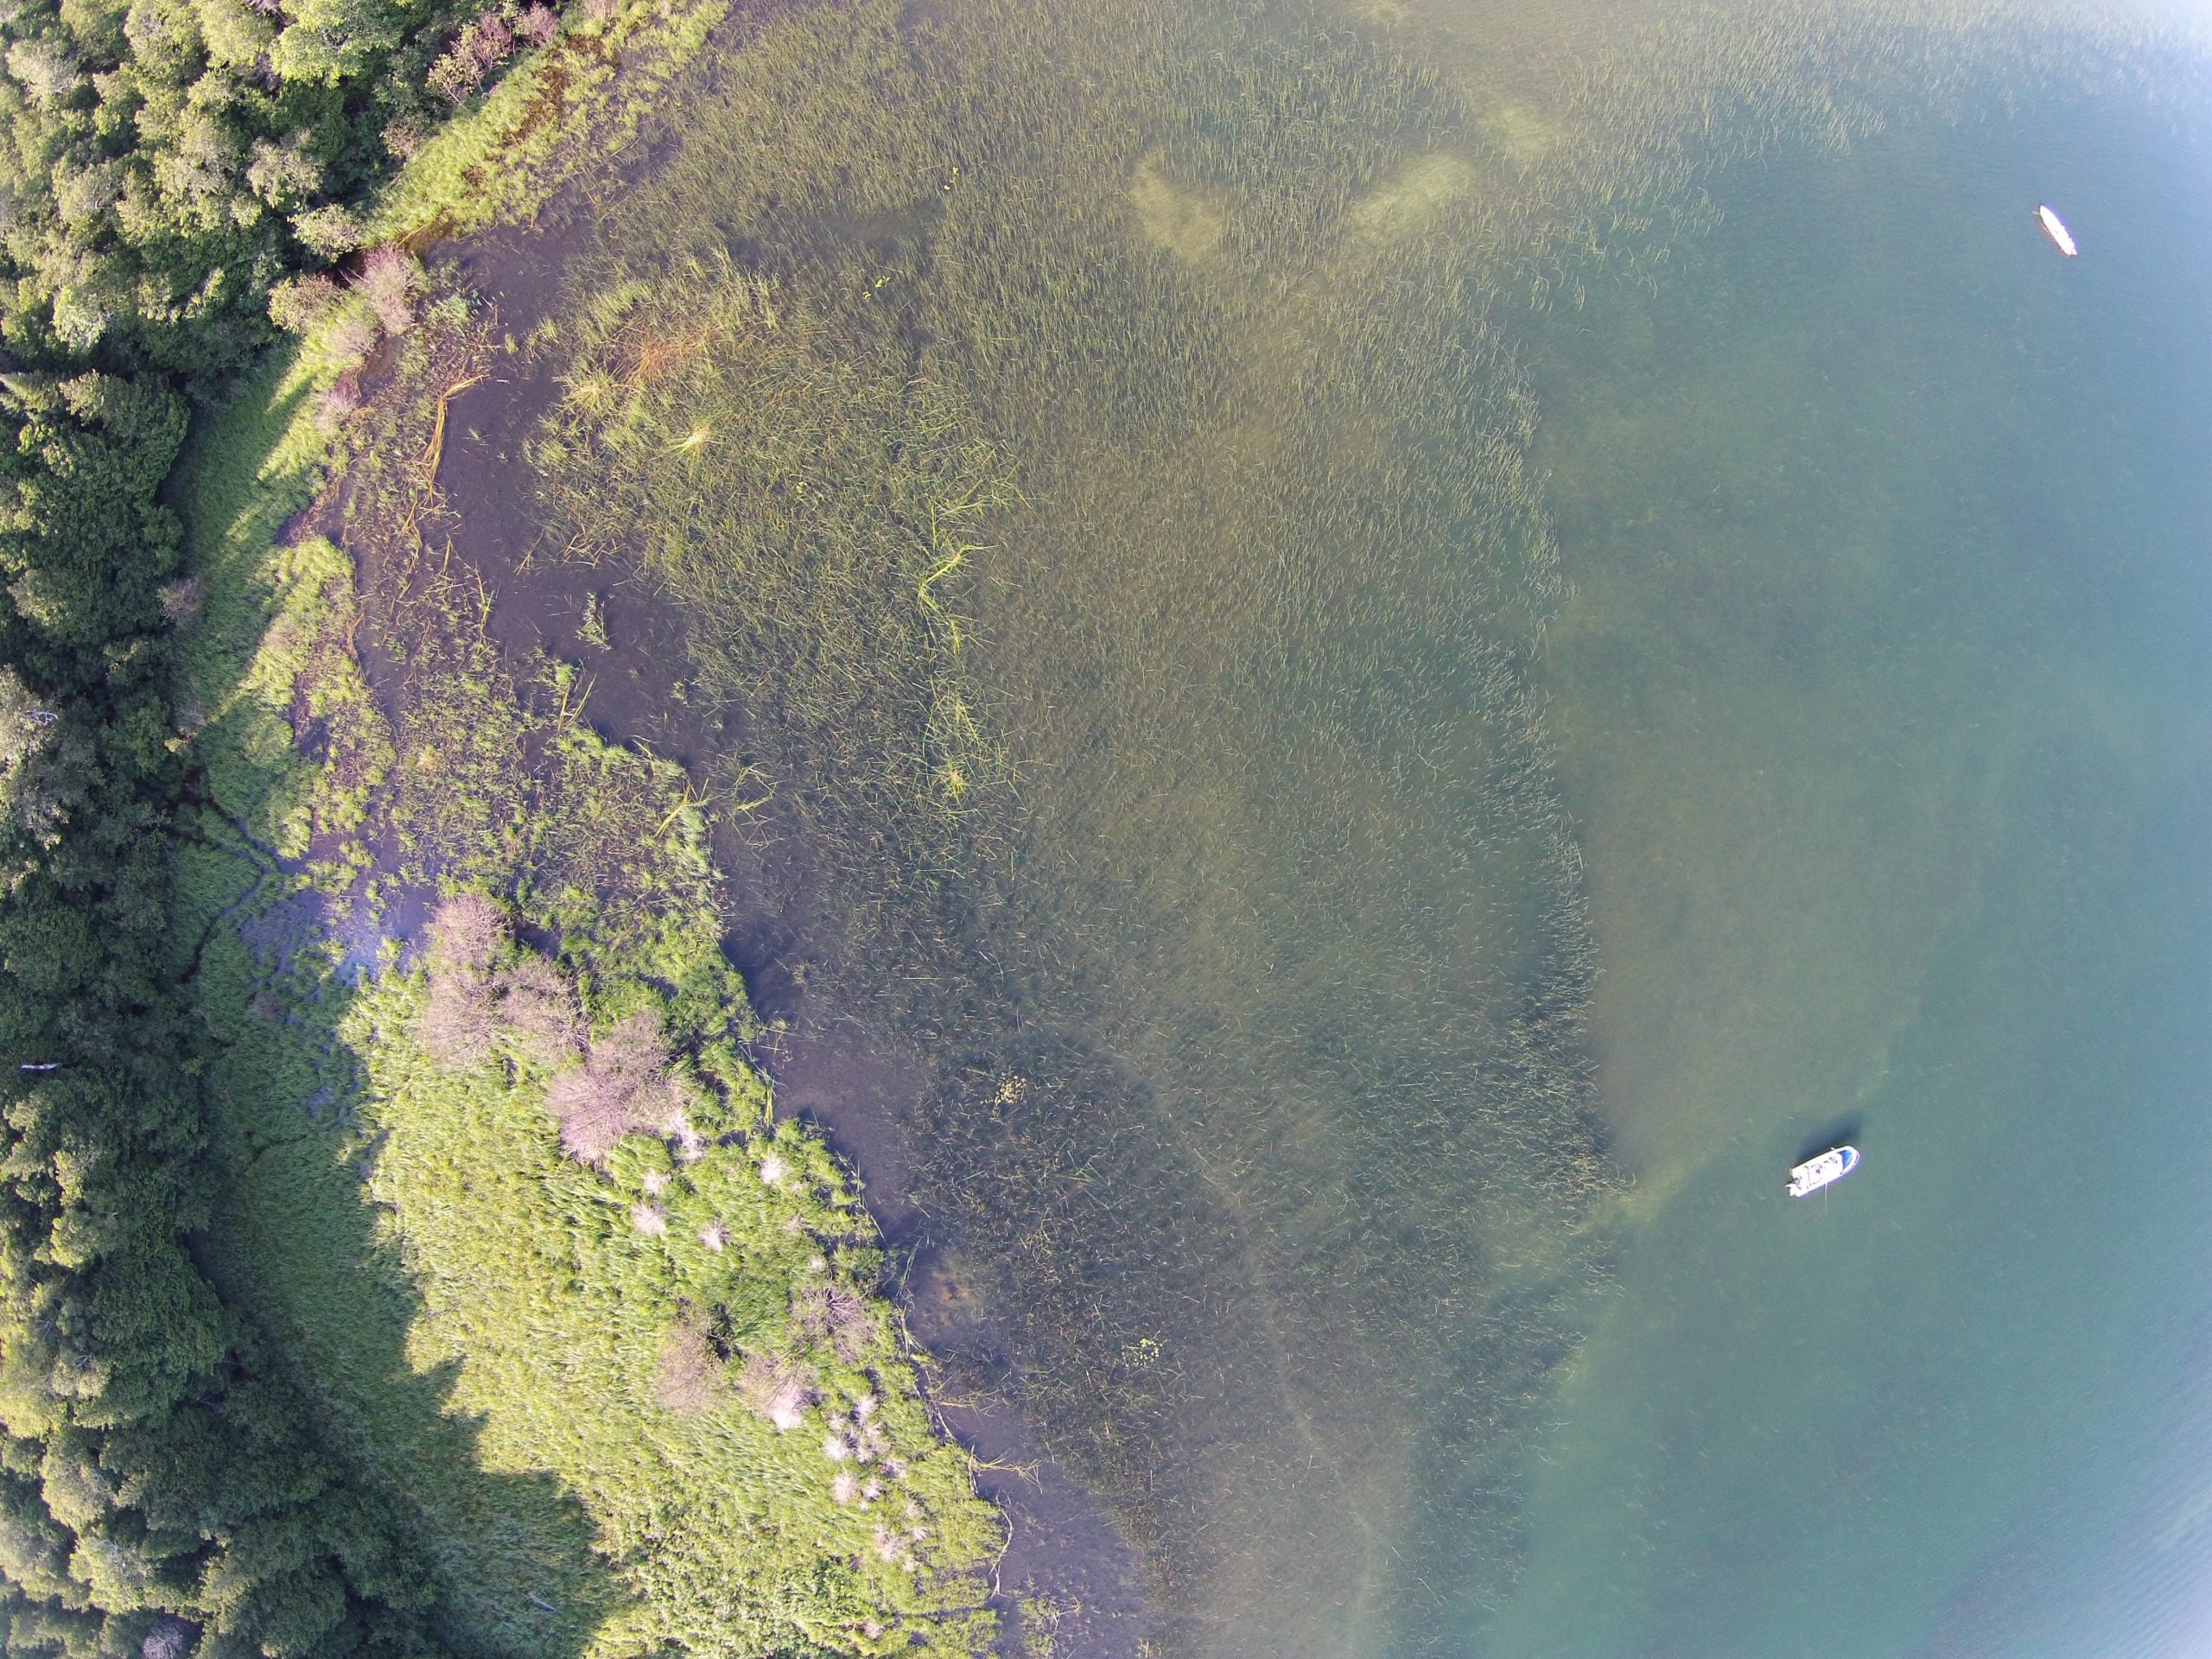
Lastly, I used an Iframe element for the Atlas. An Iframe is very simple. It requires a URL for a webpage that will displayed in its content, with a specified width and and height for the display area. I used it to include a slideshow of some assorted field photos, including a young muskie we caught in a seine net.

Overall, ArcGIS Hub enabled our lab to present more than just our geographical data in a concise and organized format. We also were able to upload many types of other data. I hope that this post sheds a bit of light on the practicality of using ArcGIS Hub and inspires others to navigate this playground themselves. The Atlas will be upgraded continuously, and we would appreciate all types of feedback (contact).