
Motor Vehicle-Cyclist Collisions in the City of Toronto
With the gradual increase in environmental, economic and public health problems from the growing global community that uses motorized vehicles as their primary source of transportation, there has been a large interest in the use of bicycles as an alternative form of transportation. Despite the benefits of cycling, studies have shown that people are discouraged from cycling or are unwilling to cycle due to traffic safety concerns like motor vehicle volume, traffic speed across a network, roadway conditions, and motor vehicle behavior. Almost 0.6 million fatalities in road traffic accidents in the world each year are between motor vehicles and cyclists. A major objective in the field of bicycle transportation planning is to simulate increased use of bicycles for routine trips without increasing the number of cycling injuries and collisions.
As a course project for GEOG 4GA3: Spatial Statistics offered at McMaster University, I attempted to use point pattern analysis to asses whether motor vehicle-cyclist collisions in the City of Toronto are random or non-random, interpret regions of higher and lower collision rates and the cause of collisions. Statistical techniques employed to asses the hypothesis included a quadrat analysis map, kernel density estimate, Clark-Evans test, F- and K-function and a linear model fit using ArcGIS Pro, RStudio and JMP statistical software.
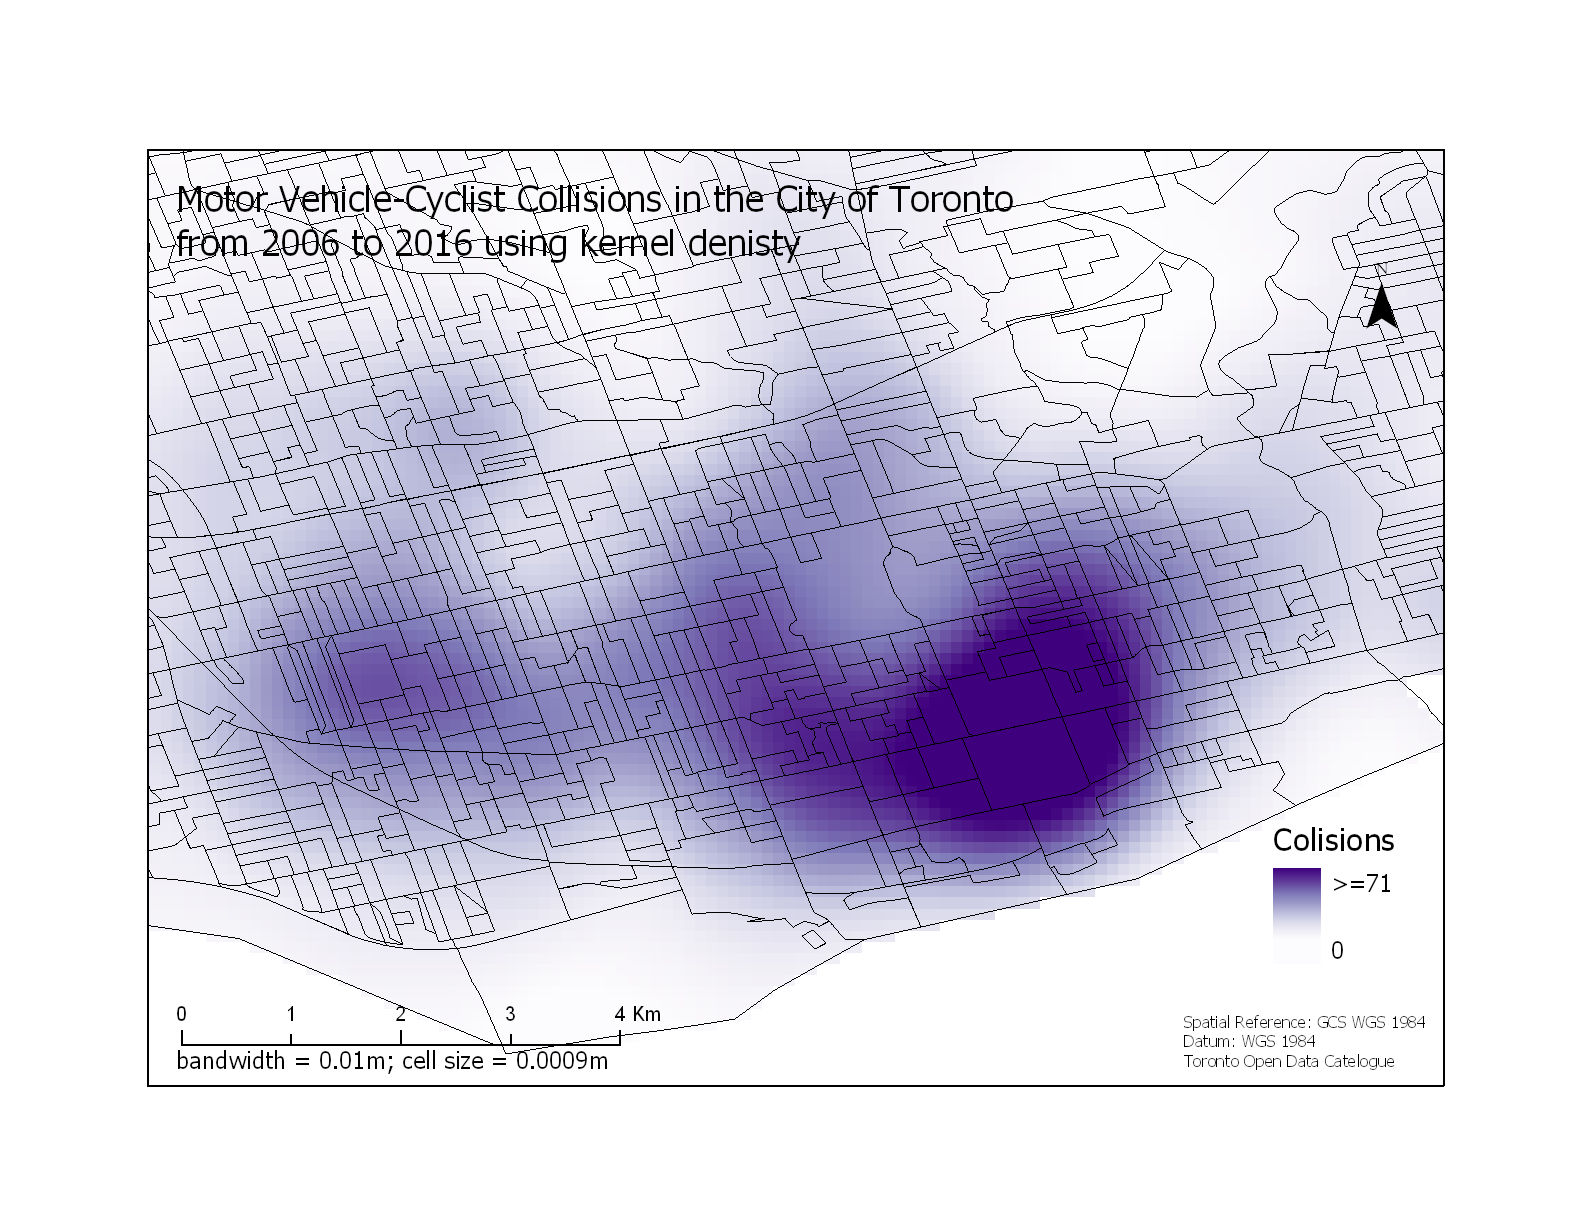
According to the kernel density estimate, a majority of motor vehicle-cyclist collisions from 2006 to 2016 occur in the downtown core. The greatest number of collisions occur across Toronto’s Financial District, Shopping District, especially the streets that run parallel and perpendicular to Toronto’s Eaton Centre, and Entertainment District, specifically Nathan Phillips Square.
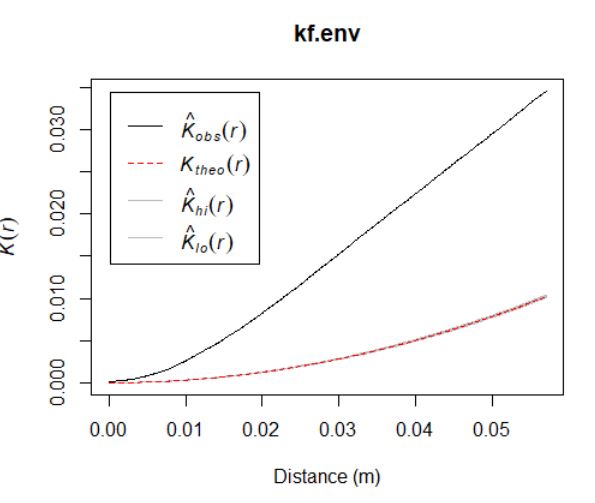
The K-function suggests that motor vehicle-cyclist collisions appear to be clustered since the values of the empirical function are greater than the theoretical function at all distance scales. This implies that motor vehicle-cyclist collisions occur closer together than what would be expected with a null landscape making this evidence for non-random, clustering of collisions in the City of Toronto. The general linear model fit summary identifies the time of day variable as the most significant independent variable in the data-set that affects the rate of motor vehicle-cyclist collisions. With a p-value of 0.0003, collisions occur more often at night than during the day in the City of Toronto.
Downtown Toronto has the highest population density in Canada. Being the center of Toronto’s financial, entertainment, shopping and tourism district, downtown Toronto is busy, compact and full of life. With constant traffic plugging arterial roads like Bay, King, Young, Queen, Dundas and College, many Torontonians that commute within the downtown core do prefer to cycle to save money and time. With increased levels of cyclists on the arterial roads, the likelihood of motor vehicle-cycist collisions is a lot greater opposed to other ends of the city, like Etobicoke, York and Scarborough. Because a majority of the collisions occur at night, opposed to the day, the City of Toronto needs to improve the safety of cyclists by addressing environmental and individual factors. Environmental factors include making more bike lanes, creating a stricter divide between cyclist and motor vehicles and improving light fixtures in the downtown core. Individual factors include rules that force cyclists to wear glow-in-the-dark safety vests after dusk and the right education for both the drivers of motor vehicles and cyclists so that each party understands how to share the road. By addressing such issues, the City of Toronto can create a transportation network that ensures the safety of all types of drivers.