
Scripting multi-criteria decision analysis
Background
My first foray into GIS above the introductory level was a raster-based course instructed by Patrick Deluca here at McMaster University. Among the work assigned for the course was a final project focused around multi-criteria decision analysis (MCDA), a process described by Voogd as to ‘investigate a number of choice possibilities in the light of multiple criteria and conflicting objectives’. MCDA is not inherently coupled to GIS or spatial problems, it is a set of analytical techniques that can be utilized in making an informed choice on a decision of any type (in theory, at least). The more qualitative the criteria however, the less suitable the analytical process of MCDA is in making a decision. GIS and spatial data being quantitatively oriented to the degree which they are lends well to the coupling of GIS techniques with MCDA in order to make informed spatial decisions, such as where to locate a facility, or where best to conduct a particular activity.
The decision I investigated in my course project was the locating of a hot mix asphalt plant within Grey County, Ontario. This was at the time a real problem faced by the community of Grey Highlands (one of seven municipalities in the county), though before the completion of my investigation the plan had been put on hold and subsequently abandoned. In doing so I examined more than a dozen spatial phenomena represented as criteria and several more constraint features, in relation to roughly 50 properties zoned for mineral extraction that met the basic requirements for such a facility. Working with this array of data proved challenging, each had to be sourced and acquired, transformed to uniform coordinate systems, trimmed to the appropriate study area (many datasets were province-wide), applied to distance/proximity functions, standardized, compiled, and disseminated. This involved between 10-15 steps for each individual dataset, thus hundreds of operations were required before producing a meaningful result. Having at the time little background in the discipline I did not have the necessary set of skills to automate any of these processes, and many tedious hours were spent manually applying functions and transformations.
Objective
Since that time I have undergone many more GIS and related courses here at McMaster and have been well educated on more efficient means to handle workflows. Vector-based GIS with Darren Scott imparted a working understanding of model-builder within ArcGIS, and more recently GIS programming with Dr. Scott has developed my ability to process and manipulate spatial data with the Arcpy package for python scripting within ArcGIS. This programming class assigned a course project as well, and I elected to continue working on MCDA, but in this case not on a particular problem/investigation but on creating a generic tool with which to automate at least part of the MCDA process. In the project proposal I elected to ‘at least automate data processing and preparation for MCDA’, to potentially ‘go a step further and automate as much of the GIS component as possible’, and ‘at best create a fully functional MCDA machine that accepts raw data as input and outputs ranked candidate locations’. The rationale for the threefold proposal was simple – I didn’t yet know what I was doing, or if creating an MCDA machine was above my head or not!
Implementation
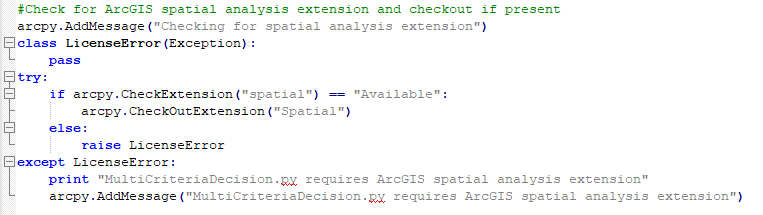
There were many ups and many downs encountered over the roughly 200 lines of code that ensued to culminate my functional yet quite unrefined version 1.0 that did indeed accept raw data inputs and output candidate ranking information. First I began with basic setup operations such as importing modules, setting the working environmental and directory, and checking for licenses. Arcpy makes this simple, and after writing the basic blocks of code required they can be used across many of your scripts. For example:
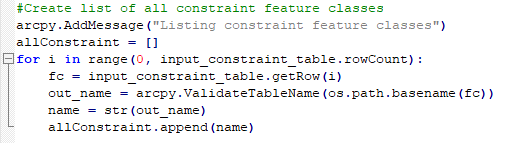
Next, inputs not only had to be defined but configured in such a manner than could be comprehended by the script during iterative processes. Take for example criteria data, which was a multi-input parameter within the tool interface in ArcGIS. This required that the script receive the input from the tool dialogue interface as a table format specific to Arcpy, but the iterative operations being performed later in the script require more basic input, thus transformation to a simple list of the file basenames was necessary. Take for example the handling of constraint feature inputs:
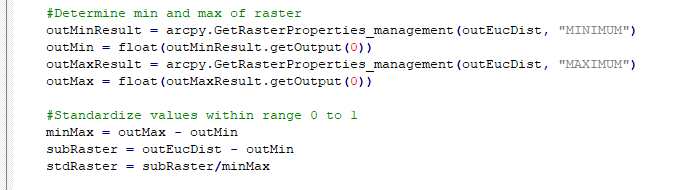
Currently the script evaluates criteria solely based on one type of function, the Euclidean distance calculation (expanding evaluative functions is a primary goal in future improvements) . Thus all criteria inputs pass through the same loop used to assess the value of all locations in the study area in relation to criteria features. Features clipped to the study area enter the loop and standardized, weighted raster datasets are produced. The application of raster calculations is a particularly elegant aspect of the Arcpy package, specifically the functionality provided by the arcpy.sa spatial analysis module that allows the user to structure operations in the form of basic algebraic statements. Take for example the section of the loop that serves to standardize rasters between the values of 0 and 1, raster layers are easily subtracted and divided by other rasters or by constant values:
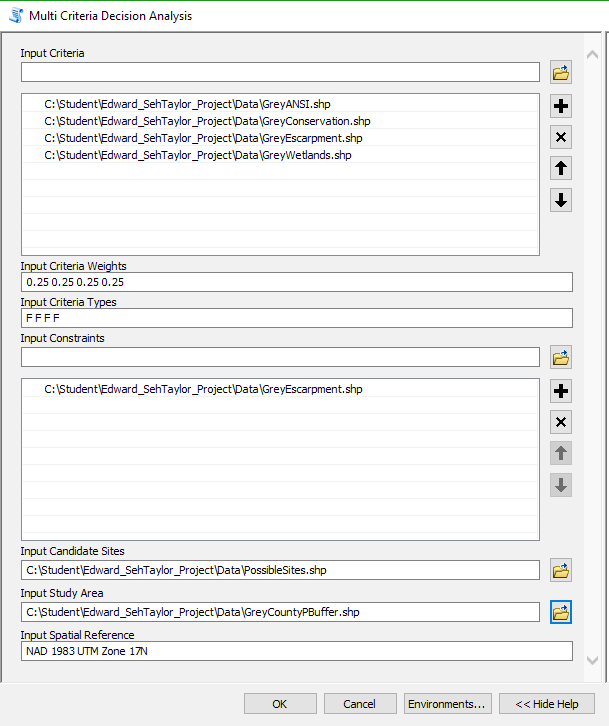
Once written and tested as thoroughly as possible as a stand-alone script in python, the script was used to create a custom tool within ArcGIS using the ‘add script wizard’ in ArcMap. One of the major difficulties encountered in this initial implementation is here revealed. The plan had been to configure multiple columns within the multi-feature inputs, with a drop-down menu to allow the user to select the criteria type for each input, and another to indicate the weighting. As it turns out, this is much more easily conceived than implemented within the script wizard/Arcpy! Very little is available on this topic on the ArcGIS help pages or other online resources such as stack exchange. Additionally, the most relevant text – ‘Python Scripting for ArcGIS’ by Paul Zandbergen makes no mention of how to achieve such a configuration in the tool dialogue box. This was for me a major snag, and among the most glaring inadequacies of the tool. Instead, I had to resort to including separate inputs with which the user can list these values relative to the order their respective criteria appear in the multi-feature input – rather crude indeed!
Results
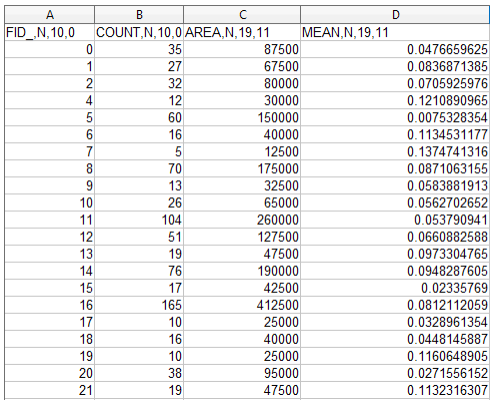
Much to my amazement, the initial trial run as configured in the dialogue shown above ran to completion, and produced the table seen below. An error was still encountered, but during the proceeding and final block of code where this table was to be joined with the candidate location layer in order for the results to be easily visualized by the user. Implementing this final step is still a source of ongoing difficulty, but the result as seen in this table are valid – it simply requires the user to perform the join themselves manually. This is done by picking out the feature IDs with the highest mean, which represents the highest desirability, and matching this to the corresponding candidate location in ArcMap – significantly easier than performing hundreds of manual operations. In fact, going back to the results from my initial MCDA investigation mentioned at the beginning of this post, I found that the results seen below hint at those found originally.
Future Improvements
Completion of the GIS programming course is hopefully only the beginning of this tool. In particular, I aim on its implementation in my GIS based senior thesis next academic year. Many improvements are already in mind or in progress, including:
- General clean-up of the script, ensuring that code conforms to all known ‘best practices’ and industry standards
- Configure more user-friendly output, such as a shapefile of the candidate locations with a join to include rankings
- Extend error handling and the use of exceptions among all appropriate elements of the script
- Configure the multi-feature inputs to include the accompanying parameters of each criterion within the same dialogue
- Expand support for more datatypes – currently the tool only supports shapefile inputs
- Expand the types of operations that can be performed on criteria and allow user to specify desired transformations – currently the tool uses only a Euclidean distance function
- Investigate the inclusion of statistical elements of MCDA such as pairwise comparisons
- Implement a sensitivity analysis, or create a second tool to use in conjunction