
Working with Custom Picture Markers – Seafloor Hydrothermal Features
Around this time last year we submitted the final draft of my MSc. paper to Organic Geochemistry, after long months of hard-work and collaboration with co-authors, reviewers, and colleagues. My project’s focus was on a seafloor hydrothermal vent system called Cathedral Hill, which is in the Guaymas Basin, Gulf of California. The Gulf is tectonically-active, comprising a large structural trough separating Baja California from the Mexican mainland, and is host to a myriad of hydrothermal features which dot the seafloor. The bathypelagic zone of the Gulf, where Cathedral Hill resides (~2km deep) is a truly alien landscape, filled with beautiful spires, chimneys, and other hydrothermal structures that can be teeming with life that has evolved in the complete absence of light. In homage to my time spent learning about the Gulf of California, I wanted to showcase where some of these wonderful hydrothermal structures and seafloor-dwelling critters can be found!
For this project, I aimed to create custom icons in ArcGIS Pro to illustrate the locations of some hydrothermal vents, seeps, and microbial mats from the Gulf of California. Luckily, Esri has a very straightforward tutorial on creating symbol images (follow it here). I used Sketchbook Pro 4.0.6 to illustrate my custom icons, which were ultimately saved in .png format with a transparent background (see Fig. 1).

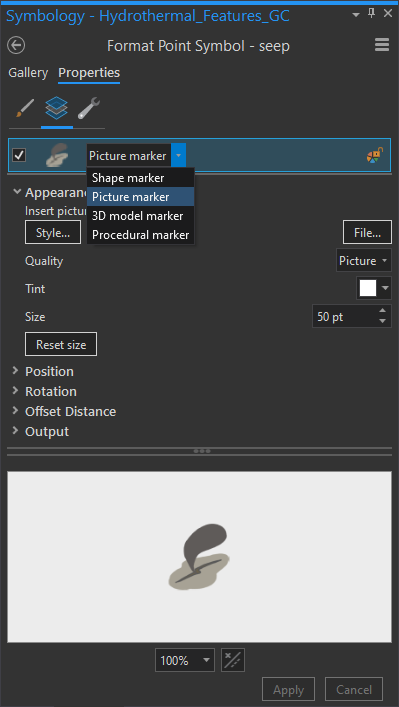
After compiling a database of hydrothermal feature coordinates (Geilert et al., 2018; Paduan et al., 2018; Teske et al., 2016) and importing / mapping them in ArcGIS Pro, I set about changing the feature symbology to my custom icons. To do so, I simply clicked on the desired point-symbol in Symbology, went to Properties, Layers, selected Picture Marker from the drop-down menu, and inserted the picture from File… (see Fig. 2).
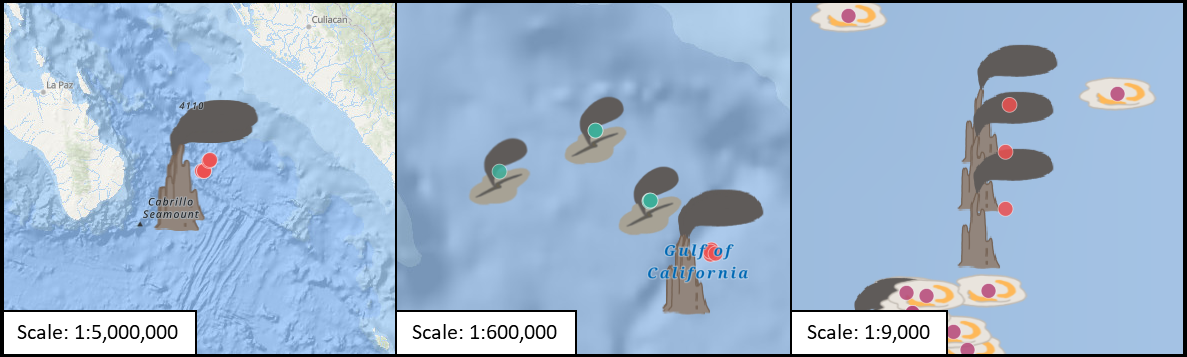
I had to play around with Size so the images wouldn’t look compressed, and because they all had different dimensions, this was variable for each one. Unfortunately, because these icons are so large (25, 50, and 90 pixels for the mat, seep, and vent respectively), they obscure much of the map and look out of place at larger scales. As such, after publishing my Hydrothermal Features layer to ArcGIS Online, and creating a Web Map of these features, I decided to change the iconography depending on map scale (see Fig. 3-4).
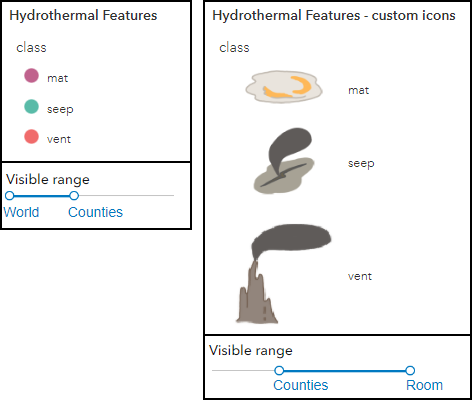

Because the “mat” and “seep” custom icons (i.e. Picture Markers) have good radial symmetry, they tend to align with the Shape Markers (i.e., the true locations of these features) fairly well. However, I’d noticed that the “vent” custom icon has its center-point in the empty space below the smoke plume, making the vent locations appear shifted to the left (i.e., where the chimney is drawn). This is problematic- especially at larger scales (see Fig. 5).
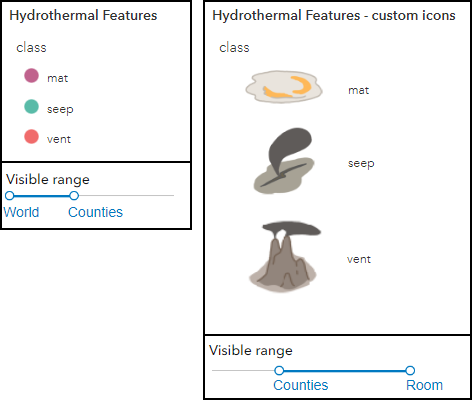
To remedy this issue, one option is to adjust the position of the picture marker (in the properties in Fig. 2 above). However, I chose to re-draw the vent icon – this time making sure that the image composition was more symmetrical, and that the center of the image aligned with the chimney. After following the same steps in Pro, I published my updated layer to ArcGIS Online, and added it to the Web Map. Fortunately, the new vent icons align much better with their true locations (see Fig. 6-7)! For an interactive version of the final product, click here.

From this experience, I learned it’s fairly easy to add custom icons to ArcGIS Pro and ArcGIS Online… but there’s a few pitfalls you’ll want to avoid so everything looks proper! For one, follow Esri’s instructions regarding .png image size in their tutorial (you definitely want to make your icons small). I’d recommend taking a screenshot of your basemap at a larger scale, and adding it to your drawing software as a background layer – this should allow you to sketch your icons at roughly the size they’ll appear on the map! I’d also recommend experimenting with vector graphics, as these are infinitely scalable (though legibility can still be compromised at certain scales, depending on how they are drawn). Finally, when drawing your own icons, it may be more convenient to ensure that the center of your custom icon aligns with the main feature of the image, instead of empty space.
With these tips in mind, I’m looking forward to when I can create/apply custom icons to future maps! It’s a great way to create a map that doesn’t heavily rely on a legend.
Hydrothermal feature sources:
Geilert, S., Hensen, C., Schmidt, M., Liebetrau, V., Scholz, F., Doll, M., … Berndt, C. (2018). On the formation of hydrothermal vents and cold seeps in the Guaymas Basin, Gulf of California. Biogeosciences, 15(18), 5715–5731.
Paduan, J. B., Zierenberg, R., Clague, D. A., Spelz-Madero, R., Caress, D. W., Troni, G., … Wheat, C. G. (2018). Discovery of Hydrothermal Vent Fields on Alarcón Rise and in Southern Pescadero Basin, Gulf of California. Geochemistry, Geophysics, Geosystems, 19(12), 4788-4819.
Teske, A., de Beer, D., McKay, L. J., Tivey, M. K., Biddle, J. F., Hoer, D., … MacGregor, B. J. (2016). The Guaymas Basin Hiking Guide to Hydrothermal Mounds, Chimneys, and Microbial Mats: Complex Seafloor Expressions of Subsurface Hydrothermal Circulation. Frontiers in Microbiology, 7, 75-98.