
Assessing Crime in Halifax – from Spreadsheet to Web Map
My first semester in the Geographic Information Systems program at COGS (Centre of Geographic Sciences, Annapolis Valley, NS) has been an amazing learning experience. In three months, I’ve gone from almost zero knowledge of GIS theory, applications, and techniques to making flashy and informative Web Maps! One I’d like to showcase was done earlier this semester in our Fundamentals of GIS Course, where we use Halifax Open Data to search for datasets to adapt for online map display. For my project, I chose to plot the Crime dataset, which records the locations and details of various reported crimes across the Halifax Regional Municipality (HRM) within a 7-day window.
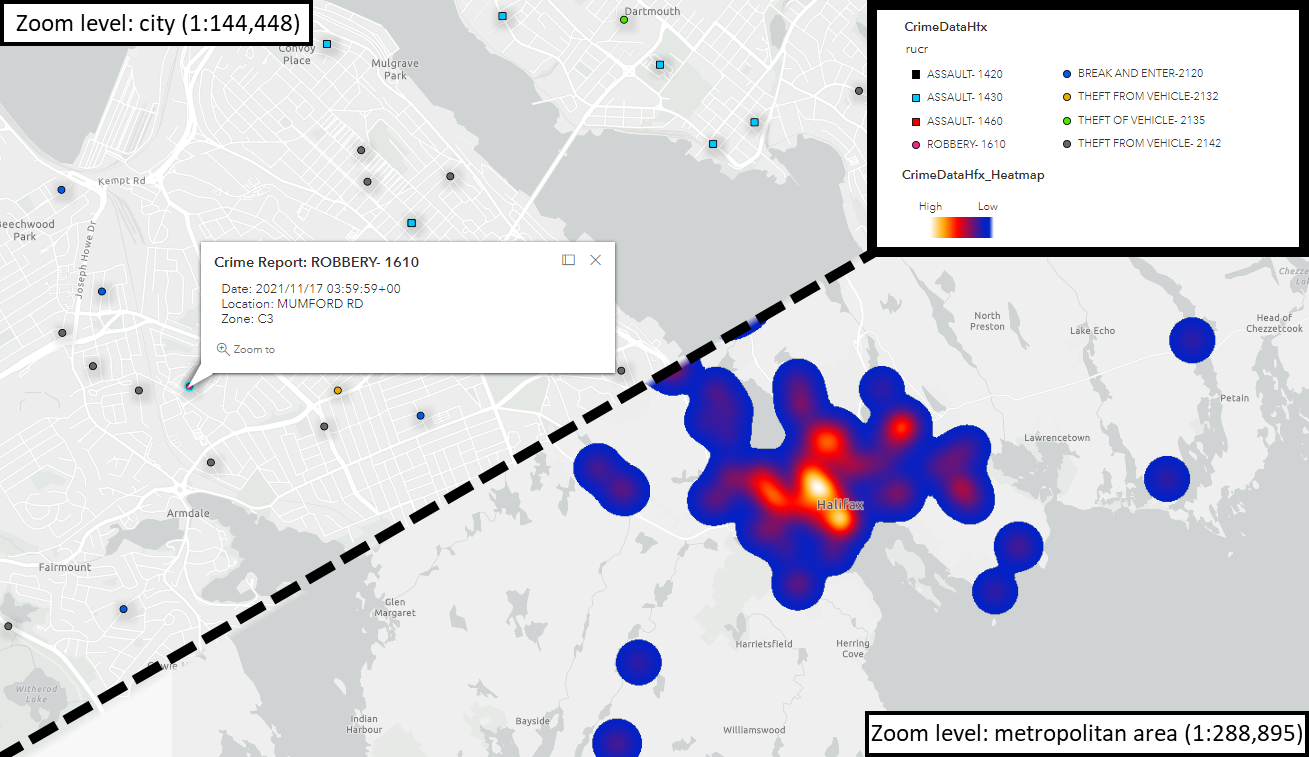
Below is a preview of the final Web Map, which features a heatmap and points representing crimes reported in the HRM from November 15th-20th. The interactive version can be viewed here: https://connor.maps.arcgis.com/apps/instant/sidebar/index.html?appid=b218adaec39847849e746a230fa6a36e
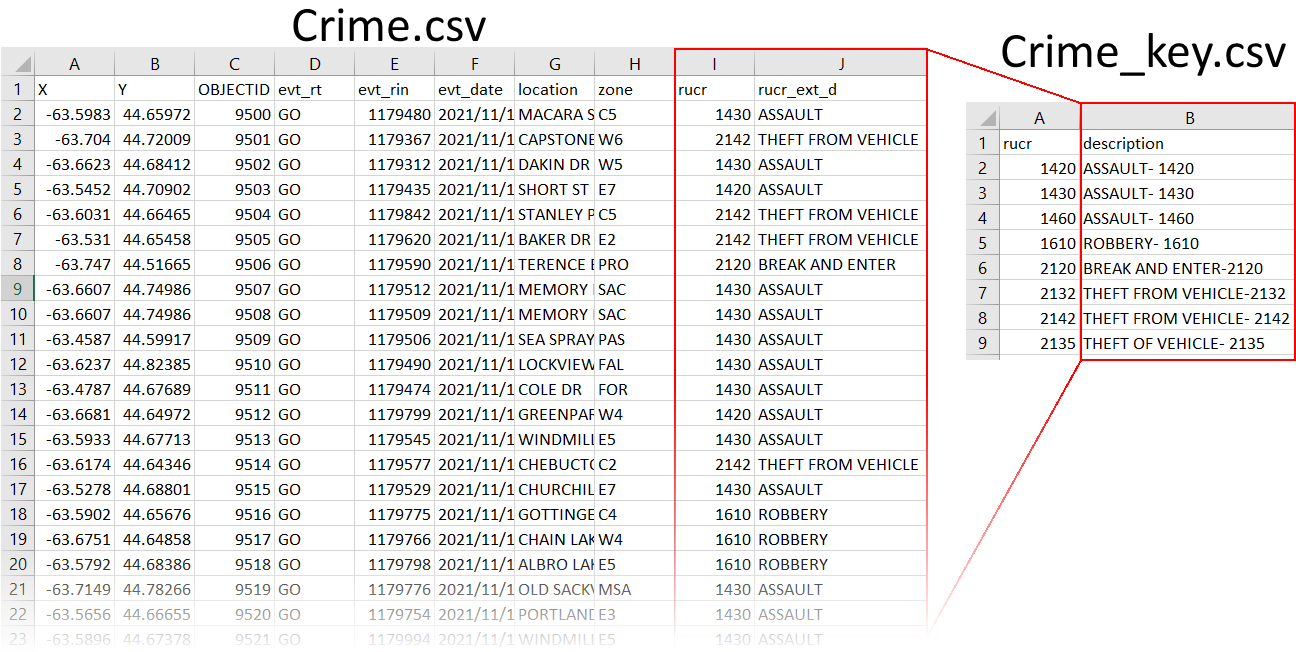
Several steps had to be taken in Excel and ArcGIS Pro to convert the Crime.csv dataset into its current form as a web layer. For instance, the crime description field (rucr_ext_d) has duplicate entries for several different crime codes, and should thus be made more descriptive (for example, the crime description “ASSAULT” is repeated for three separate codes: 1420, 1430, and 1460). As such, a separate datafile – Crime_key.csv – was created to act as a “lookup table” for the Crime dataset, which will ultimately be used to combine these fields within ArcGIS Pro (ex: “ASSAULT- 1420”, “ASSAULT- 1430”, etc.).
The completed Crime_key.csv file was loaded into ArcGIS Pro using the Table To Domain tool, which creates a value domain of the input table values (Fig. 3A). These comprise the new crime descriptions and associated crime codes from the Crime_key.csv “lookup table.” Because these codes match the original Crime.csv dataset, this field can be replaced with the updated descriptions down the line (enabled by selecting Update Option- Replace the Values).
In order to load our Crime.csv dataset into ArcGIS Pro, the Table To Table tool was used, which exports the rows of the input table into our file geodatabase as a Standalone Table, which we labeled Crime_Data (Fig. 3B). Next, to transform our Crime_Data table into a point feature layer, the Make XY Event Layer tool was used (Fig 3C). As shown in Fig. 2, the Crime.csv dataset contains x,y coordinate information, which was loaded into the X Field and Y Field in the tool. The spatial reference system for this dataset, WGS84, was also selected in the Spatial Reference section. Together, these data were combined to create a point layer (Crime_Data_Layer), which contains a point for every row in the Crime_Data table. Note that this feature is temporarily stored “in memory” (i.e. not a geodatabase). As such, the Crime_Data_Layer feature class was made into a permeant feature class using the Feature Class To Feature Class tool (now saved as CrimeDataHfx to our geodatabase- Fig. 3D).
Finally, using the Assign To Domain tool, the rucr crime codes in CrimeDataHfx were replaced with the value domain containing our updated descriptions from Crime_key.csv (Fig. 3E).

With this, our crime dataset is in its final state, having undergone the necessary modifications / updates to describe the extent and records of crime incidents around the HRM. After a bit of styling, it was easy to upload CrimeDataHfx from ArcGIS Pro into ArcGIS Online (via the Share tab). In a new Online Map, I did a bit of styling (I love the new effects recently released – for an overview, I’d recommend reading: What’s New in ArcGIS Online (September, 2021)), added a heatmap with a second instance of the web layer, and configured the pop-up windows for the point features.
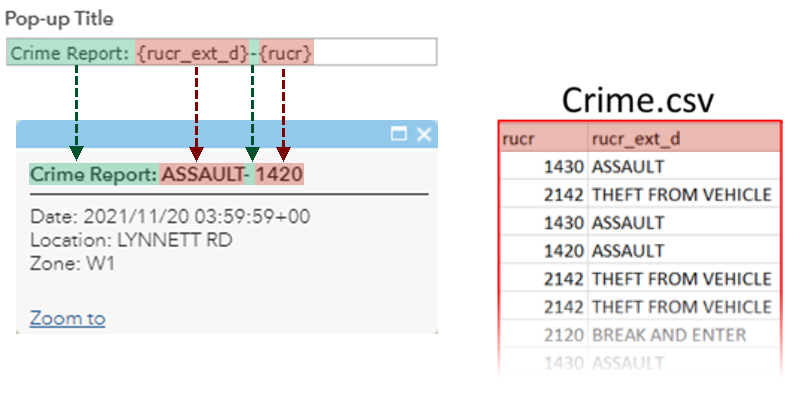
It was here I learned that most of the work I’d done could be substituted by configuring the pop-up settings in ArcGIS Online. Instead of the steps described above using the Crime_key.csv table, Table To Domain tool, and Assign To Domain tool, the syntax shown in Fig. 4 will display exactly the same results in a popup. It goes to show how your workflow can be streamlined if you know the right tools for the job! However, the “domain approach” does provide additional capabilities within ArcGIS.
This was one of my favorite projects from the GIS program thus far, as it showed firsthand how to transform a raw dataset into a useful, informative map! One last thing I’d like to note is an important feature of the Crime Dataset- it’s constantly updating. As such, it may be possible to create an online map that changes as new data is made available! With the integration of Jupyter Notebook and ArcGIS, a web scraper should be able to pull the data from the web, modify it, and add/append the new points to a Web Map. It’s something I’d definitely like to explore in the future!