
Clipping a Large DEM to a Large Shapefile and Getting Raster at Specific Elevations/Depths
When given the task of clipping a large DEM of Georgian Bay to a large shapefile of wetlands running along eastern and northern Georgian Bay at five different lake levels between specific depths, it led to more crashes than I expected. I found similar problems online and I want to show how I overcame it. First, I will go over how I clipped a large DEM to a large shapefile and extracted the DEM at five lake levels. Second, I will show how I got the clipped DEM at specific depths, and lastly, the importance of this data. To begin, below are the files I started with, using a computer with 32 GB RAM and a , and 4 GHz Intel Core i7 CPU.
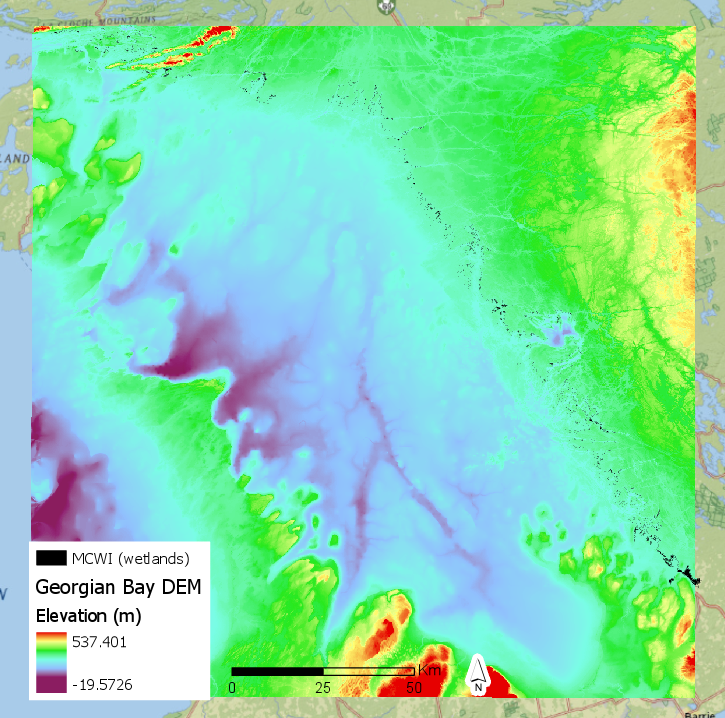
- DEM of Georgian Bay: 10 m by 10 m resolution, 1.26 GB, created when lake level was 176.17 m.
- Shapefile of all wetland units in Georgian Bay, called the McMaster Coastal Wetland Inventory (MCWI), 13.5 MB, covering over 50 million m2.
Clipping a Large DEM to a Large Shapefile
Here I begin discussing what failed. First, I tried using Clip Raster (Data Management Tools) with ArcGIS Pro on the two layers but it crashed many times after running for about half an hour. Secondly, I ran the tool in the Python console, with the following code:
clipped = arcpy.Clip_management("gb_dem", "423155 608142 4951924 5108181", "E:\GeorgianBayAtlas\GeorgianBayAtlas.gdb\clipped_gbdem.tif", "MCWI", "0", "ClippingGeometry", "MAINTAIN_EXTENT")
This time, it ran for over two days before crashing. At first, I thought it was because the DEM was too large, but it turns out it was because the shapefile was too large. As a result, I had to systematically clip the DEM to smaller sections of the wetlands shapefile. I decided to divide up the wetlands by its quaternary watershed. Using these, the DEM was successfully extracted into seven clipped DEMs.
The next step was to get the DEMs at the five lake levels of interest which are 175.5, 176.0, 176.5, 177.0, and 177.5 m. To get the DEM with these depths, the Raster Calculator was used with each DEM with the following calculation to get the depth (e.g., for 175.5m):
175.5 – “gb_dem”
Afterwards, using the Mosaic to New Raster tool, the seven pieces were merged into one DEM. This was repeated five times in total to produce a complete DEM for each of the different lake levels.
Getting Raster at Specific Elevations/Depths
The second part of the task was to get the five DEMs clipped to the wetlands to then be further selected for the depths greater or equal to 0 and less than or equal to 5. The first step was getting the area that has those depths using the Raster Calculator and iterating over the five DEMs with the code:
Con("%Raster%">=0,1,0) & Con("%Raster%"<=5,1,0)
Secondly, the outputs in the last step were then run using the Extract by Attribute tool, using the following formula:
“Value” = 1
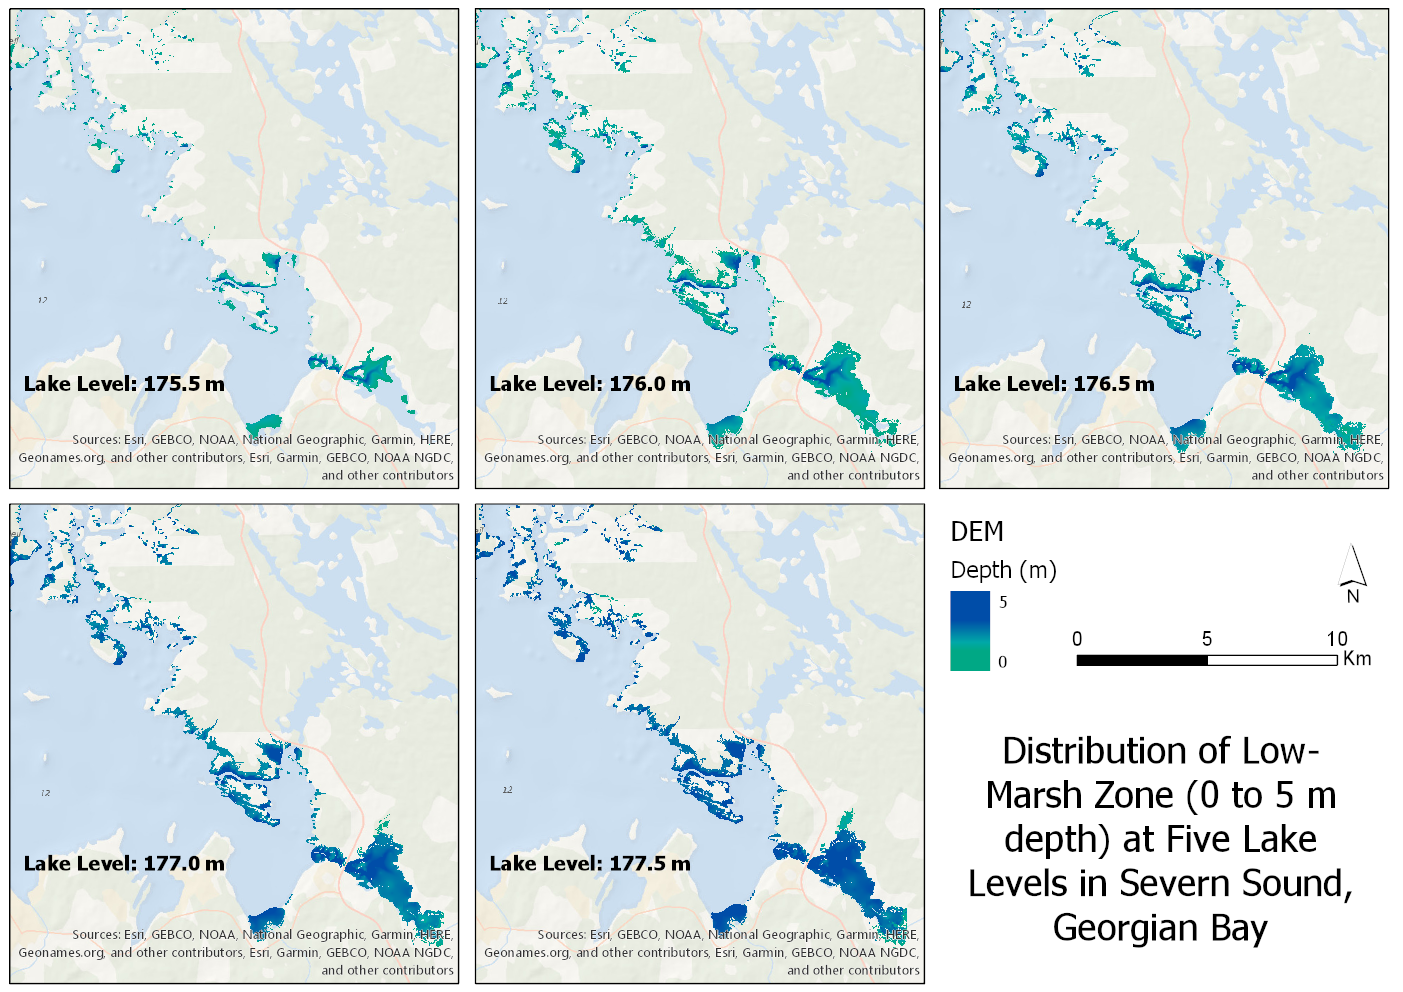
Lastly using the Extract by Mask tool, the five DEMs were masked by the outputs in the last step, which completes the second task. The final product is shown in the figure below for Severn Sound, Georgian Bay.
Importance or Use
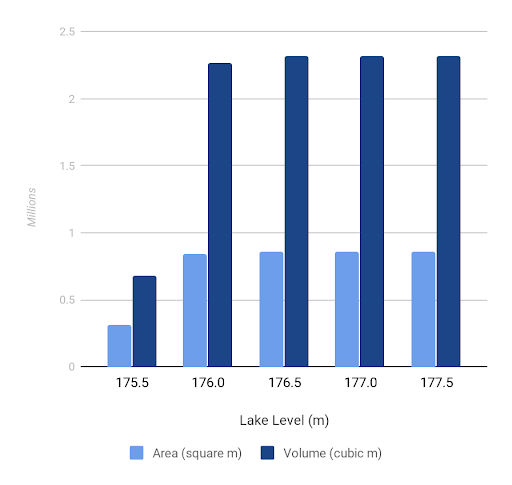
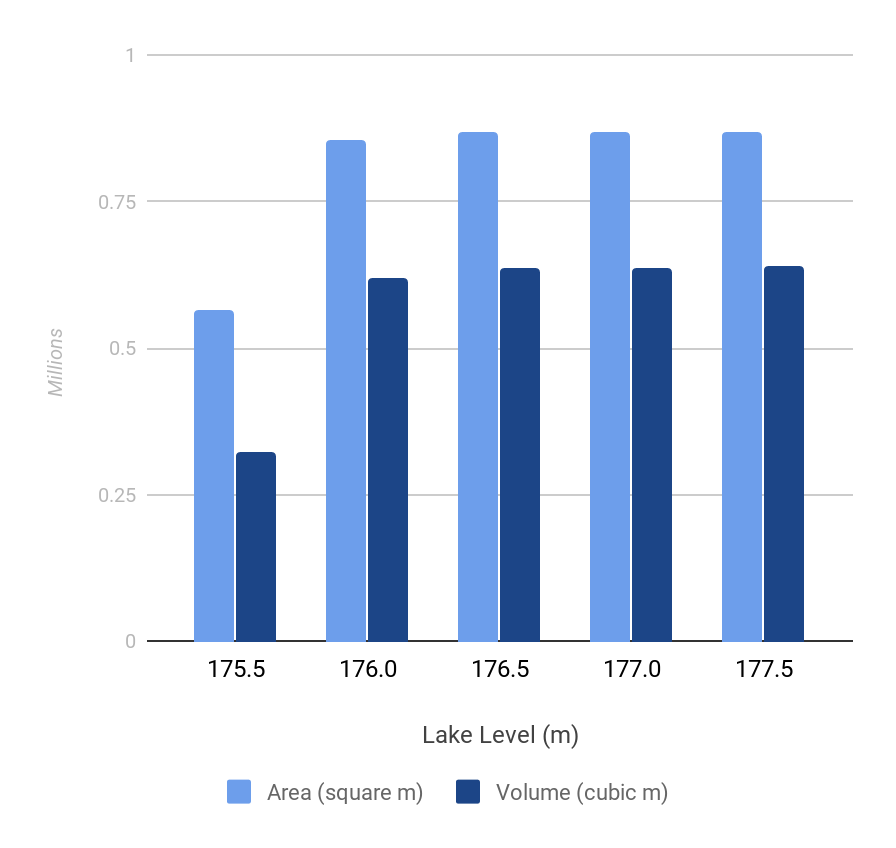
Finally, I will answer your curiosity, if you were wondering, what these clipped rasters are to be used for, and why these lake levels and depths. This project was initially carried out because my supervisor was wondering how the area and volume of low-marsh zones changes along Georgian Bay at different lake levels. For example, Green Island (a wetland in Severn Sound) has a different area and volume than Sturgeon Bay (wetland also in Severn Sound), where Sturgeon Bay is likely much more shallow than Green Island because its area is greater than its volume. In addition, changes in each wetland with changing lake levels is also important to assess aquatic ecosystem health. Lake levels are one of the primary indicators for aquatic organism status because the extent of coastal wetlands directly affects the amount of critical habitat available for fish and wildlife communities (Weller and Chow-Fraser, 2019). In Georgian Bay (or Lake Huron), the lake levels fluctuates between 175.5 m and 177.5 m, hence why those lake levels were chosen. The primary area of interest is where the water depth is between 0 to 5 m (low-marsh zone) because that is where most of the complex, submersed aquatic vegetation grows, supplying habitat for organisms. By looking at the values and the map, it can be assumed that aquatic organisms are compromised during lake levels of 175.5 m, and the other lake levels are relatively indifferent for these two wetlands.
It is expected that there will be hundreds of wetlands along Georgian Bay. All this information for each wetland will be compiled into an atlas which is currently a work in progress. Following posts will be on other aspects of the atlas.
Reference
Weller, J. D., & Chow-Fraser, P. (2019a). Simulated changes in extent of Georgian Bay low-marsh habitat under multiple lake levels. Wetlands Ecology and Management, 27(4), 483–495. doi: 10.1007/s11273-019-09673-4