
A Day in a Life of a GIS Intern at CBRE
As a BCIT Advanced Diploma GIS student, part of the curriculum involves an industry sponsored project or practicum. Earlier this year, I was fortunate and grateful to start an internship at CBRE working with their Location Intelligence team here in Vancouver, BC.
CBRE is the largest commercial real estate services and investment firm globally and provides a broad range of services (CBRE Canada). Within the Location Intelligence team, they deploy Location Analytics to provide insight and strategies in retail, financial services, healthcare, and many other service industries (CBRE Location Analytics). I will be going over my day-to-day tasks, and some of the projects I get to work on with the Location Intelligence team.
Intern Responsibilities Overview
During my internship, I was involved in different tasks which can be broken down into four main categories:
- Ad-hoc requests
- Digitization
- Extract, Transform, Load (ETL) Spatial and Non-Spatial Data using Python Scripts and Alteryx
- Updating Map Library
My responsibilities as a GIS Intern are synonymous to most entry-level GIS Technician/Analyst roles in a corporate environment. While those are my main responsibilities, I am not limited to these tasks and sometimes assist the team on an as-needed basis.
Ad-Hoc Requests
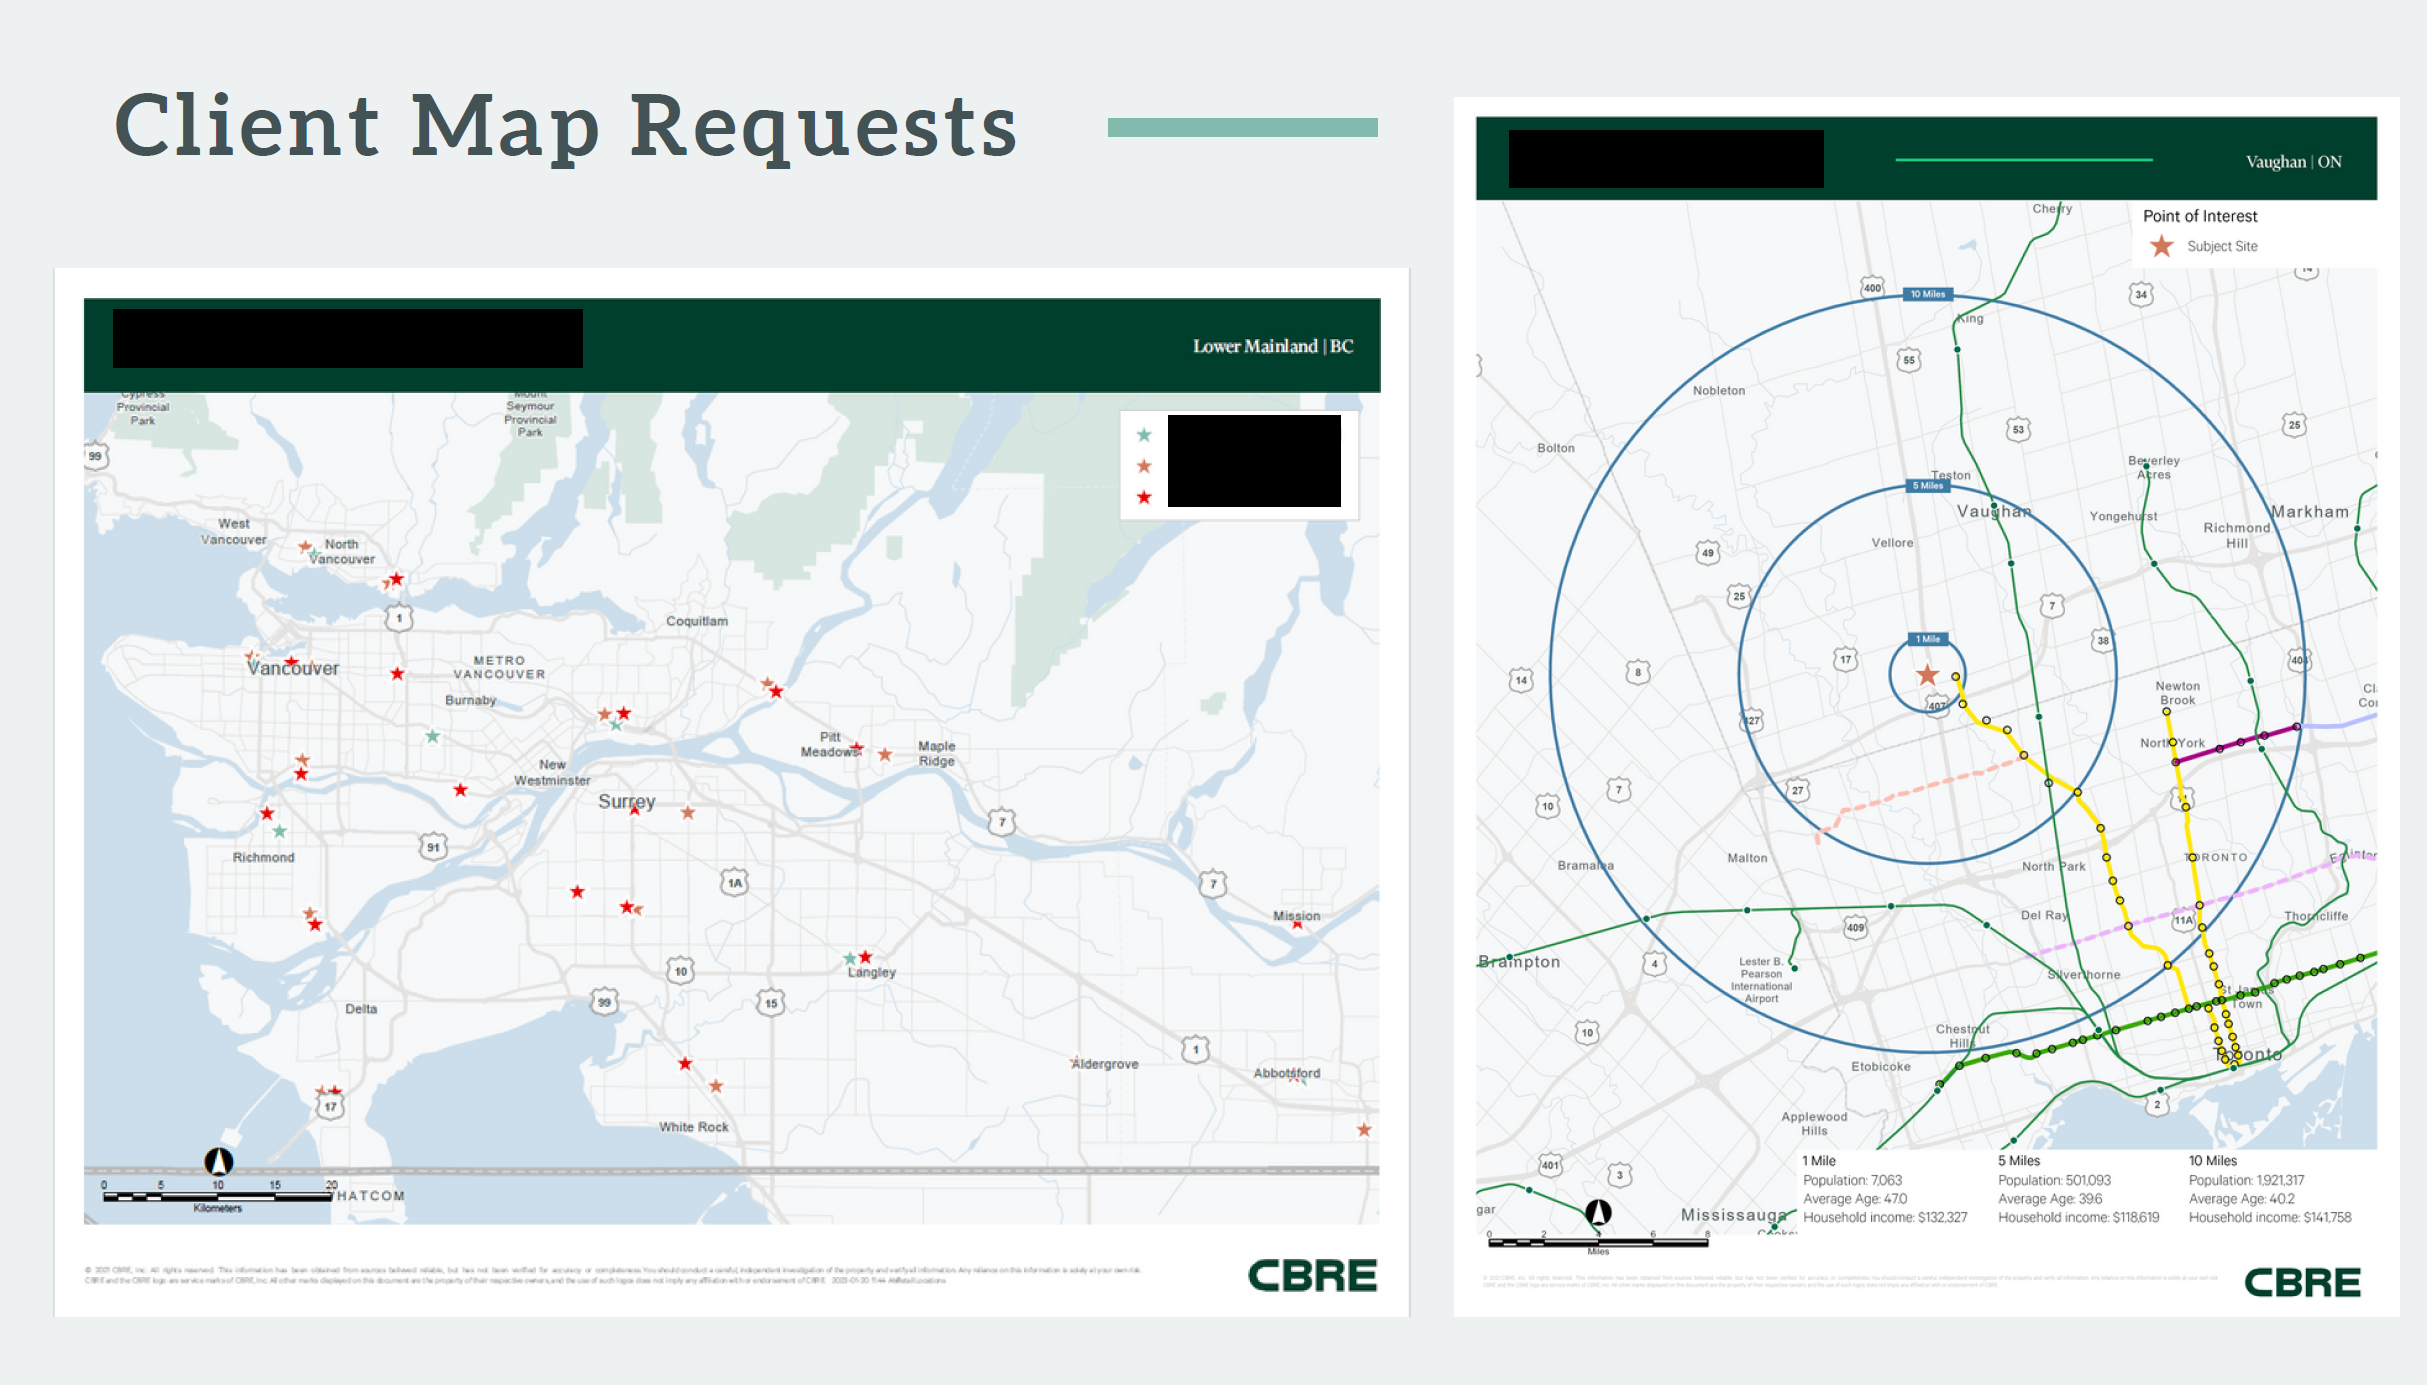
The Location Intelligence team occasionally gets internal requests from brokers, sales associates, marketing, research, etc. and these are sometimes in the form of a static PDF map for their clients.
Here are some examples of what a client map would look like (a mock-up using other sites and data was created due to sensitive information):
Digitization
Like many GIS Technicians, I was responsible for digitizing various features. These mainly include retail space (buildings) and sidewalks. I used a combination of ArcGIS Pro and Google Earth Pro to digitize these features. The purpose of digitizing was to delineate the area of interest where we can create foot traffic heat maps using Mass Mobile Data (MMD).
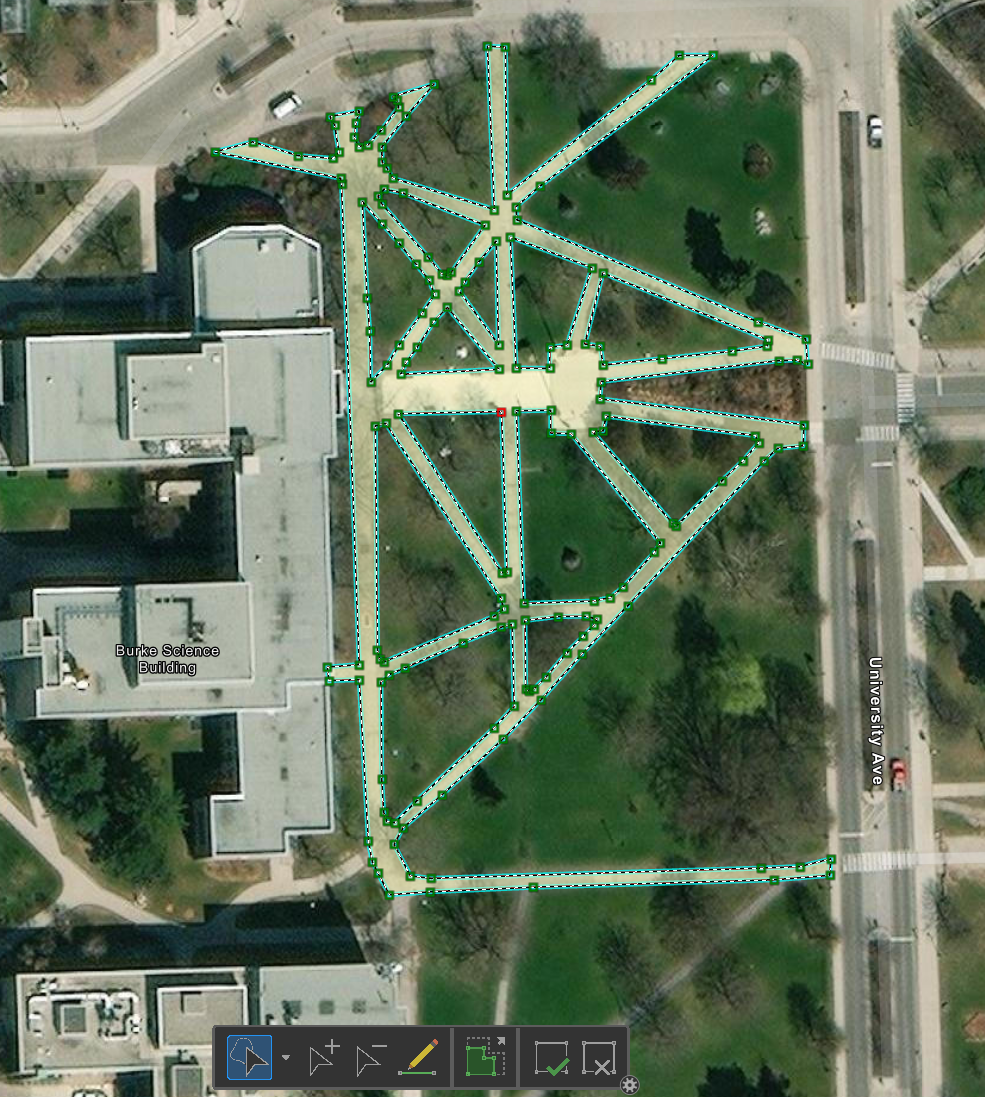
When digitizing based on aerial imagery, it is best to use orthorectified images to accurately map out real world features. For this example, I did not use an orthoimage as the basemap since this was for demonstration purposes.
Orthorectified images have been processed to apply corrections for optical distortions from the sensor system, and apparent changes in the position of ground objects caused by the perspective of the sensor view angle and ground terrain.
Esri Insider, 2016
When orthoimages are not available, I used Google Earth Pro since it allows me to enable 3D features (such as buildings) and pan/tilt to my desired view where I can trace the features that aren’t easily seen from a non-orthorectified (oblique) aerial image. The digitized areas are then exported into a KML and imported back into ArcGIS Pro as a feature class using the KML To Layer tool.

ETL with Python (ArcPy) and Alteryx
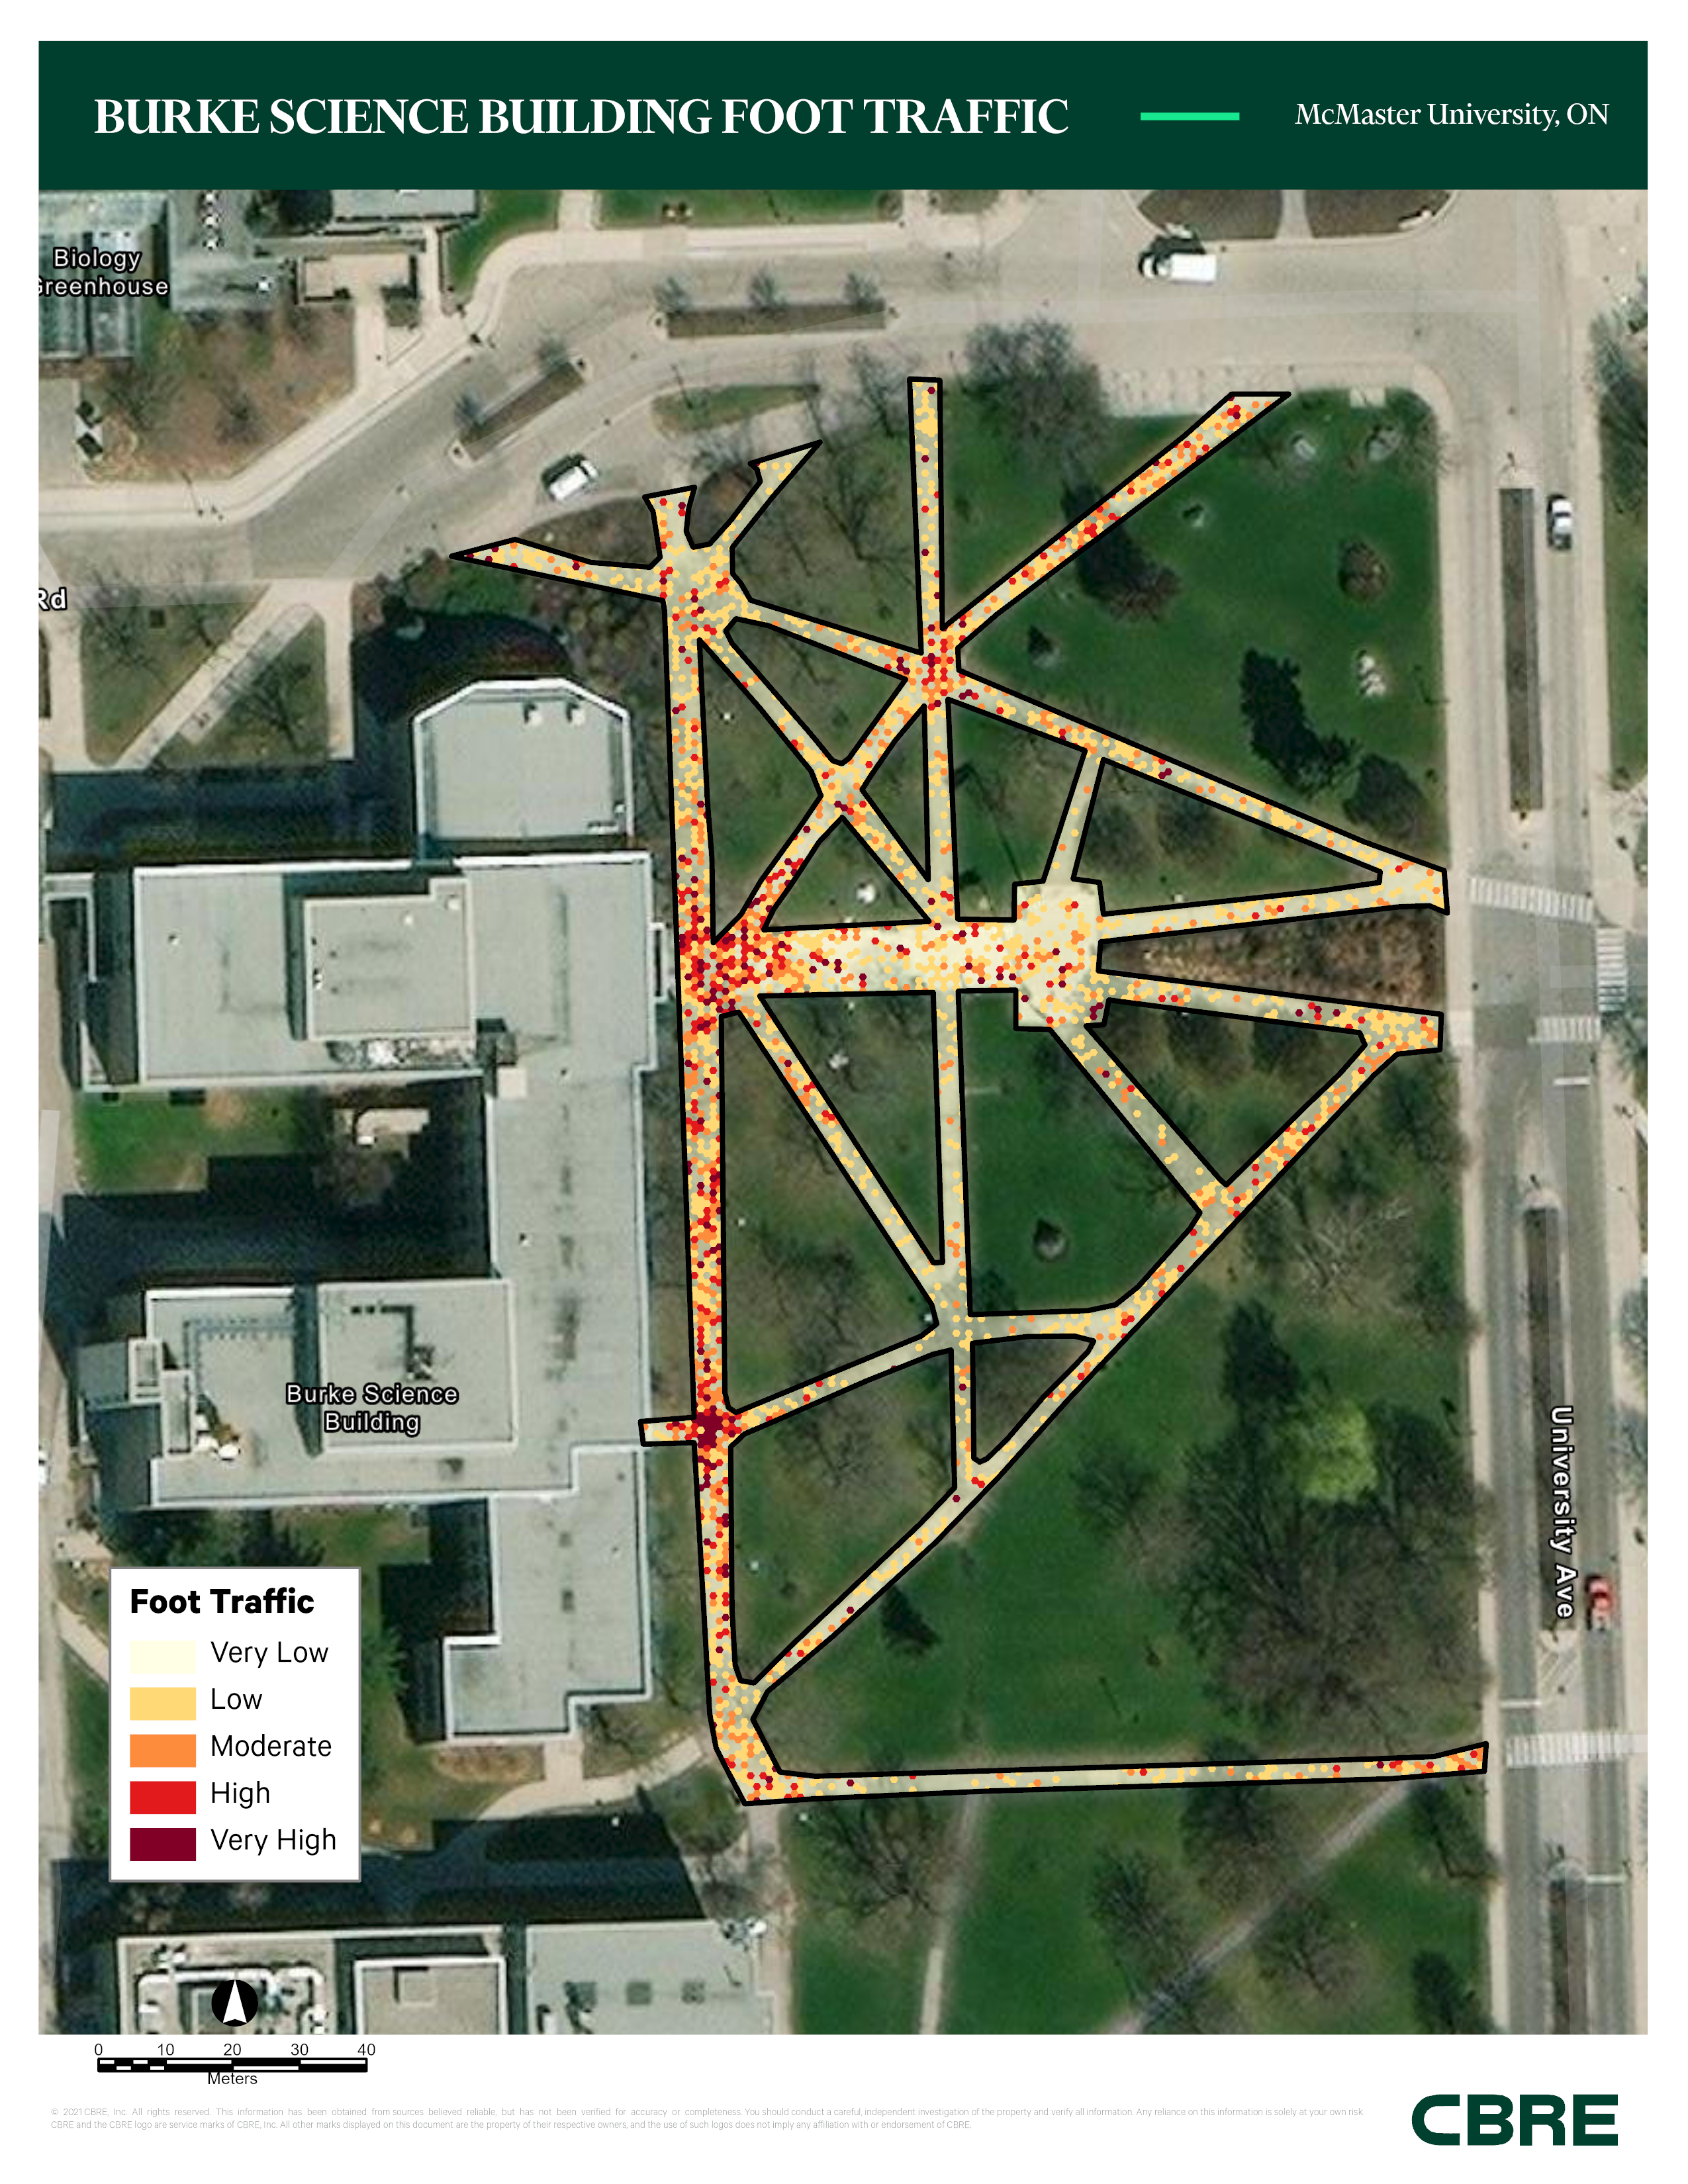
Continuing with the use of the digitized features (the sidewalks), we can use its extent to query for mobile ping locations over the past year, generating a tabular report. Alteryx will then be used to manipulate the data (ETL) which allows me to calculate the foot traffic index for this area of interest. Within ArcGIS Pro, I can create a simple model using ModelBuilder or a Python script to clean up any data if necessary and convert this table with XY values to a feature class (points). CBRE can use these types of maps to help determine the best retail locations for their clients based on high pedestrian foot traffic.

This is the data after it has been processed using a combination of generating tessellations within the study area, spatial joins, and an Alteryx workflow of calculating the foot traffic index.
There is so much one can do with MMD – Enrique Pedroso, the previous year’s intern and BCIT’s ECCE student associate, has done an amazing job showcasing how CBRE processes and uses MMD. You can read more on his blog here.
Map Library Updates
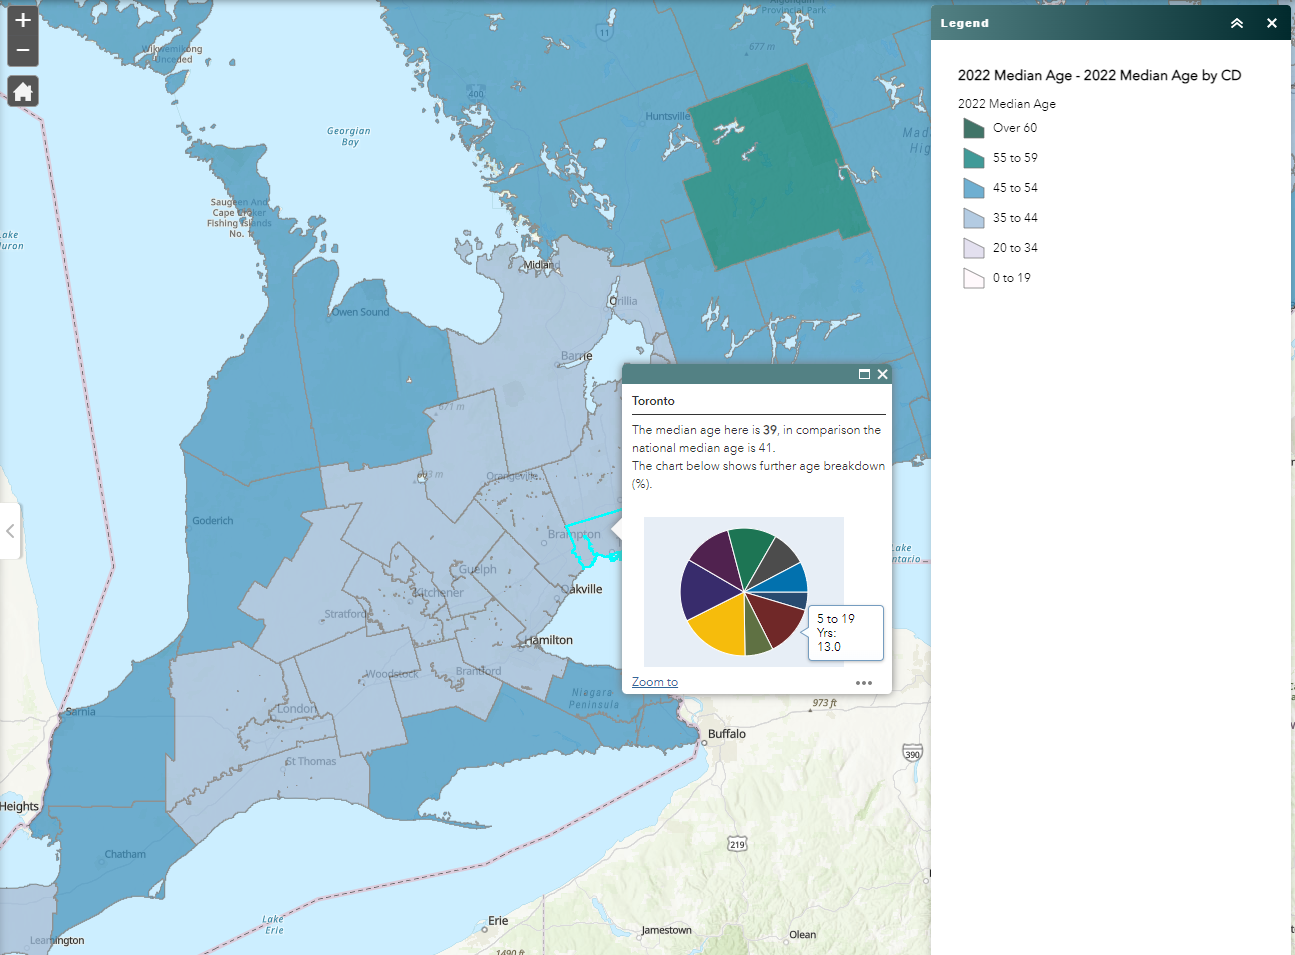
Within Location Intelligence, there are a series of Esri Web Applications that contains several demographic data at different census geographic units (e.g., Dissemination Areas) in Canada. The Business Analyst extension was used to enrich these layers with the demographic data. My responsibility was to process and clean up large demographic datasets that account for most of the population in Canada and create a corresponding Web App to contribute to the map library.
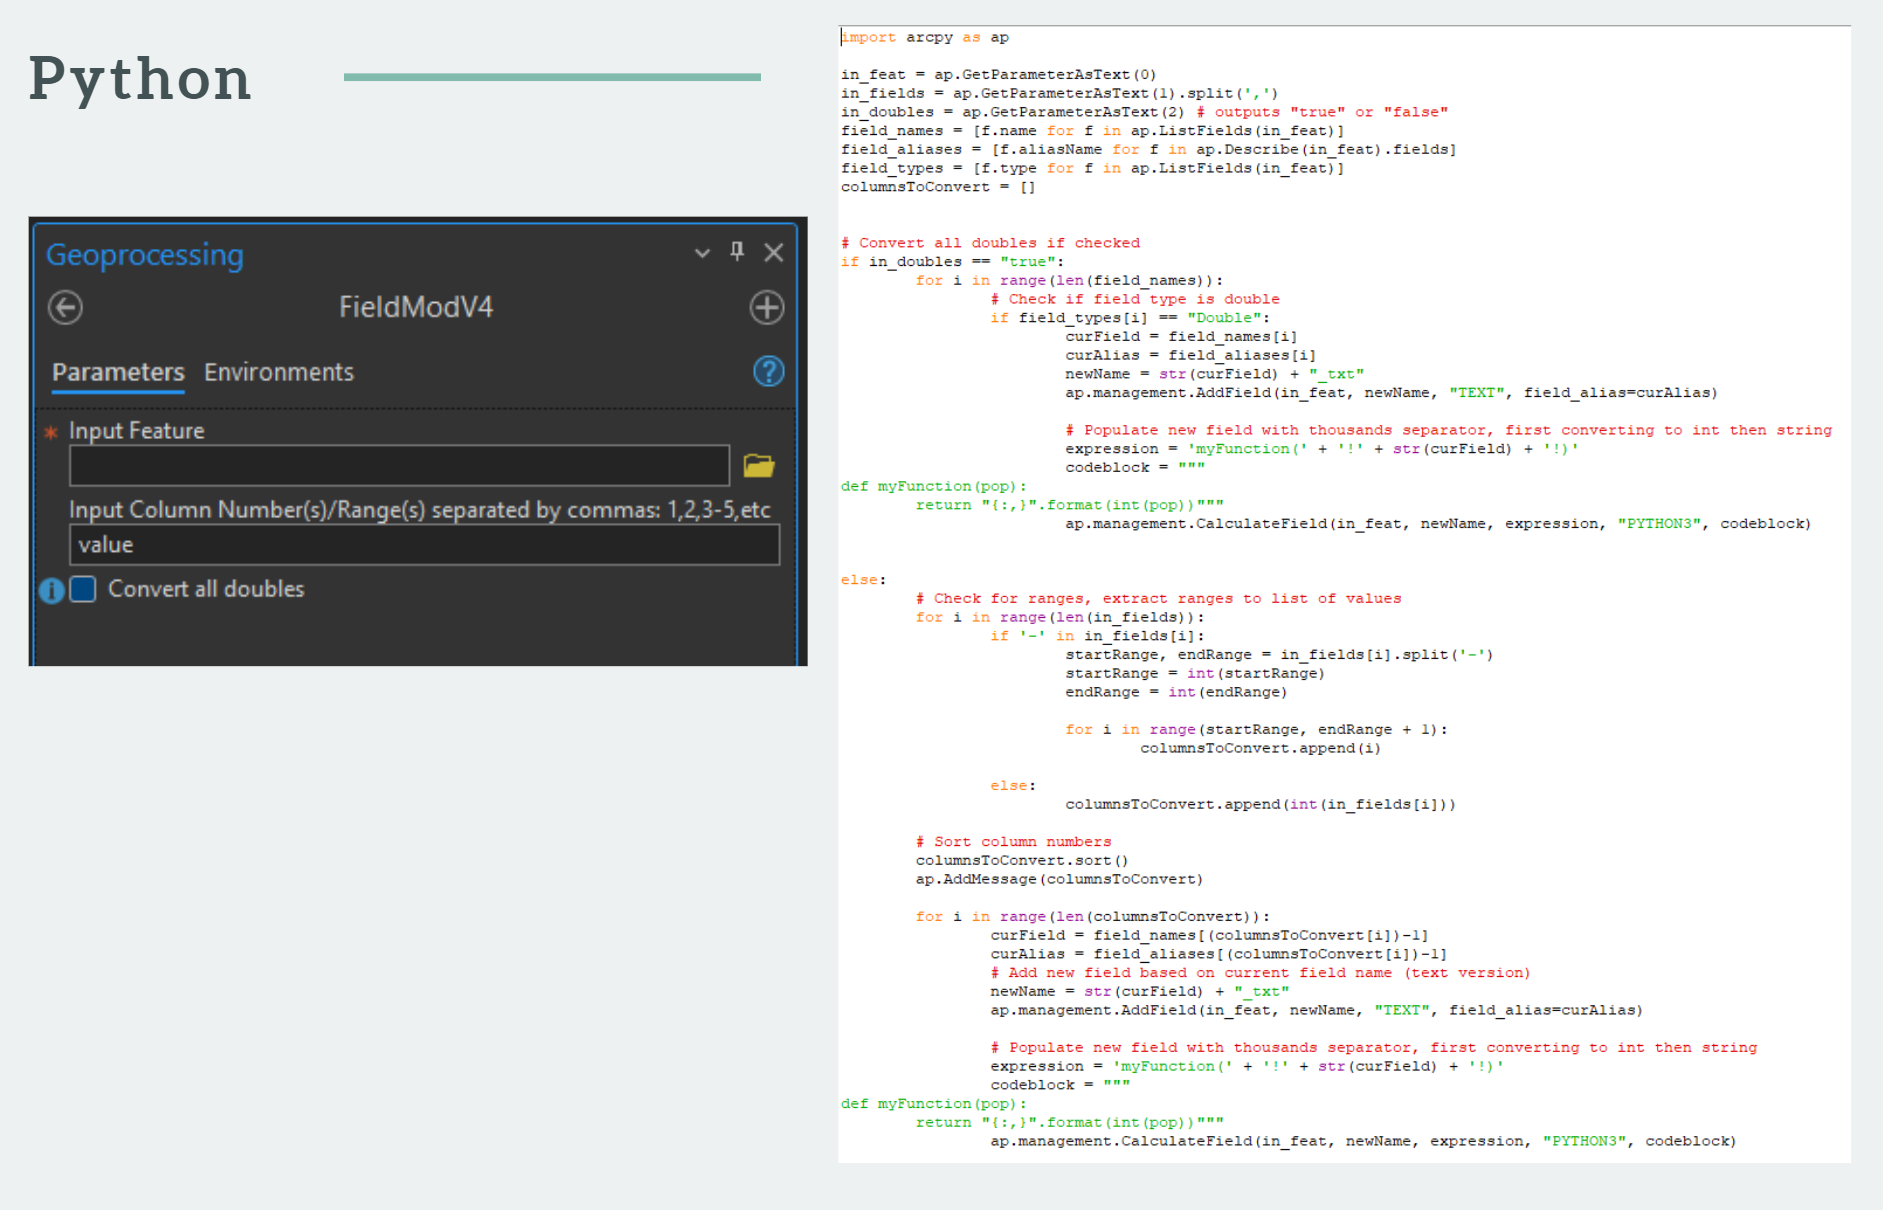
Since we want to display the data in a certain format (e.g., with thousands separator and custom significant digits), I created a Python script that allows the user to specify which fields to be formatted.
Configuring the layer’s popup and symbology can be done through ArcGIS Online/Enterprise but is also available on ArcGIS Pro by right clicking on a layer and selecting Configure Pop-ups.
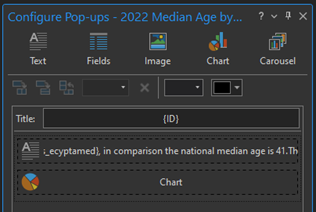
Once the symbology, pop-ups and layers are configured, the feature layer can be uploaded onto Enterprise/Online where I create a web map to be used within a web application.
Conclusions
The Location Intelligence team at CBRE has provided me with a lot of learning experience when it comes to how they use GIS in real estate. I got exposure to web GIS by creating Web Applications using ArcGIS Online/Enterprise, perform data visualization and analyses using Mass Mobile Data (MMD), creating professional maps for clients, and many more technical GIS tasks. I really enjoyed working with the team and look forward to seeing how GIS can further be utilized in unique ways.
Questions?
Connect with me on LinkedIn!
Websites