
Looking at Favourite Mall Destinations Throughout Toronto’s Metropolitan Area
Blog Summary:
Thorough understanding of a location is fundamental for real-estate professionals and stakeholders. Geospatial visualizations and data have the capacity to capture a geographic snapshot in time explaining the synergy and interaction between people and areas of interest. In this blog post I describe how GIS and data are used at CBRE to visualize these interactions between people and places. I highlight how Extract, Transform and Load (ETL) software, and Esri technology are used to identify and visualize areas of preference for a given service, or areas where businesses are in direct competition with each other geographically.
While at CBRE I was a GIS Intern and had the opportunity to collaborate with CBRE’s Location Intelligence Team to analyze the common evening locations of mobile devices to determine which shopping centre was preferred within the Toronto Metropolitan Area for 2019.
GIS and Data at CBRE
GIS plays a pivotal role in everyday operations at CBRE when it comes to spatial mapping, demographic analysis, site selection and other geographic inquiries related to real-estate. In a 2020 article by Esri, the arms race between the largest real-estate firms was described as “accelerating with each striving to win business and serve clients using the latest digital technologies”(Esri, 2020). CBRE’s GIS has grown in this capacity, surpassing many of its competitors in the process by incorporating platforms such as Dimension (CBRE’s in house name for its ArcGIS Enterprise platform) as part of its digital solution to support commercial real-estate initiatives (Esri, 2020).
“As one of the largest commercial real-estate firms in the world, [CBRE’s] access to data is unparalleled.”
Tahirah Mahan Thomas (2019 SES at Esri UC: CBRE)
Tahirah Mahan Thomas, who is the Managing Director of Location Intelligence and Retail Analytics at CBRE, noted in a 2019 Esri User Conference presentation that CBRE lives at the intersection of technology and real-estate service. Incorporating various third-party datasets into Dimension is a key component of what gives CBRE its competitive advantage when creating and informing location-based strategies for clients in sectors such as retail, industrial, financial, and healthcare.
One of many third party datasets that CBRE has access to is mobile data through Near’s Vista platform. Near acquires and processes the location of mobile devices from GPS sources using multiple software development kit (SDK) platforms. Mobile data has the capacity to show activity in and around areas of interest and Dimension applications, such as Esri’s Web AppBuilder, Dashboards and ArcGIS Story Map can be used to weave a location story for CBRE professionals and clients.
Analyzing Preferred Shopping Centres in Toronto
Through the use of mobile data, shopping activity and preference can be understood around multiple shopping centres. More specifically, mobile data such as Common Evening Locations (CEL) can inform professionals and commercial clients about which shopping centre is preferred over another within a major city such as Toronto.
Data used: Common Evening Locations
Common Evening Locations (CEL) records where a device is at rest during the evening, and this data is acquired through Near’s Vista software-as-a-service platform. Near describes CEL as follows:
“Using an algorithm, and drawing from several months of historical mobile location data, a device’s likely home location is derived based on where it rests during ‘non work’ hours, defined as evenings (6pm to 8am) and weekends”
Near (Commong Evening Location/Commong Daytime Reports)
For the purposes of the analysis, 2019 pre-pandemic CELs are acquire and analyzed for six major shopping locations within the Toronto CMA (Census Metropolitan Area):
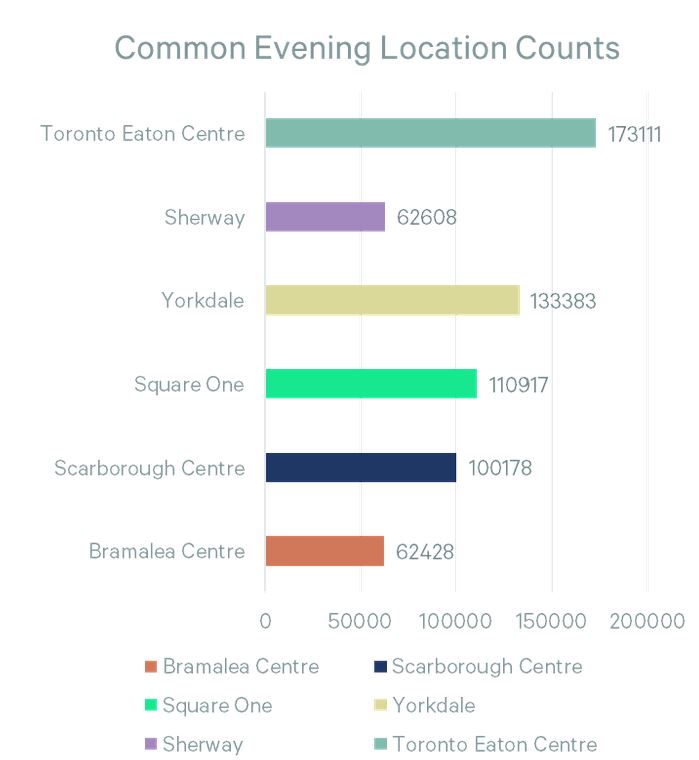
- CF Toronto Eaton Centre
- Square One Shopping Centre
- Sherway Gardens Mall
- Square One Shopping Centre
- Scarborough Town Centre
- Bramalea City Centre
High level overview of workflow:
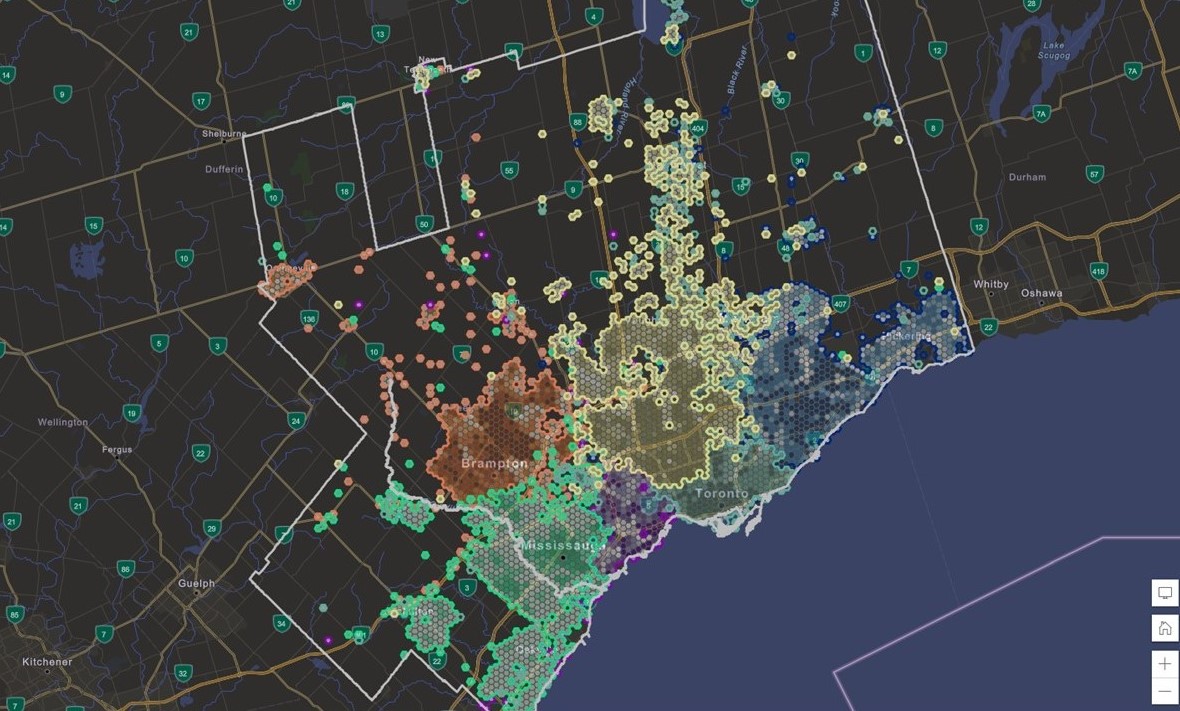
At a high level, CEL points are spatially joined to hexbins. The hexbins are generated in ArcGIS Pro and are used as “containers” for capturing the counts of CEL points. The spatial joining of points to hexbins is done using ETL software. Once the points are joined to the hexbins, we are able to determine which CEL count is the most pertinent within each hexbin. In the end, a dataset is created highlighting the extent of preference for all shopping centres in the analysis. Areas that are tied in preference are also identified and distinguished in the analysis.
Data Visualization:
The outputs from the ETL workflow can be viewed in ArcGIS Pro. Within ArcGIS Pro, the layers can be styled to differentiate six areas that indicate a preference for a particular shopping centre. Darker hexagons indicate an above average preference for a given shopping centre, whereas a lighter colour indicates places with a near average shopping location preference (Figure 2). These styled layers can then be placed in a Story Map or in a Web App where the information can be accessed and visualized by members of the organization.
Demo: Comparing preferred destinations to population density:
Areas of preference can be compared to areas where there is high or low population density in Toronto. In Figure 3 we can see that there are 20870 people/km2 in the dissemination area highlighted in cyan (Figure 3).

The Toronto Eaton Centre preference layer can be viewed in relation to densely populated areas. By selecting a hexagon in the preference layer we can see the level of preference, and selecting a hexagon that is in the same area as the previously viewed high density area we can determine through the index attribute that the area in this hexagon prefers the Toronto Eaton Centre 900% more than the shopping preference average for all of the city of Toronto. This means that this area (where the highlighted hexagon is located) has a shopping preference for Toronto Eaton Centre by more than nine times the average.
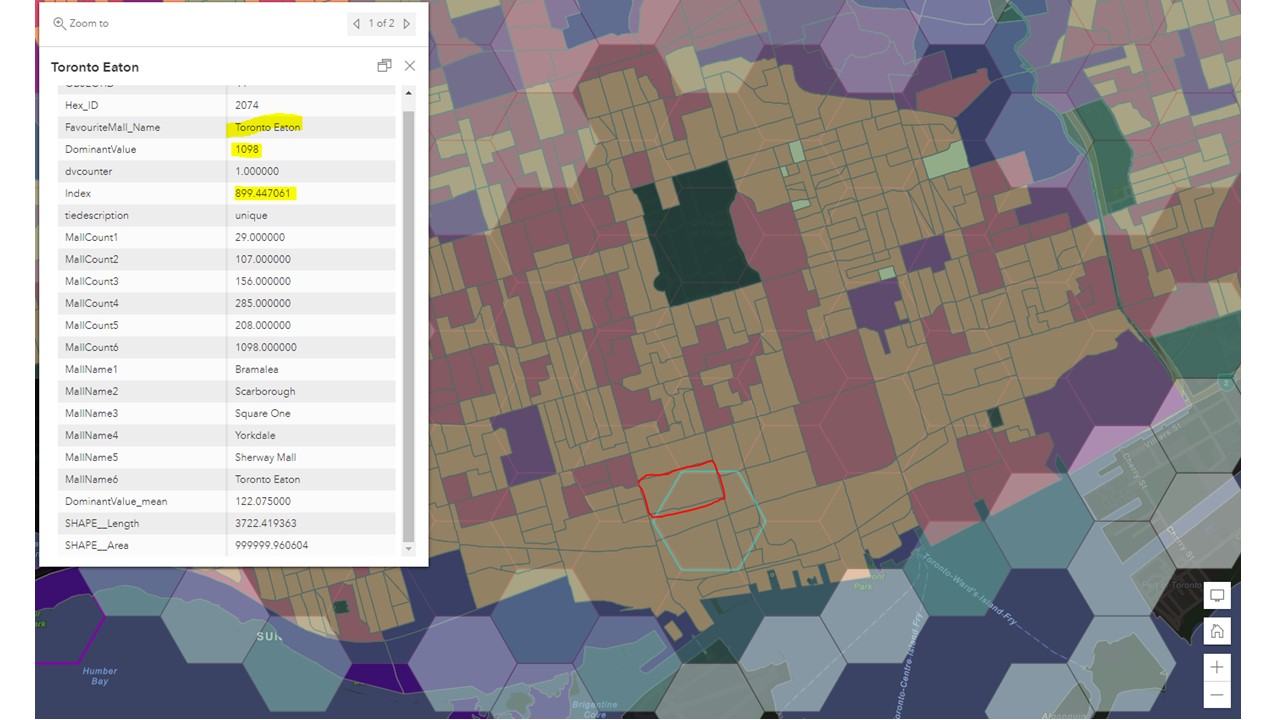
This analysis is just an example as to how the preferred mall destinations data can be viewed with variables such as population density.
Conclusion
This project around mobile data only scratches the surface of what CBRE’s Location Intelligence Team is capable of when it comes to location analytics. The in-house analysis that was developed while I interned at CBRE can be used to determine and visualize areas of preference for a given service, or areas where businesses are in direct competition with each other geographically. GIS is used not only for research purposes but for making decisions and for marketing ideas that are pertinent to one’s business. In all, this project and experience provided me with invaluable insight as to how GIS is used in commercial real estate.
References
Esri. (2020) The World Leader in Commercial Real Estate Tells a New Story. Retrieved from: https://www.esri.com/about/newsroom/publications/wherenext/the-world-leader-in-commercial-real-estate-tells-a-new-story/