
Using ArcGIS and MCDM to Generate a Residential Solar Panel Suitability Map for the City of Airdrie
Motivation Behind this Project
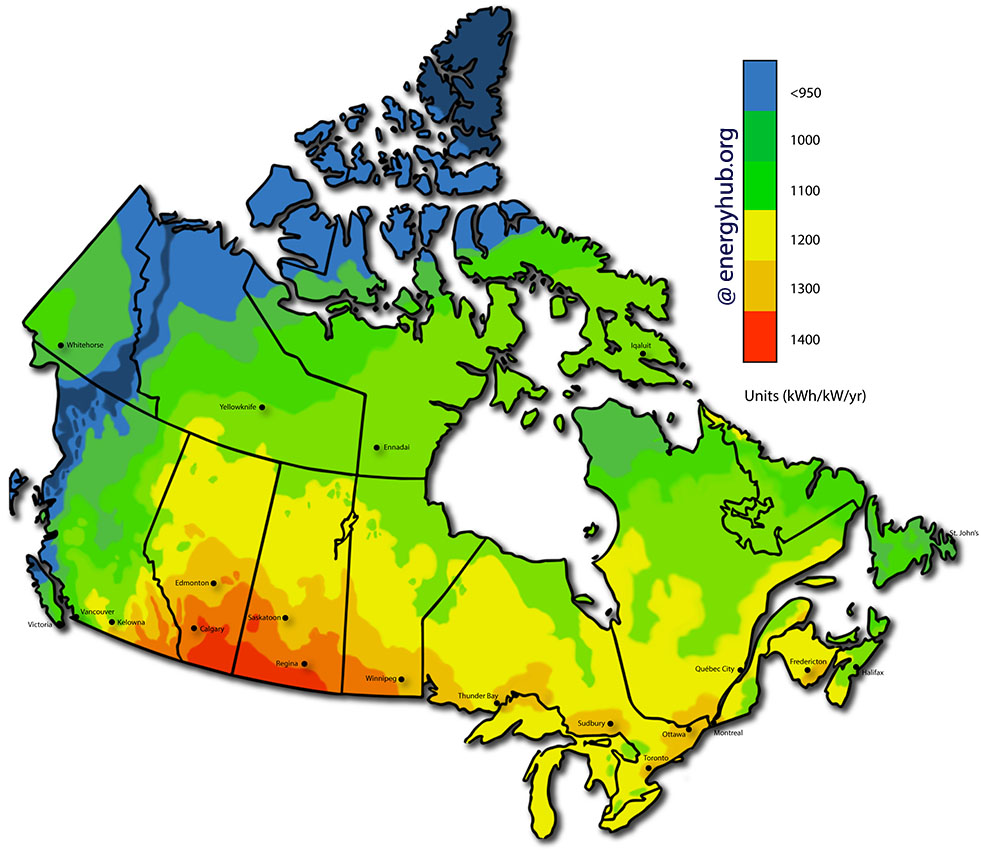
The world׳s energy demand is growing fast because of population growth and technological advancements. It is therefore important to look for a reliable, cost-effective, and renewable energy source to meet rising energy demand in the future. Solar energy, among other renewable sources of energy, is a cost-efficient energy source. Furthermore, solar energy is promising for environmental protection. Since it does not require burning fuels, solar energy is clean and free of greenhouse gas emissions, making it a good option for managing crises from climate change. The solar energy would definitely be an excellent option for meeting future energy demand since it is superior in the terms mentioned above compared to other energy sources. The solar energy industry is developing steadily throughout the world because of the high demand for energy while major energy sources such as fossil fuels are limited, and other alternative energy sources are expensive. However, Canada has a relatively small portion of Solar Capacity compared to other developed countries. According to the data from the Canada National Energy Board (NEB), only 0.5% of national electricity generation is from solar power. Thus, Canada has a huge potential to expand the solar industry, and it is therefore important to prepare strategies for promoting solar energy. The figure below shows Canada’s national solar energy map. This map is visual representations of Solar Production Potential, showing the most potential in the Canadian Prairies. Large municipalities near this region, such as Calgary, are good candidates for promoting residential solar panels.
Residential roof solar panels and solar farms are two options for utilizing solar energy. A centralized solar farm has advantages of maximizing the energy output. On the other hand, decentralized residential solar panels have several advantages. They require less land, provide energy independence to residences, and reduce burden on government budgets. For these reasons, it may be best to promote residential solar panels over centralized solar power plants.
In this project, a GIS approach was designed to analyze the rooftops in the City of Airdrie, a community north of Calgary, and determine suitable locations for installing solar panels. A suitability model for finding residences suitable for installation has was built considering multiple factors, such as solar potential, roof aspect and slope, and distance to main roads and power lines. The the model is applied to produce a suitability map identifies the optimal residences for developing solar energy. The detailed methods and results are discussed below.
Methods
Among mathematical methods that are developed for selecting the most preferable alternatives in recent decades, MCDM (Multi-Criteria Decision Making) techniques have the advantages of decision making under numerous decision criteria and multiple decision alternatives. The analytic hierarchy process (AHP), a kind of pairwise comparison method for determining relative weights for multiple factors, has been studied extensively for the last 20 years since it was developed by Saaty in 1980. AHP methods since became popular due to their wide applicability and ease of use. In the last 20 years, AHP methods have been adapted to many applications related to MCDM. In this project, the previous work of MCDM architecture and AHP methods are studied and then have been applied to produce the residential solar panel suitability map.
1. MCDM Architecture
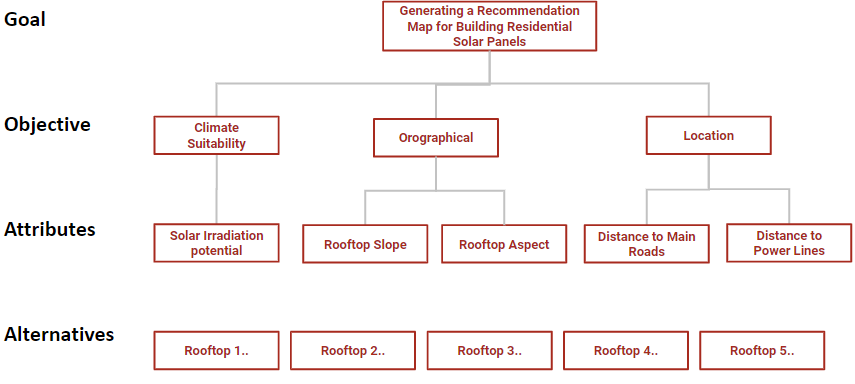
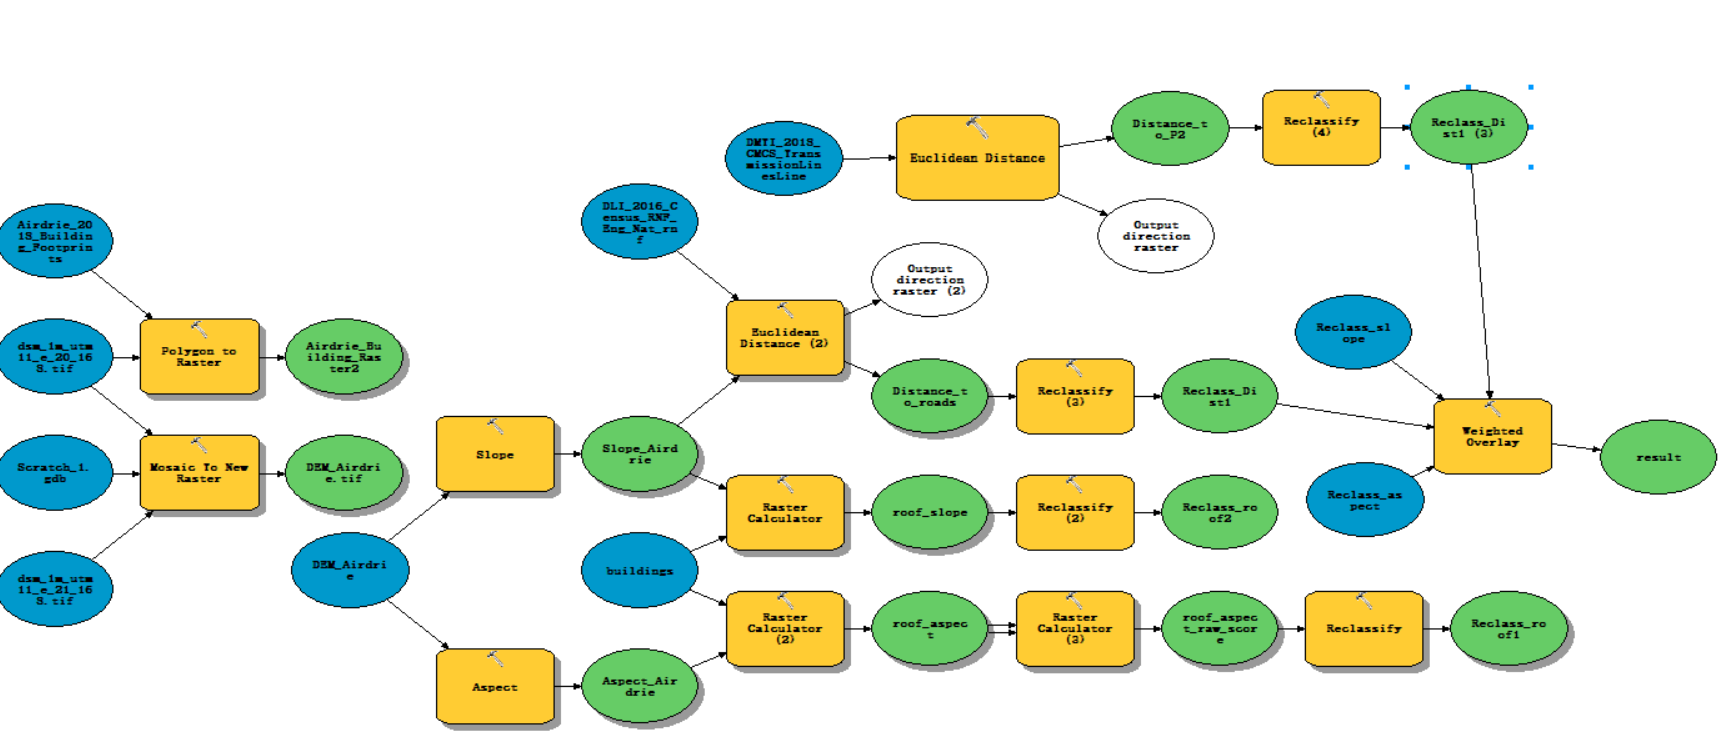
As shown in the Figure below, the overall architecture of the MCDM has been shown for this project. As noted above, generating a suitability map of the best locations for building residential solar panels is the overall goal of the project. Attributes of “Has good solar potential”, “Aspect towards the South”, “Flat slope for easy installation”, “Close to main roads” and “Close to power lines” are used for decision making. The decision alternatives are all of the possible rooftops where solar panels can be installed.
All the data used for building the suitability model are open datasets provided by the City of Airdrie. The table below shows a detailed description of the datasets used.
| Dataset | Description |
| Elevation | Raster dataset representing the digital elevation model of the area |
| Building Footprints | Feature class representing the all building shapes over the area |
| Roads | Feature class representing the linear road network for the City of Airdrie |
| Power Lines | Feature class representing the linear power lines |
1.1 Alternatives
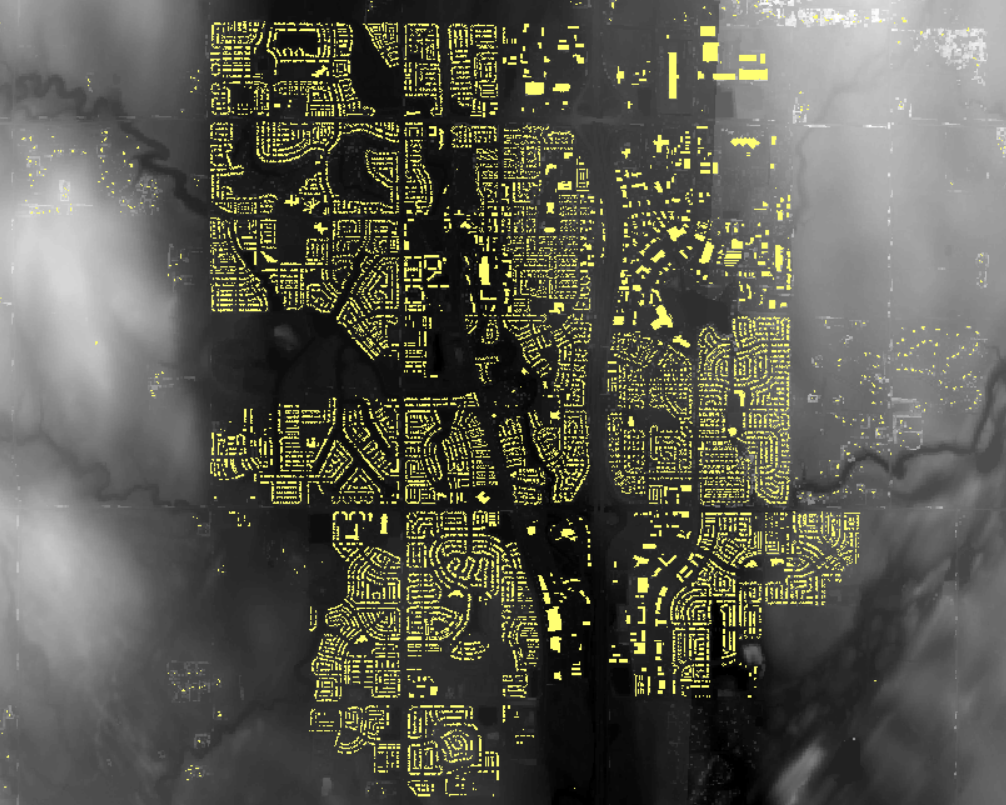
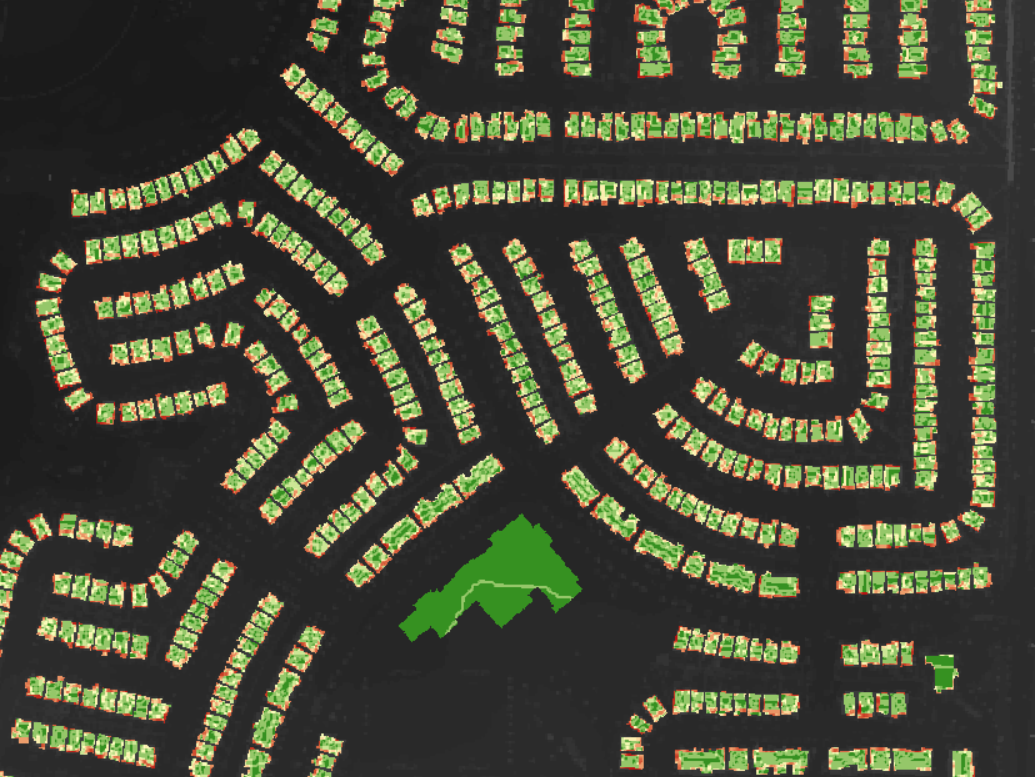
Digital elevation model (DEM) and building footprints for the city were used for determining all the alternatives. The digital elevation models were derived from LiDAR data and were saved in ArcGIS as a floating-point raster image. The roof layer is obtained by overlapping between the DEM raster layer and the building footprints layer. Since not all rooftops are suitable or available for solar panel installation, the rooftops layer has been filtered by other attributes, such as environmentally restricted areas (e.g., wildlife reservations and protection areas), culturally restricted areas (e.g., military zones and cultural heritage areas) and other restrictions (e.g., areas where equipment is already been built). The result, shown in the figure below, is a map of all rooftops that are possible alternatives for new solar panel installations.
1.2 Attributes
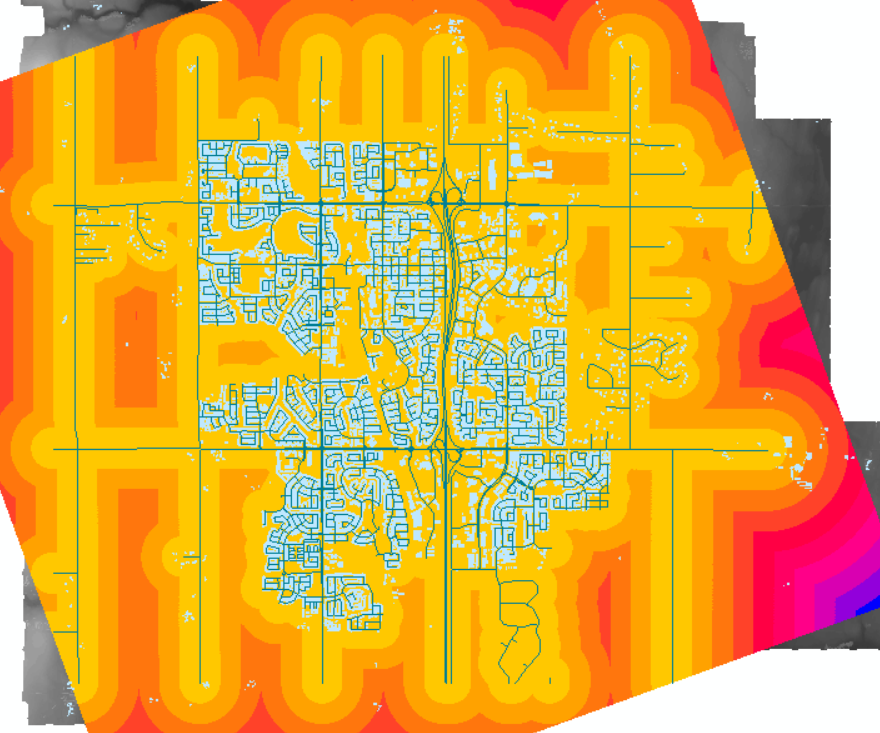
- High radiation – The location should receive, on average, at least some minimum amount of solar radiation per year.A solar map representing the amount of solar radiation within each pixel of a raster image was computed using the Area Solar Radiation tool available with the ArcGIS Spatial Analyst extension. The solar map displayed below takes into consideration the azimuth of elevation slope, the position of the sun, and any shading effect caused by buildings or other objects within input raster data.

- Suitable aspect – The aspect should be flat or facing towards the South. Because Canada is located in the northern hemisphere, solar panels located on a south-facing roof will have a higher solar power output than those located on a north-facing roof.
- Suitable slope – The slope should be less than 35 degrees. Installation is difficult on steep-slope rooftops.
- Suitable location – The location should be close to the power lines and main roads.
All these datasets are reclassified so that they can be combined together. In order to do so, these datasets need to be represented with a common measurement scale, such as 1 to 10. By using the Reclassify tool, the values are reclassified into ten equal intervals and assigned weights. The weighted values are reversed for slope and distance because lower slopes and lower distances to roads and power lines are preferred for solar panel installation. Since the solar panels should be facing south to get higher solar radiation, the suitable south-facing aspects were assigned higher weights.
2. Using AHP Methods to Determine the Criteria Weights
For the AHP method, the weights are determined by normalizing the eigenvector associated with the maximum eigenvalue of a ratio matrix. The general steps of the AHP method are:
- Development of the Pairwise Comparison Matrix
- Computation of the Criterion Weights
- Estimation of the Consistency Index (CI) Value
First, the four evaluation criteria were compared in a pairwise manner to produce the pairwise comparison matrix displayed in the Table below. The values in each row indicate the importance of the criterion identified in the left-hand column relative to the corresponding criterion identified in each column header. For example, since getting high solar potential will be three times more important than the distance to the main roads when deciding whether the rooftops are good for building solar panels, a value of 3 was assigned to the ratio of “solar energy potential” to “the distance to main roads”.
| Criteria | High Solar Potentials | Flat Slope | Aspect toward South | Close to Power Lines | Close to Main Roads |
| High Solar Potentials | 1 | 2 | 3 | 4 | 5 |
| Flat Slope | 1/2 | 1 | 2 | 3 | 4 |
| Aspect toward South | 1/3 | 1/2 | 1 | 2 | 2 |
| Close to Power Lines | 1/4 | 1/3 | 1/2 | 1 | 1 |
| Close to Main Roads | 1/5 | 1/4 | 1/2 | 1 | 1 |
After normalization and weight averaging, the weights for the five criteria are calculated. The detailed calculation steps are shown in the table below, where criteria for High Solar Potentials, Flat Slope, Aspect toward South, Close to Power Lines, and Close to Main Roads are represented as A, B, C, D, and E respectively. Three steps are represented as three different colours (green is the original pairwise weight, orange is the normalized value, and the average normalized weight (w) is purple).
| Criteria | A | B | C | D | E | A | B | C | D | E | w |
| A | 1 | 2 | 3 | 4 | 5 | 0.44 | 0.49 | 0.43 | 0.36 | 0.38 | 0.42 |
| B | 1/2 | 1 | 2 | 3 | 4 | 0.22 | 0.24 | 0.29 | 0.27 | 0.31 | 0.27 |
| C | 1/3 | 1/2 | 1 | 2 | 2 | 0.15 | 0.12 | 0.14 | 0.18 | 0.15 | 0.15 |
| D | 1/4 | 1/3 | 1/2 | 1 | 1 | 0.11 | 0.08 | 0.07 | 0.09 | 0.08 | 0.09 |
| E | 1/5 | 1/4 | 1/2 | 1 | 1 | 0.09 | 0.06 | 0.07 | 0.09 | 0.08 | 0.08 |
| SUM | 2.28 | 4.08 | 7.00 | 11.00 | 13.00 | 1.00 | 1.00 | 1.00 | 1.00 | 1.00 | 1.00 |
3. Using SAW Method to Generate the Final Suitability Map
After determining the weights of each attribute, an overall score must be calculated based on the criteria and the weights. The data for each attribute was previously reclassified using a linear transformation process so that all criteria are represented in equal intervals as values ranging from 1 to 10. After calculating all standardized scores from all the attributes, the overall score is calculated using the Simple Additive Weighting (SAW) method. The result of this is an overall score calculated for all alternatives. Locations with relatively high scores will be considered most suitable for building residential solar panels, while locations with low scores will not be suitable. The output from this process is used to generate the final suitability map.
Result and Discussion
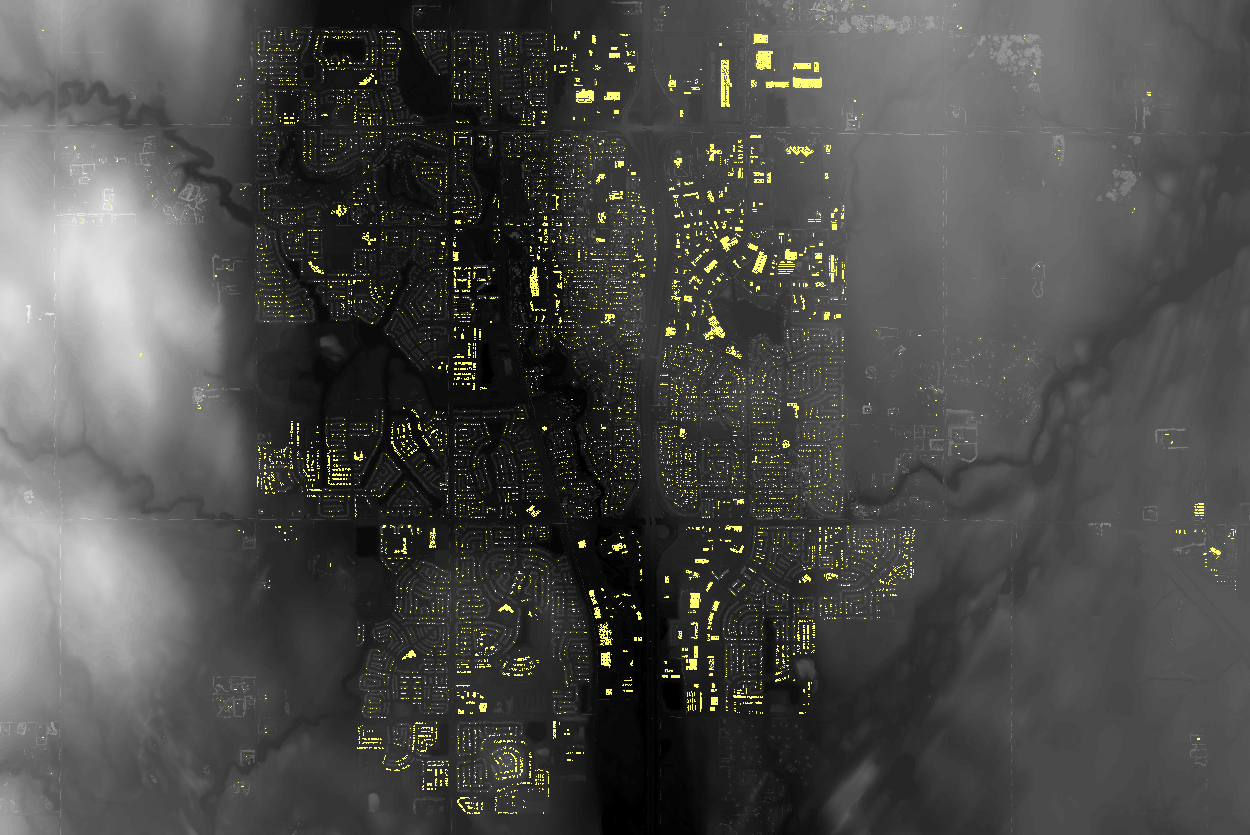
A preliminary suitability map has been generated, showing optimal buildings where solar panels can be installed on the rooftops. Different levels of colors are used to present the suitability levels. The most suitable locations are represented in bright yellow, while unsuitable locations are represented in dark red and blue. It can be seen that the buildings with relatively large flat rooftop areas are determined to be more suitable by the model because these buildings will have more chances to have the good aspects and slope for solar panel installations.

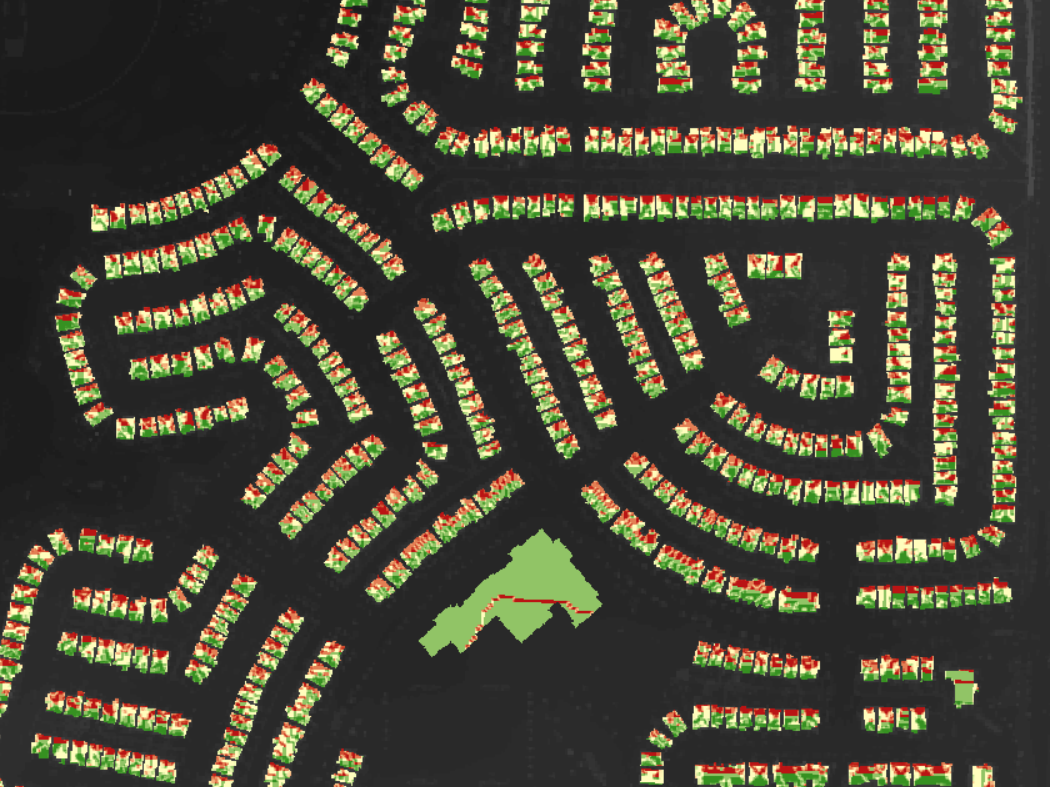
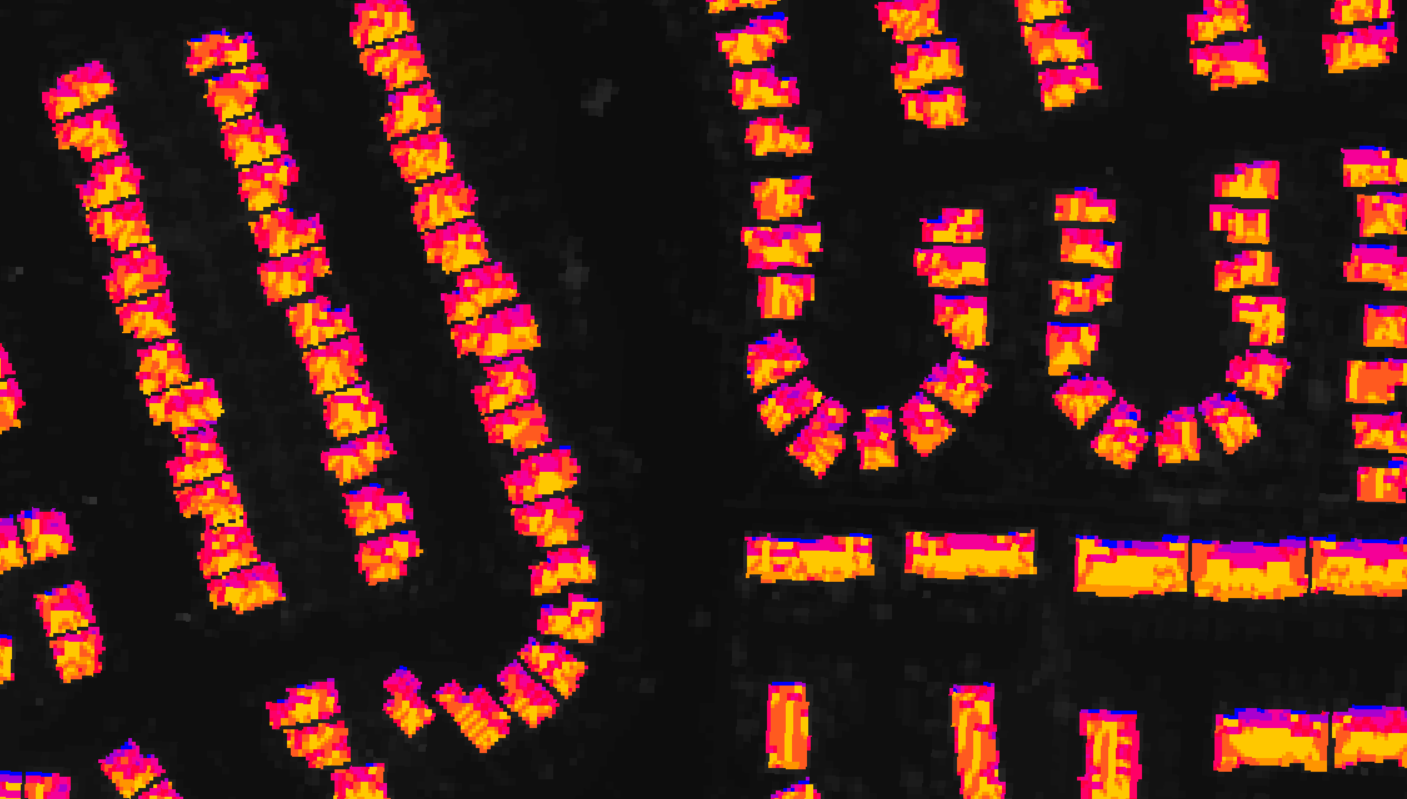
The figure below shows the suitability results for small residences. Even though some small residences do not appear suitable at small scales, the rooftops of those residences still have surfaces that have relatively high suitability. Residences usually have roofs with different aspects, where one side faces towards the south and the other one faces towards the north. When viewed at larger scales, the south-facing sides with higher solar potential that are considered most suitable by the model can be distinguished from the north-facing sides that are not suitable.
The final step was to compute whether each residence has a large enough suitable area to install solar panels. The Con tool has been used for selecting the areas with the highest suitability level. Then, after converting the raster to polygons, the Select Layer by Attribute tool was used to filter the polygons by shape area. Only residences with an area larger than 20 m2 identified as suitable by the model will be considered for installing solar panels. The figure below shows the final map identifying all suitable residences.
References:
[1] Nadarajah, K., Divagar, V. (2016). Solar energy for the future world: – A review. Renewable and Sustainable Energy Reviews. Volume 62, September 2016, Pages 1092-1105. https://doi.org/10.1016/j.rser.2016.05.022
[2] National Energy Board. “Canada’s Adoption of Renewable Power Sources – Energy Market Analysis.” NEB, 13 Sept. 2018, www.neb-one.gc.ca/nrg/sttstc/lctrct/rprt/2017cnddptnrnwblpwr/slr-eng.html.
[3] “Solar Energy Maps Canada (Every Province).” Energyhub.org, Energyhub.org, 10 Feb. 2019, energyhub.org/solar-energy-maps-canada/.
[4] “Average Salary in Regina, Saskatchewan, Canada.” Regina, Saskatchewan Salary, Average Salaries | PayScale Canada, www.payscale.com/research/CA/Location=Regina-Saskatchewan/Salary.
[5] St-Onge, Josee. “Median Income Higher in Edmonton than in Calgary in 2016, StatsCan Reports | CBC News.” CBC News, CBC/Radio Canada, 13 Mar. 2018, www.cbc.ca/news/canada/edmonton/economy-income-calgary-edmonton-2016-employment-1.4574667.
[6] “Rooftop Solar Panels vs. Solar Farms.” Solar Power Authority, 15 Feb. 2019, www.solarpowerauthority.com/rooftop-solar-vs-solar-farms/.
[7] Piotr Jankowski (1995) Integrating geographical information systems and multiple criteria decision-making methods, International Journal of Geographical Information Systems, 9:3, 251-273, DOI: 10.1080/02693799508902036
[8] Eshlaghy, Abbas & Homayonfar, Mahdi. (2011). MCDM Methodologies and Applications: A Literature Review from 1999 to 2009. 21.
[9] W. Ho, Integrated analytic hierarchy process and its applications—a literature review, European Journal of Operational Research, 186 (2008), pp. 211-228
[10] O.S. Vaidya, S. Kumar, Analytic hierarchy process: An overview of applications, European Journal of Operational Research, 169 (1) (2006), pp. 1-29
[11] S.D. Pohekar, M. Ramachandran, Application of multi-criteria decision making to sustainable energy planning—a review. Renewable and Sustainable Energy Reviews, 8 (2004), pp. 365-381
[12] J.R. Janke. Multicriteria GIS modelling of wind and solar farms in Colorado. Renewable Energy, 35 (2010), pp. 2228-2234
[13] García-Cascales, M. Socorro & Sánchez-Lozano, J.M.. (2013). Geographical Information Systems (GIS) and Multi-Criteria Decision Making (MCDM) methods for the evaluation of solar farms locations: a Case study in south-eastern Spain. Renewable and Sustainable Energy Reviews. 24. 544. 10.1016/j.rser.2013.03.019.
[14] Mevlut Uyan, GIS-based solar farms site selection using analytic hierarchy process (AHP) in Karapinar region, Konya/Turkey, Renewable and Sustainable Energy Reviews, Volume 28, 2013, Pages 11-17, ISSN 1364-0321, https://doi.org/10.1016/j.rser.2013.07.042.
[15] Chen, C., Huang, C., Tsuei, H., & Jwo, C.S. (2015). A Hybrid MCDM Model for Improving GIS-Based Solar Farms Site Selection.
[16] “ArcUser Online.” Locating Sites for Photovoltaic Solar, www.esri.com/news/arcuser/1010/solarsiting.html.
[17] Marsh, Jacob. “Solar Farms: What Are They and How Much Do They Cost? | EnergySage.” Solar News, EnergySage, 28 Feb. 2019, news.energysage.com/solar-farms-start-one/.
[18] National Energy Board. “Canada’s Adoption of Renewable Power Sources – Energy Market Analysis.” NEB, 13 Sept. 2018, www.neb-one.gc.ca/nrg/sttstc/lctrct/rprt/2017cnddptnrnwblpwr/slr-eng.html.
[19] National Energy Board. “Canada’s Energy Future 2016: Update – Energy Supply and Demand Projections to 2040.” NEB, 13 July 2018, www.neb-one.gc.ca/nrg/ntgrtd/ftr/2016updt/index-eng.html.
[20] Ozgur. “Where Is the Best Location on Earth for Solar Energy?” Sunmetrix, sunmetrix.com/where-is-the-best-location-on-earth-for-solar-energy/.
[21] “Planning a Home Solar Electric System.” Energy.gov, www.energy.gov/energysaver/planning-home-solar-electric-system.
[22] Sendy, Andrew. “Are Solar Panels for Your Home Worth It in 2019?” Solar Reviews, Solar Reviews, 11 Feb. 2019, www.solarreviews.com/blog/residential-solar-panels-for-your-home-compelling-in-2019.
[23] “Solar Energy: What You Need to Know.” EnergySage, www.energysage.com/solar/.
[24] “Solar Power – Unlimited Source of Energy.” Fortum, www.fortum.com/about-us/our-company/our-energy-production/solar-power-unlimited-source-energy.
[25] “Solar Power by Country.” Wikipedia, Wikimedia Foundation, 15 Apr. 2019, en.wikipedia.org/wiki/Solar_power_by_country.
[26] Spector, Julian, and CityLab. “7 Things to Know Before Installing Solar Panels on Your Roof.” CityLab, 6 Apr. 2016, www.citylab.com/life/2016/04/want-solar-panels-on-your-roof-heres-what-you-need-to-know/476805/.
Open Data:
[27] High Resolution Digital Elevation Model (HRDEM) – CanElevation Series: https://open.canada.ca/data/en/dataset/957782bf-847c-4644-a757-e383c0057995
[28] City of Airdrie Open Data: http://data-airdrie.opendata.arcgis.com/search?collection=Dataset