
The Upscaling of Winter Wheat Aboveground Nitrogen Content Estimation Using Geostatistical Analysis
Introduction
Nitrogen is the most essential and demanded nutrient for plants [1]. It is also one of the most costly to supply, making commercial fertilizers a major expense in agriculture [2]. Nitrogen deficiency reduces crop growth and yields [3], while overapplication may have unwanted environmental impacts and cost of production [4]. Therefore, managing nitrogen fertilizers effectively is crucial to addressing the challenges of food security, environmental degradation, and climate change [5]. The most accurate way to measure plant nitrogen levels is through destructive point sampling, however, this method is impractical for large fields due to its destructive nature. Instead, conducting systematic point sampling and geostatistical analysis can be used to effectively estimate nitrogen levels across agricultural fields. In this post, the process of performing “Geostatistical Interpolation” using ArcGIS Pro for this purpose will be demonstrated.
Study Area & Data
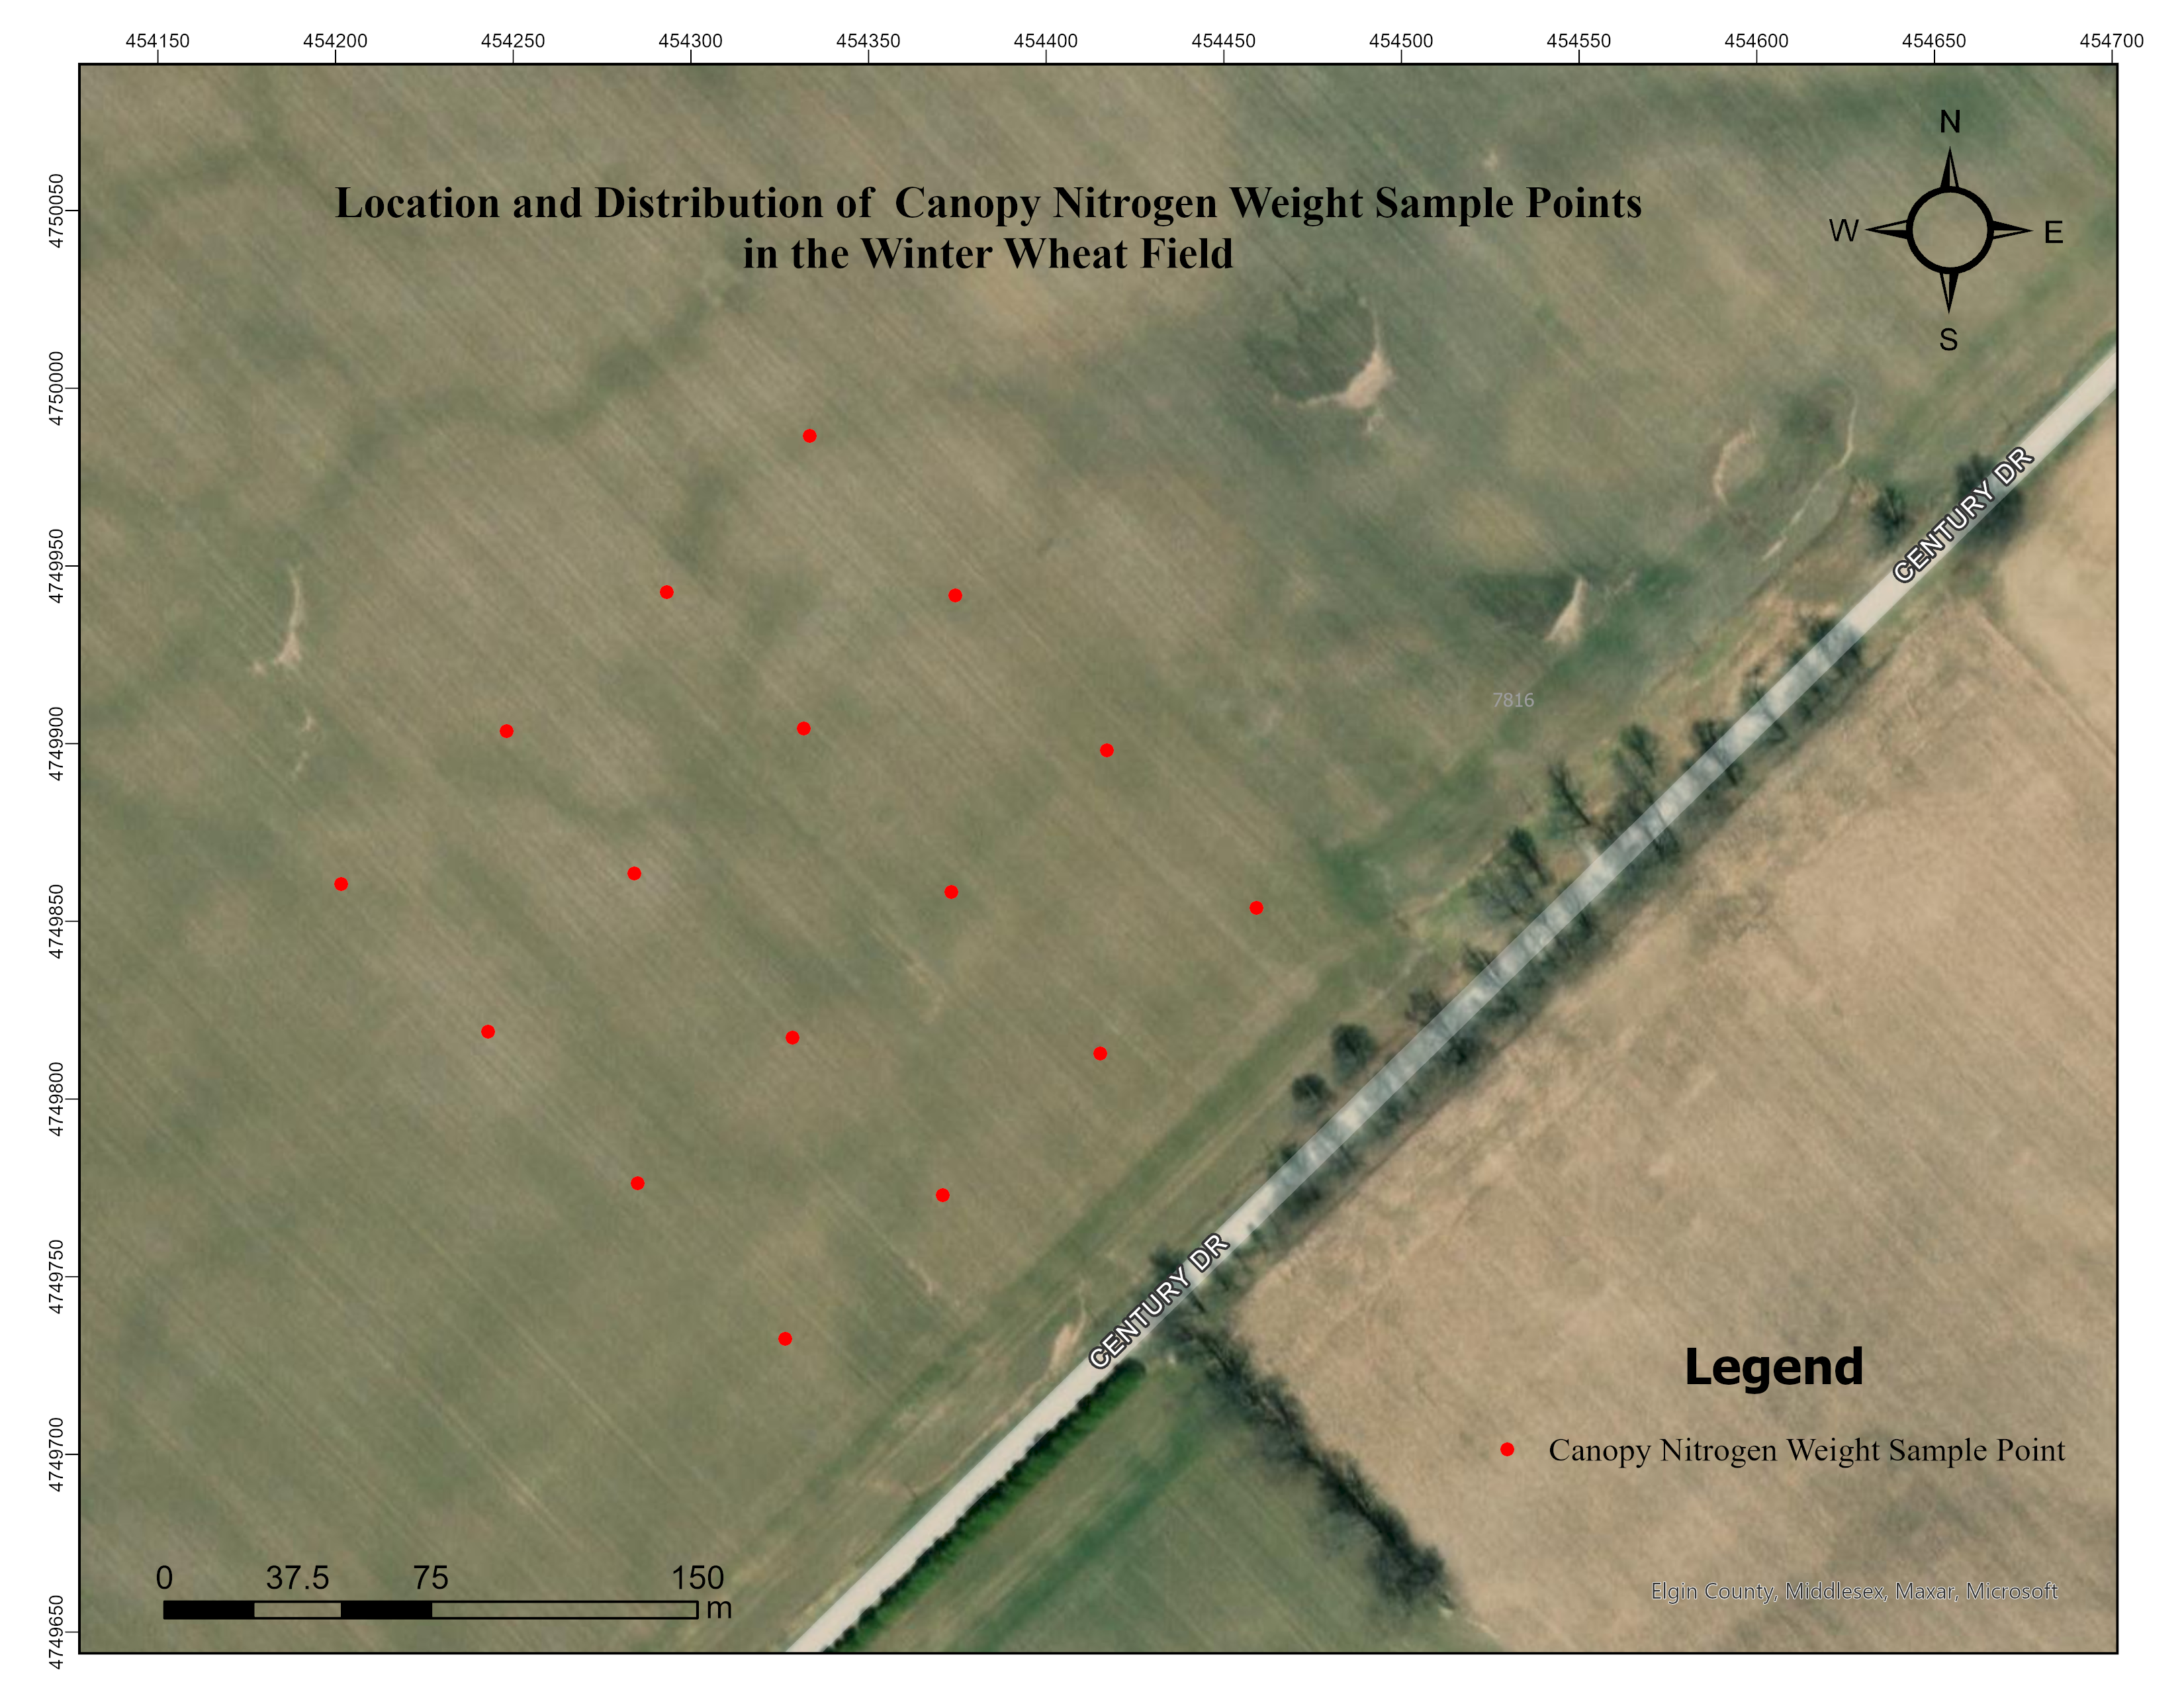
The sample points included 16 locations within a Winter Wheat agricultural field about 25 km west of London, Ontario, Canada. The sampling was arranged in a 4×4 grid with 60-meter spacing between each point. Plants were destructively sampled by cutting at the stem base above ground and then taken to a laboratory to determine leaf nitrogen content percentages using the nitrogen combustion method. The following figure shows the location and distribution of point sampling with the Winter Wheat field.
Methodology
The geostatistical analysis is based on statistical models incorporating autocorrelation, representing the statistical interconnections among measured points. These methods have the ability to generate predictive maps and offer insights into the accuracy of these predictions. Kriging, as an advanced geostatistical technique, generates an estimated surface from a scattered set of points with known values. Kriging operates under the presumption that the distance or direction between sample points reflects a spatial correlation that can be used to explain across the terrain. The Kriging tool involves the fitting of a mathematical function to a designated subset of points, or all points within a predefined radius, to determine the output value for each geographical location. Kriging constitutes a multistep process encompassing exploratory statistical analysis of the data, (semi)variogram modeling, creating the surface, and exploring a variance surface [6,7].
The geostatistical analysis and interpolation were conducted in ArcGIS Pro using Geostatistical Wizard. Initially, semi-variogram parameters namely, nugget (C0), sill (C + C0), and range were estimated to represent the spatial distribution of field crop nitrogen weight sampling. Then, several semi-variogram models, including circular, spherical, tetraspherical, pentaspherical, exponential, Gaussian, rational quadratic, hole effect, k-Bessel, J-Bessel, and stable, were evaluated and the best-fit model with the lowest root-mean-square error (RMSE) was selected. Finally, the data was interpolated using the best-fit model and ordinary kriging (OK) procedure.
Result
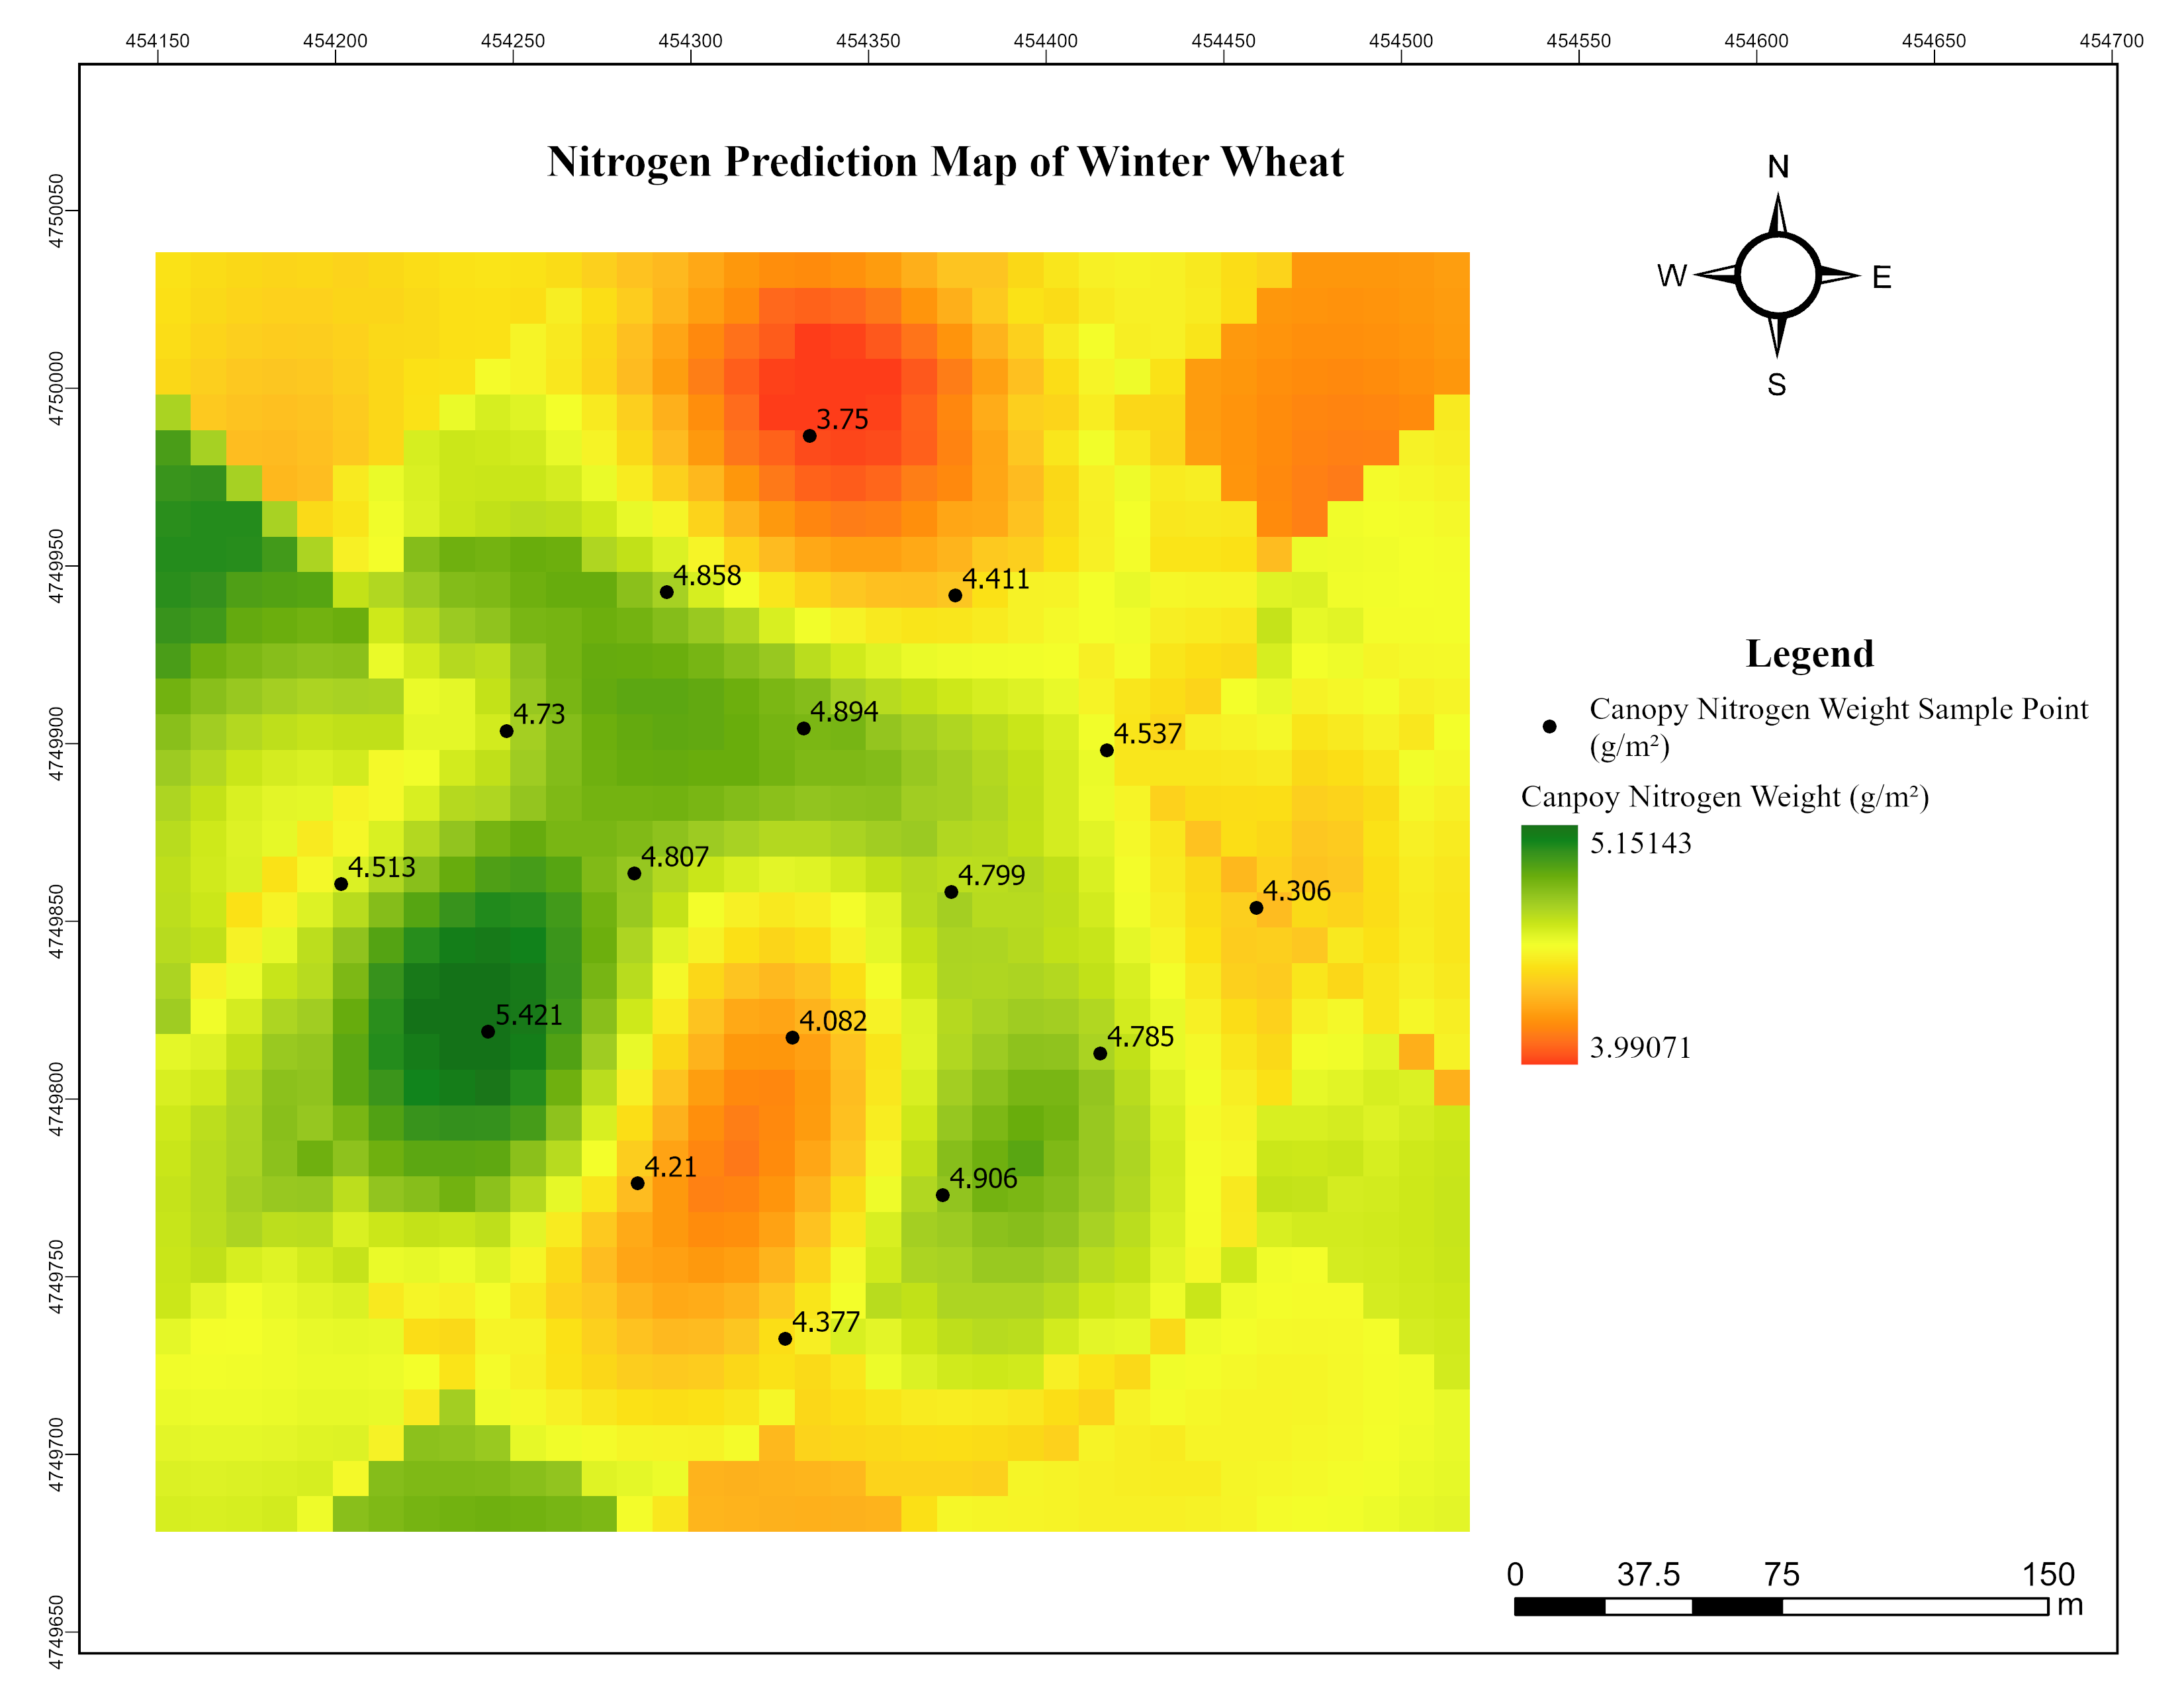
The best-fit model for the point data was the Hole-Effect model, selected based on the minimum RMSE. The Nugget/Sill ratio indicates the degree of spatial autocorrelation: values below 25% suggest strong dependence, 25-75% indicate moderate dependence, and above 75% indicate weak dependence [8]. The data showed strong spatial dependence with a value of 23%. The semi-variogram range, the distance over which samples are correlated [9], was 147.98 meters. A low Nugget/Sill ratio and a high range generally indicate that kriging will yield high precision [8]. The following figure shows the Winter Wheat canopy nitrogen weight map predicted using the OK method.
Summary
This post assessed the potential of converting point-based field data to continuous raster-based data using geostatistical analysis. The resulting maps can be useful in various agricultural practices, such as variable-rate nitrogen fertilization and other management applications.
References
- H. Marschner, Marschner’s mineral nutrition of higher plants. Academic press, 2011.
- C. R. Bryant et al., “Adaptation in Canadian agriculture to climatic variability and change,” Societal adaptation to climate variability and change, pp. 181-201, 2000.
- F. d. S. Pereira et al., “Nitrogen variability assessment of pasture fields under an integrated crop-livestock system using UAV, PlanetScope, and Sentinel-2 data,” Computers and Electronics in Agriculture, vol. 193, p. 106645, 2022.
- K. Lutes, M. Oelbermann, N. Thevathasan, and A. Gordon, “Effect of nitrogen fertilizer on greenhouse gas emissions in two willow clones (Salix miyabeana and S. dasyclados) in southern Ontario, Canada,” Agroforestry Systems, vol. 90, pp. 785-796, 2016.
- X. Zhang, E. A. Davidson, D. L. Mauzerall, T. D. Searchinger, P. Dumas, and Y. Shen, “Managing nitrogen for sustainable development,” Nature, vol. 528, no. 7580, pp. 51-59, 2015.
- M. A. Oliver and R. Webster, “Kriging: a method of interpolation for geographical information systems,” International Journal of Geographical Information System, vol. 4, no. 3, pp. 313-332, 1990.
- P. A. Burrough, “Principles of geographical,” Information systems for land resource assessment. Clarendon Press, Oxford, 1986.
- C. A. Cambardella et al., “Field‐scale variability of soil properties in central Iowa soils,” Soil science society of America journal, vol. 58, no. 5, pp. 1501-1511, 1994.
- S. Reza, D. Nayak, S. Mukhopadhyay, T. Chattopadhyay, and S. Singh, “Characterizing spatial variability of soil properties in alluvial soils of India using geostatistics and geographical information system,” Archives of Agronomy and Soil Science, vol. 63, no. 11, pp. 1489-1498, 2017.