
Emergency Response at the University of Western Ontario: Accessibility Analysis of Code Blue Emergency Phones
Background
University campuses are busy places, with thousands of students and faculty frequenting the grounds every day – and the University of Western Ontario is no exception. With 38,000 students enrolled in the Fall of 2022, this large number of young adults brings numerous safety concerns. (Western Communications, 2022). The following campus safety concerns were retrieved from the National Center for Education Statistics (2015):
- Burglaries
- Sexual Assault
- Hate crimes
- Motor Vehicle Thefts
- Aggravated Assaults
- Robberies
Campus safety is paramount in ensuring a productive learning environment and nurturing a healthy community. The University of Western Ontario has implemented measures to combat these concerns ( https://www.uwo.ca/campus_life/campus-safety.html ) :
- Student Emergency Response Team (SERT)
- Western Foot Patrol
- Alert WesternU
- Code Blue Emergency Phones (CBEP)
- Special Constable Service
However, these measures are not accessible from all areas of campus, nor are they easy to locate. Not all areas are quickly accessible from the Campus Police headquarters. There is a lack of up-to-date safety materials on the University website as well, further accentuating the issue of accessibility.
This study aims to identify vulnerable areas of campus through mapping the spatial accessibility of Code Blue Emergency Phones and response times from Campus Police headquarters.
This study is evaluated by answering the following questions:
What CBEP features are accessible within a given walking time on campus grounds?
What areas of campus are are accessible within a given drive time on campus grounds originating from Campus Police headquarters?
Data
Code Blue Emergency Phones
- There are 29 Code Blue Emergency Phones (CBEP) on Western campus
- No existing georeferenced data
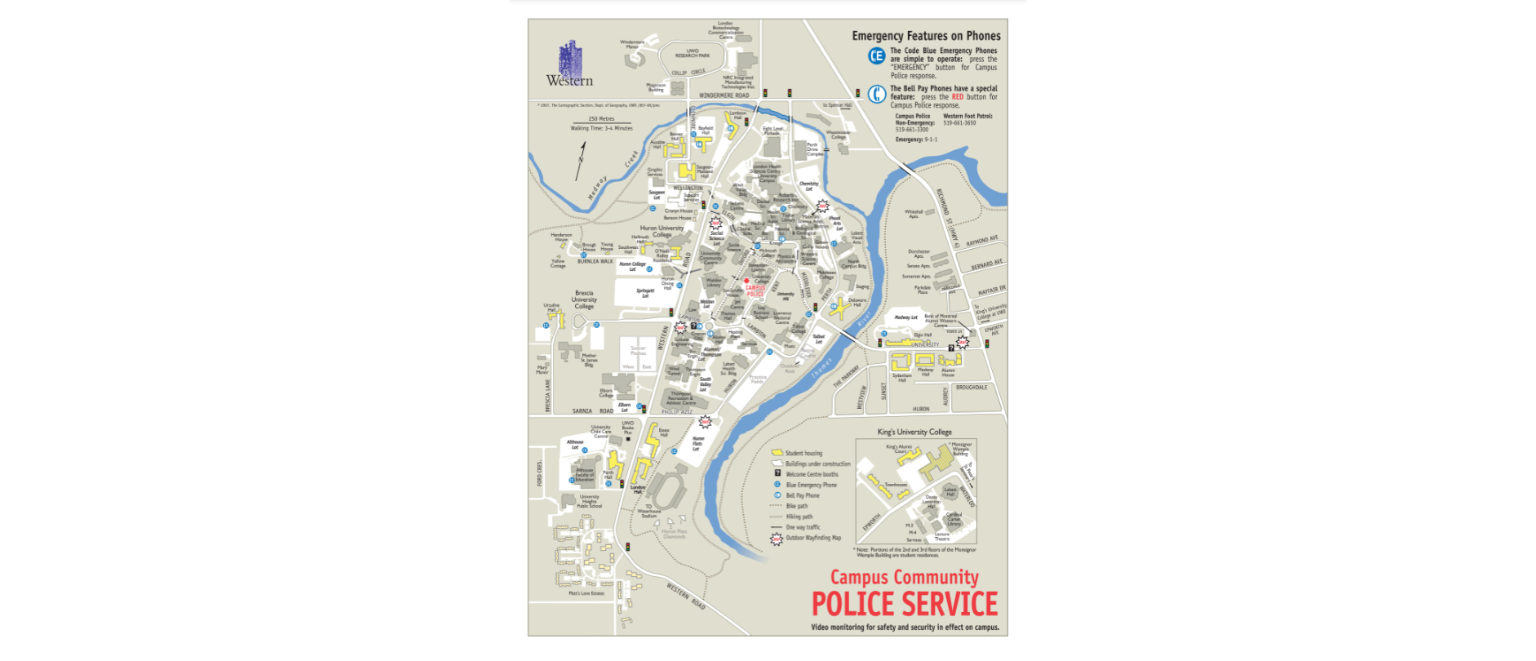
- Maps provided on the University of Western Ontario website are out of date (Fig. 1)
- University web resources were used to determine approximate locations of phones
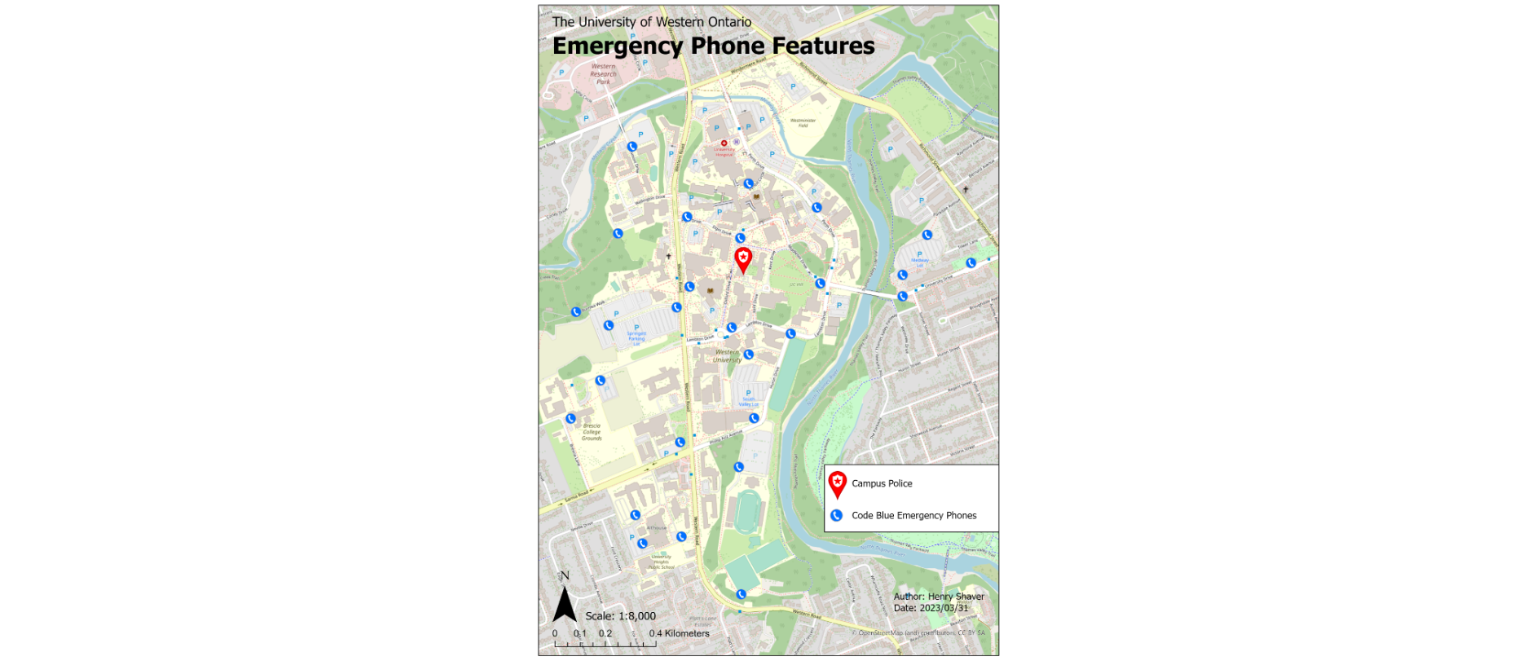
- Manually collected point location data of CBEP
- Used ESRI FieldMaps mobile application
- Identified 27 CBEP locations
- Location inside the Alumni Stadium could not be identified
- Location reported as “southeast of the Mustangs Field” could not be found
Campus Topography
- Campus building data used in this study
- Sourced from OpenSteetMap ( https://www.openstreetmap.org/ )
- Data extracted using BBBike.org ( https://extract.bbbike.org/ )
Network Dataset
- Used to preform accessibility analysis
- Source: ArcGIS Server Network Analysis service
Methods
The methodology used to delineate levels of spatial accessibility was derived from a 2021 study that measured changes in transit accessibility to food banks in Toronto during COVID-19. (Allen & Farber, 2021). Researchers used a fine-grained hexagonal grid in order to map accessibility to food banks with even spatial representation across the entire city. For their analysis, one-way travel times by public transit were estimated from the centroid of each hexagon cell to the nearest food bank for different time periods. Travel times were computed using the transportation network routing software r5r.
This study utilizes a low resolution square grid in order to map accessibility to CBEP features with even spatial representation across campus grounds. Each cell in the grid has a length and height of 54 meters and there are 923 of these cells in total across the University of Western Ontario. Spatial accessibility is measured as the one-way travel time by walking to the nearest emergency phone in minutes from cell centroids of campus areas. Travel times were computed using the Network Analyst tool in ArcGIS Pro.
The following ArcGIS Pro toolboxes were used in this study:
- Analysis tools
- Data Management tools
- Editing tools
- Network Analyst tools
- Spatial Analyst tools
Steps
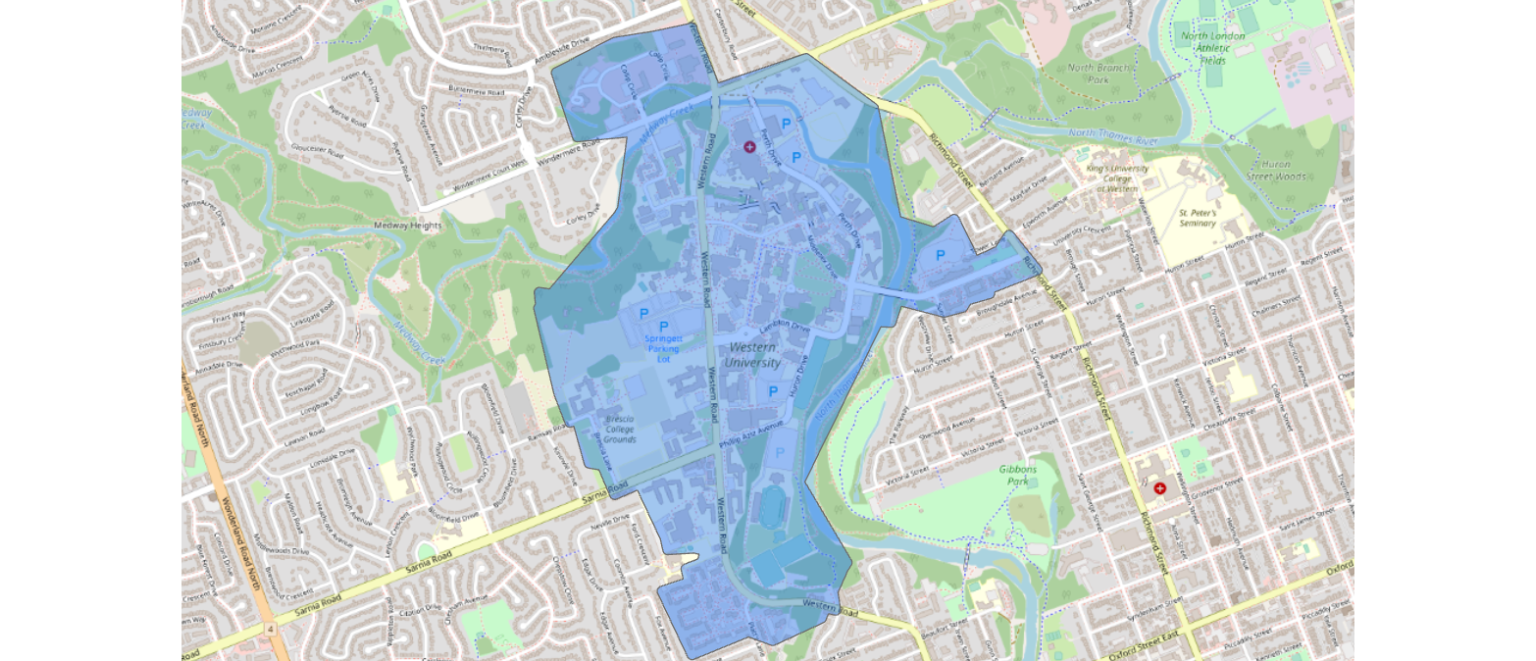
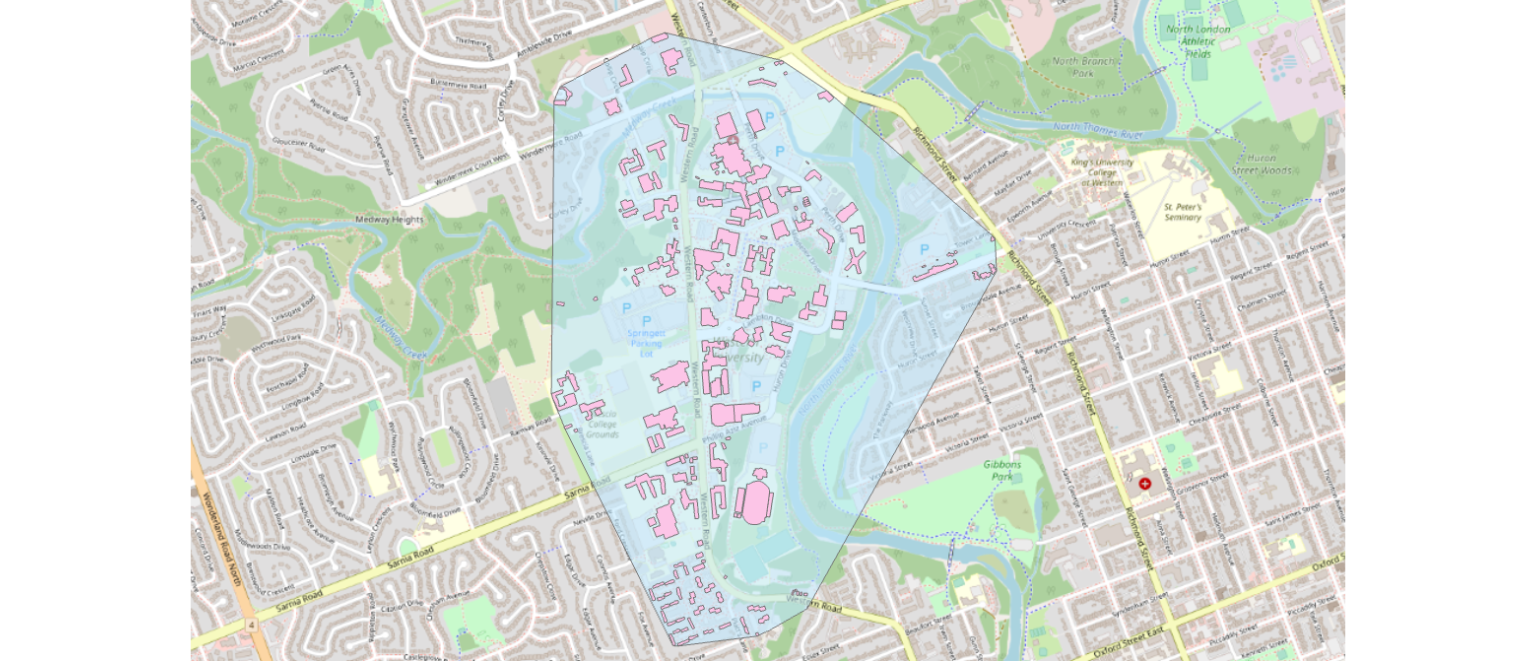
1) Firstly, the study boundary was created. A maximum convex hull was generated using Minimum Bounding Geometry tool and the building shapefiles as input. (Fig. 3) However, this did not cover all areas of campus, so additional smaller polygon features were created. These were done manually with cross-references to campus maps, building shapefiles, and the OpenStreetMap basemap. The boundary was buffered 10 meters to encompass roads near campus. (Fig. 4)
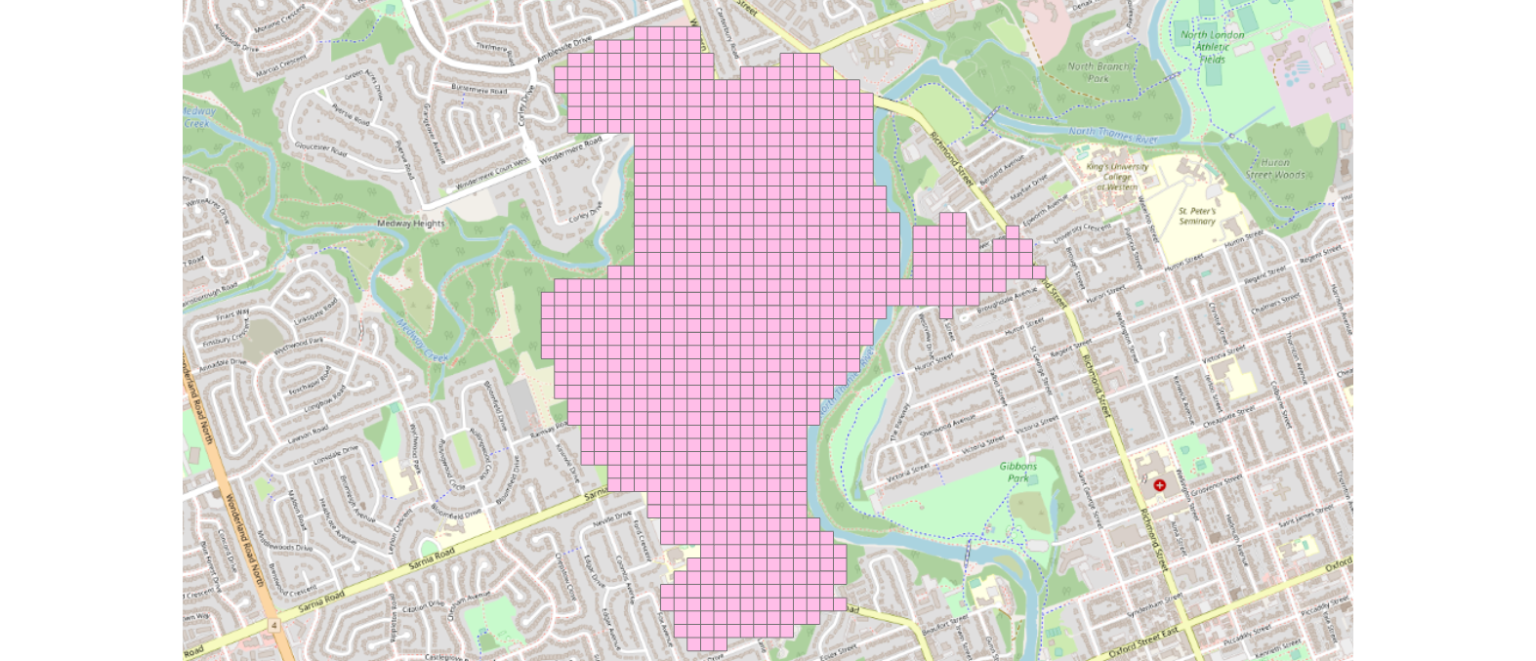
2) A fishnet grid was then generated using the Create Fishnet tool. Cell sizes were important to consider in this analysis, as the study area is small, and foot traffic and walkability is unique but present at different locations across campus. “The choice of suitable grid size is very important, as the resolution must be fine enough to capture the desired spatial variation (…) within the area of interest. ” (Dong et al., 2017). Additionally, “(…) data redundancy will be generated if the grid size is less than the size of the areal unit” with areal units defined as a block, parcel, or residential building.
The areal unit in for this study was determined to be campus building size. Cell size was determined by taking the square root of the average building size over 500 meters squared.
Grid cell dimensions = √ (Σ Building Size / # Buildings)
3) Fishnet grid cell polygons and centroid points were then clipped to the study area. Polygons that were over water bodies or nearby natural lands were removed. (Fig. 5)
4) A new Network Analysis layer was generated as an Origin-Destination Cost Matrix. Fishnet grid cell centroids were inputted as origin points, and CBEP features as destination points. The cutoff time was set at the desired walk time interval. Travel mode was set to walking time. Date and time were not specified, as campus is occupied at all times of the day and week. Straight lines were generated representing links between origin and destination points.
5) The Origin-Destination (OD) Cost Matrix was computed a total of 6 times. Lines were generated and exported for walk times of 1 minute, 2 minutes 30 seconds, and 5 minutes with destinations as CBEP features and origins as fishnet centroids.
Walk time intervals were determined on the basis of crime duration data from the 2014 General Social Survey on Victimization conducted by Statistics Canada. This was done to quantify response times to ongoing incidents. The median duration of assault was reported as approximately 1 minute and 15 seconds. (Statistics Canada, 2014). This was rounded down to 1 minute for simpler map interpretation. The next interval was set at 2 minutes 30 seconds, this time on the basis of median violent crime (assault, robbery, and sexual assault) duration. (Statistics Canada, 2014). The median duration of a break-in and theft in Canada is approximately 8 minutes. This number was used to inform the final interval as longer-duration crime, with the final interval ultimately rounded down to 5 minutes for easy result interpretation. (Statistics Canada, 2014).
In order to measure response time from Campus Police, analysis was repeated with the same intervals with destinations as fishnet centroids and origin as the Campus Police headquarters.
6) Join fields were added to the output lines and polygon cells to ensure features were properly matched. A table join was preformed for each analysis between OD output lines and a unique base polygon grid. Cell attributes containing line origin information were selected and exported as a shapefile. This was repeated 6 times.
7) Since not all cells were reached at the given time intervals, the “greater than” cells were computed by erasing 1 minute, 2 minute 30 second, and 5 minute polygons from the base polygon feature.
8) Walk and drive-time polygons of separate features included the same features present within a shorter specified mobility-time interval. To solve this, an erase was preformed on each layer, excluding cells with a lesser mobility-time.
9) “Greater than” drive and walk time polygons were overlain and an intersect was preformed to identify areas with low temporal accessibility.
10) Once output data had been properly formatted, each shapefile was exported and uploaded to ArcGIS Online for further visual interpretation.
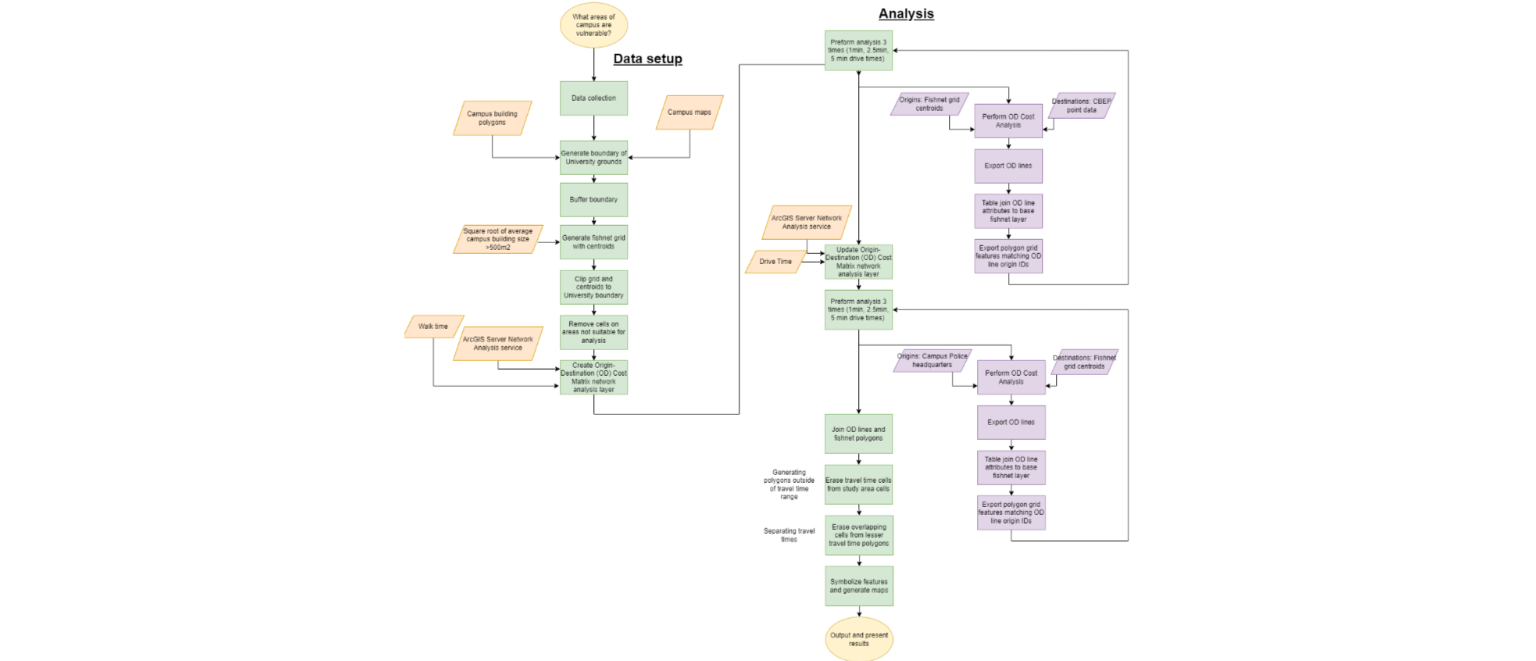
Below is a flowchart representing the process of analysis.
Results
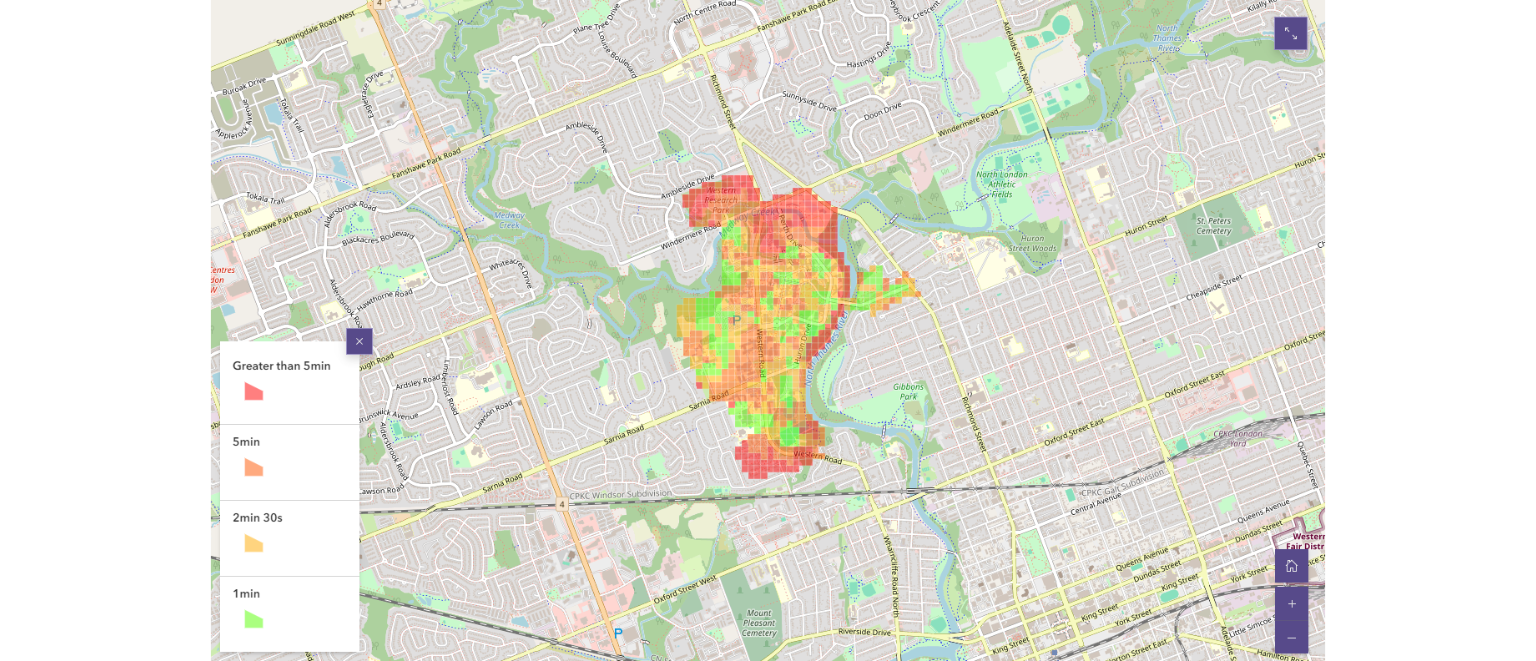
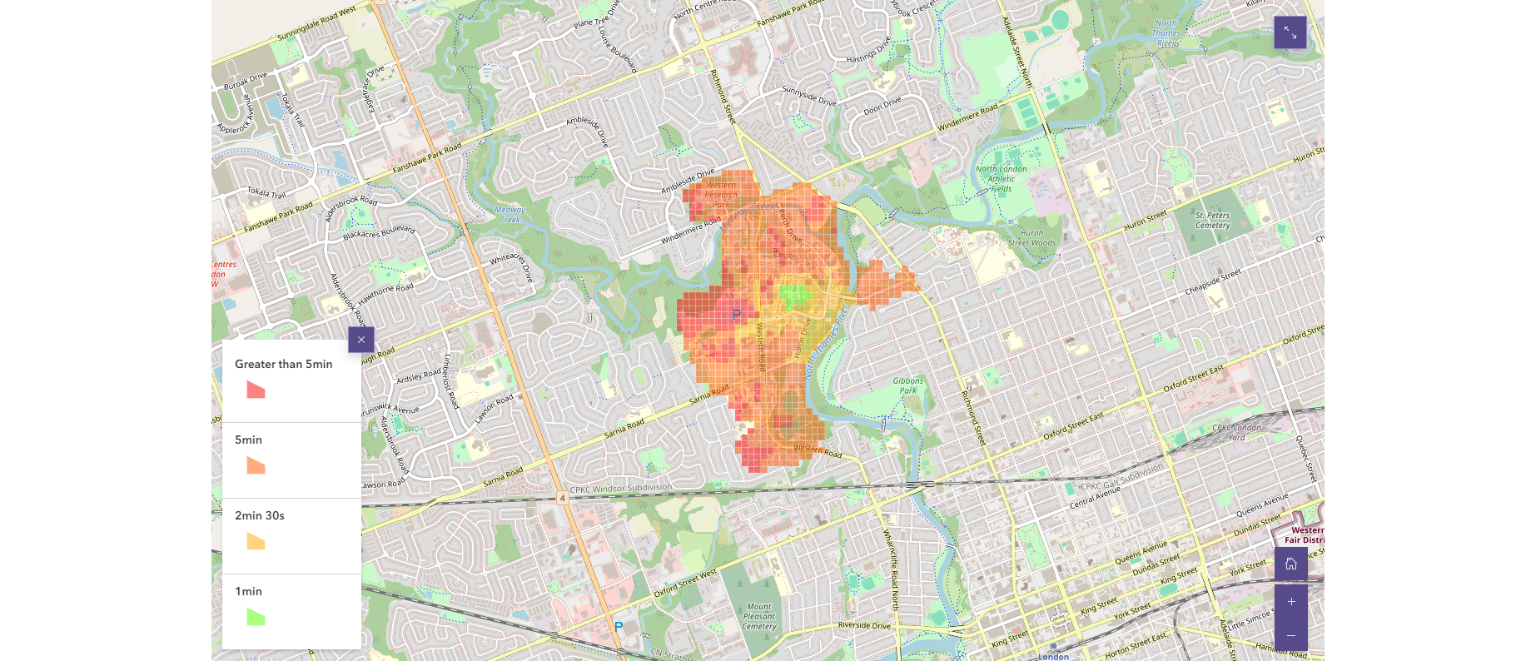
In order to interpret the results of the origin-destination analyses, polygon maps were generated for both travel types. Below are two maps displaying the polygon areas that can be reached at different intervals of travel time – 1 minute, 2 minutes 30 seconds, 5 minutes, and greater than 5 minutes. The buttons in the navigation panel focus on a specified travel time and the associated polygons.
When assessing overall campus safety, zones that have high travel times to CBEP features and high travel times from Campus Police headquarters are deemed as vulnerable. The third map displays the intersection (overlap) between the two sets of polygons representing a travel time greater than 5 minutes.
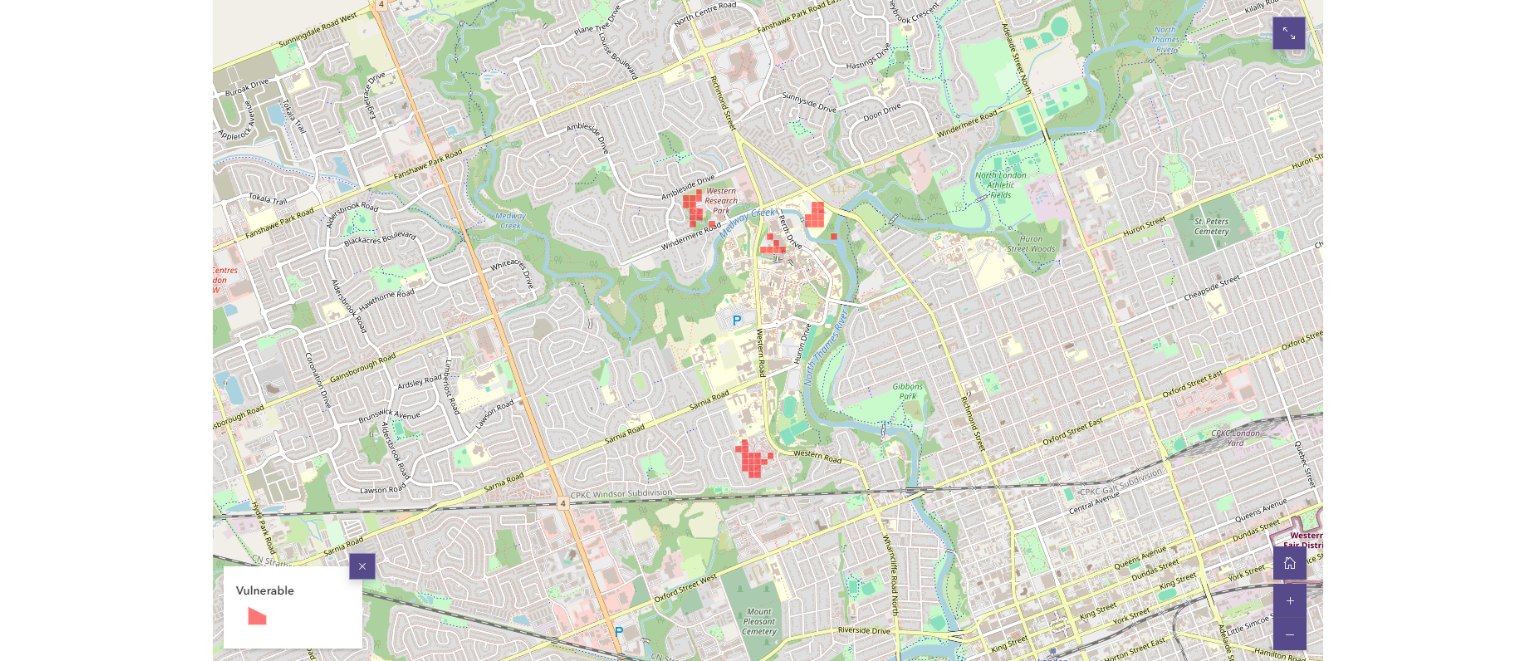
(Intersection between >5 minute walk-time and drive-time polygons)
The following locations have been identified as vulnerable:
- Western Research Park
- University Hospital
- Westminster Field
- Platt’s Lane Estates
Conclusions
This study identified large areas of campus with good spatial accessibility to Code Blue Emergency Phones, as well as short drive times from Campus Police headquarters. However, there were 4 areas located along the outskirts of the core campus grounds that were found to be lacking in both spatial accessibility to CBEP features, as well as having long drive times from Campus Police headquarters. The results of this study provide reasonable basis that change of current campus security systems is necessary at the University of Western Ontario.
When myself and my companion were searching campus for these phones, we found ourselves having difficulty locating these features advertised as “never seconds away” by the University.
“At any campus location you are only a few seconds away from a direct link to the Western Special Constable Service should a situation arise where you require assistance” (The University of Western Ontario, 2023)
Not only many of them far in distance, they are also located in hard-to-see areas. The provider of the emergency phones, the Code Blue Corporation, states that “a good rule of thumb is “line of sight,” meaning you can spot the next Help Point while standing at another.”. (Code Blue Corporation, 2015). Future implementations should consider a line-of-sight and/or viewshed analysis, which may be used to determine what other CBEP features can be seen from a given location.
The emergency phones are expensive, with each new CBEP feature reportedly valued at an installation cost of $30,000 to $50,000. (Sathiaseelan, 2022). Due to this extreme cost and safety concerns, proper spatial analysis should be done prior to installation. It is recommended that a goal of maximizing coverage should be considered when determining future feature locations.
This analysis determined that new CBEP features should be considered for installation at Western Research Park, University Hospital, Westminster Field, and Platt’s Lane Estates. In the meantime, or as an alternative, it is recommended that campus Foot Patrol services should frequent these areas to ensure safety coverage.
Additionally, the collection of on-campus data made it apparent that the University was lacking easily navigable, up-to-date, georeferenced safety information data. It is recommended that new official University map resources be generated containing current Code Blue Emergency Phone locations across campus. A copy of these maps should be placed in every campus building so that students are aware of the closest CBEP feature in case of an emergency.
The Code Blue Emergency Phones are an essential part of campus safety at the University of Western Ontario. This analysis should serve as a starting point for the delineation of future emergency phone locations, as well as a method of assessing campus safety. Using spatial accessibility measures to inform safety measures will provide overall better accessibility to campus emergency response.
Special thanks to Dr. Jed Long, Dr. Jinhyung Lee, Milad Malekzadeh, Reyhane Javanmard and Kathy Tang for advice and assistance! As well as Sarah Foster for helping me collect data.
Note: this post was adapted from my final term project for GIS II. Check out the story map with interactive maps here: https://storymaps.arcgis.com/stories/11ffe1e65c264b0bb52c9e6664e9fa05
References
Allen, J., & Farber, S. (2021). Changes in transit accessibility to food banks in Toronto during COVID-19. Findings. https://doi.org/10.32866/001c.24072
Campus Community Police Service. (2007). Emergency Features on Phones. The University of Western Ontario. Retrieved April 6, 2023, from https://www.uwo.ca/campussafety/pdf/resources/PoliceServiceMap.pdf.
Code Blue Corporation. (2015, August 13). Tips for adding help points® to your location – code blue corporation: Blue Light Public Help Phone Solutions. Code Blue Corporation | Blue Light Public Help Phone Solutions. Retrieved April 8, 2023, from https://codeblue.com/help-point-tips/
Dong, N., Yang, X., Cai, H., & Xu, F. (2017). Research on grid size suitability of gridded population distribution in urban area: A case study in urban area of Xuanzhou District, China. PLOS ONE, 12(1). https://doi.org/10.1371/journal.pone.0170830
NCES Blog. (2015, July 9). Crime and Safety on College Campuses. National Center for Education Statistics. Retrieved April 7, 2023, from https://nces.ed.gov/blogs/nces/post/crime-and-safety-on-college-campuses
Sathiaseelan, A. (2022, November 21). Western expands code blue emergency phone system. The Gazette Western University’s Student Newspaper. Retrieved April 8, 2023, from https://westerngazette.ca/news/western-expands-code-blue-emergency-phone-system/article_1749036e-69b7-11ed-aa49-c375882eeb08.html
Statistics Canada. (2014). 2014 General Social Survey, Cycle 28: Canadians’ safety (victimization): Public use microdata file, documentation and user’s guide. Government of Canada, Statistics Canada. Retrieved April 8, 2023, from https://www150.statcan.gc.ca/n1/en/catalogue/12M0026X
The University Of Western Ontario. (2023). Services. Campus Safety and Emergency Services Western Special Constable Service. Retrieved April 8, 2023, from https://www.uwo.ca/campussafety/services.html
Western Communications. (2022, September 12). “A sense of belonging”: 38,000 students set to return for the new academic year. Western News. Retrieved April 7, 2023, from https://news.westernu.ca/2022/09/a-sense-of-belonging-38000-students-set-to-return-for-the-new-academic-year/