
Park Accessibility in Victoria, British Columbia using Daytime Population & Total Population.
For my third year Transportation Geography & GIS term project, I delved into essential questions about park accessibility in Victoria, BC:
- Daytime vs. Total Population: What is the level of accessibility for parks using daytime population values in Victoria, BC?
- Comparative Analysis: What is the level of accessibility for parks using total population values in Victoria, BC?
- Implications: How do these two results compare, and what are the implications for park accessibility in Victoria?
These questions guide the GIS analyses and research, aiming to uncover insights into the accessibility of Victoria’s parks and suggest improvements for increased accessibility.
Background:
Understanding park accessibility is vital for fostering a healthy community. Various sources, including the Government of British Columbia’s commitment to accessibility and studies like “Associations of park access, park use and physical activity in parks with well-being in an Asian urban environment: a cross-sectional study” and “Modeling the impacts of park access on health outcomes: A utility-based accessibility approach” lay the groundwork for this project. These sources emphasize the importance of park accessibility in promoting physical and mental well-being, setting the stage for a focused investigation in Victoria.
Data and Study Area:
The study area for this term project is Victoria, British Columbia.
The data used are the following:
Parks and open space data:
“Parks and Open Space maintained by the City of Victoria”: displayed as polygons, they were converted to points for the analysis. For easement throughout the term project, parks and open spaces will be referred to simply as parks.
Dissemination areas:
“2016 Census Dissemination Areas – City of Victoria”: displayed the DA’s for Victoria, a critical part in determining accessibility for this analysis. DA was chosen rather than ADA, as DA’s provide a better spatial resolution for understanding the areas with better accessibility.
Population data:
The data for the population was inputted into the analysis from within ArcGIS Pro using the ‘enrich tool.’ This project used two population data types; one 2SFCA used Daytime Population, and the other 2SFCA used Total Population. The purpose was to see the varied difference in accessibility from typically work/other daytime activities (using daytime population) and accessibility from home addresses.
Analysis and Procedures:
The two-step floating catchment area (2SFCA) was used to understand and measure the
accessibility to parks in Victoria, BC. Originally used for healthcare bed-to-population
accessibility, the 2SFCA is a gravity model of spatial interaction that will present a good
indication of general accessibility to parks in Victoria.
The accessibility will be measured through park area-to-population ratios. The use of this ratio
is because park area will be the variable that individuals depend on; the smaller a park is, the
fewer people can access and use it enjoyably, and the larger the park, the more comfortable
access people have. The other important variable is the area’s population, which can indicate how
many people technically have access to the park area, giving us a good indication of accessibility
through the park area-to-population ratios.
The following instructions show how the analysis was completed:
- Obtain park and open space data: Obtain data on the city’s parks and their locations. Data collected for these 2SFCA are under ‘Data and study area.’
- Obtain dissemination area data: Obtain the data for DAs in Victoria, as it will be connected with the
population data for the analysis. - Obtain population data: The population data for the DAs were obtained from within ArcGIS Pro using the Enrich tool (for Daytime Population & Total Population). For the two 2SFCA, follow all steps indicated here, except for one 2SFCA that uses Daytime Population and the other 2SFCA that uses Total Population.
- Add park data: Add the park data to the project by importing the data into ArcGIS Pro.
- Add population data: Add the DA data to the project by importing the data into ArcGIS Pro.
- Join the population data to the DA’s
- Add fields to the DA layer ‘X’ and ‘Y’, then the X-centroid and Y-centroid are calculated using calculate geometry for both fields. The layer is portrayed as points by exporting the layer as a table and then displaying the table as a point layer. This method was similarly done to the parks layer to represent the parks as centroids rather than polygons.
- Delineate a 15-minute walking time catchment area for the parks in Victoria. This was done by using the Network Analyst and creating New Service Area. Facilities were imported from the parks data layer. Travel settings were also explicitly set for this analysis. The mode of travel was walking, with a 15-minute cutoff to mimic the ’15-minute walkable city’ to different amenities, in this case, parks. The hierarchy was turned off, as the hierarchy is a tool that helps with long-distance routing when the mode of travel is driving. Then the service area is calculated, resulting in polygons shown on the map.
- Spatial Join is now used, with target features as the 15-minute catchment area calculated in the previous step and the join features as the DA centroids. Within the field map of join features, click on the population field and then select ‘sum’ for that field. Select the match option as ‘completely contains, to make sure the Spatial Join will consider DA centroids that are completely included in the park’s 15-minute catchment area. By this point, this is the first catchment for Victoria Parks.
- Do a join from the parks layer to the first catchment layer because the park layer has the area data that the first catchment needs.
- Add another field in the first catchment layer, and this will be the park area to the population field. Use the field calculator to divide the park area field over the population field.
- Join the first catchment layer back to the parks layer completing Step 1, now being the park area to
population layer. - Delete the facilities from the first service area, and import the DA centroids as the facilities. All the travel settings are the same as for the first step. The resulting service area polygons are the 15-minute catchment areas for DA’s.
- Use Spatial Join with target features as the 15-minute catchment areas for DAs and the join features as the final layer from step one. Set the merge rule of the park area to population field as ‘sum,’ and select the match option as completely contains. Call this layer the second catchment.
- Join the total park area to population ratio of each DA from the second catchment layer to the DA layer that has population data based on the special DAUID.
- Visualize the data using the symbology, and present the data in an easily interpretable fashion.
Results:
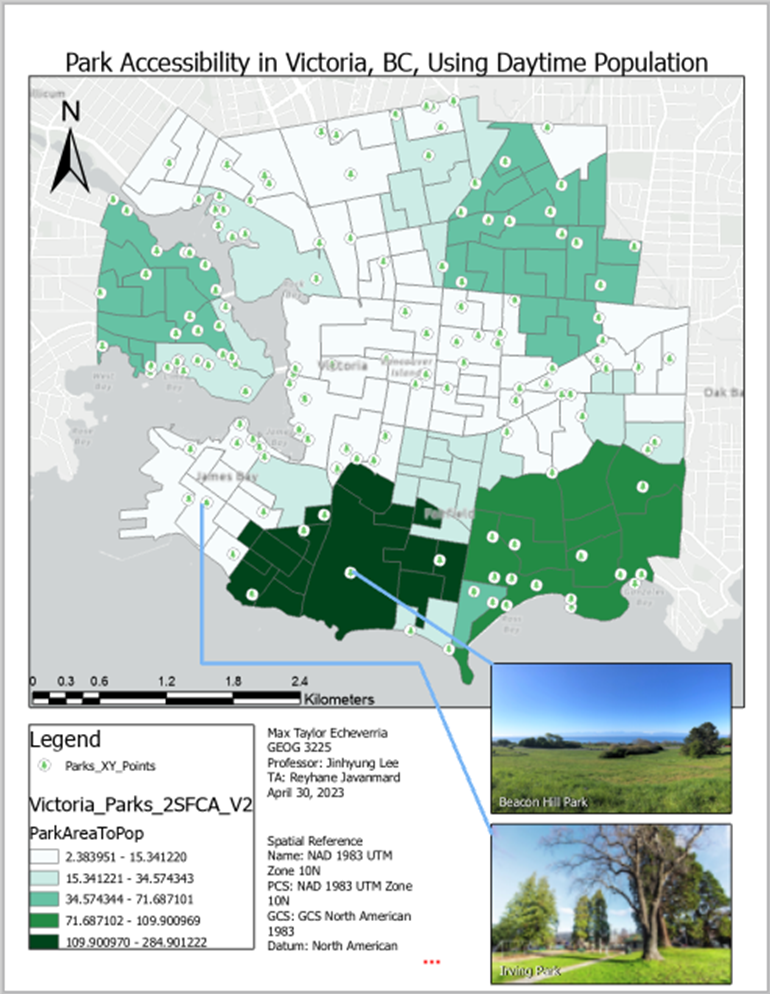
By analyzing Figure 1, park accessibility is shown in Victoria, BC, using Daytime
Population. We see shades of green by using the 2SFCA method and visualizing the results. The
lighter shades of green represent areas with lower accessibility, and the darker areas of green
represent areas with higher accessibility; both result from the park area-to-population ratios in
each DA.
There is a concentrated zone in the South of Victoria with the highest level of
accessibility. Attached to Figure 1 is an image of Beacon Hill Park, where this high level of
accessibility is. This park consists of roughly 740,000 square meters, covering most of the
respective DA, and has a Daytime Population of 328 as of 2022 (when the data was last available
within the ‘Enrich Tool’ of ArcGIS Pro). With this in mind, it is logical for this DA and overall
Beacon Hill Park to have a high level of park accessibility.
There is a concentrated zone in James Bay, to the Southwest of Victoria, with very low
accessibility, represented by the light green shading. Also Attached to Figure 1 is an image of
Irving Park. This park consists of roughly 33,000 square meters and has much open space, as
seen in the image. That said, with a Daytime Population of 180 and using the 2SFCA, the
proportion of the population to the park area is worse, resulting in a lower level of park
accessibility for the DA where Irving Park is located.
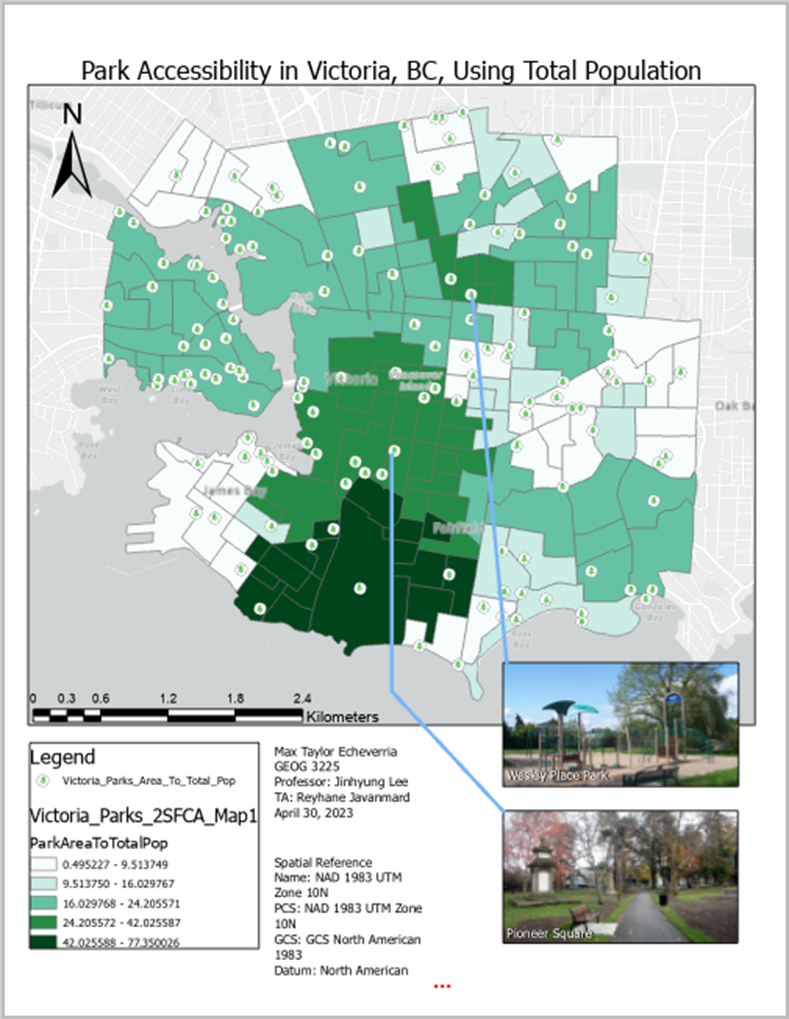
By analyzing Figure 2, park accessibility is shown in Victoria, BC, using Total
Population. The same procedure was used as in Figure 1, other than the type of population
method used.
There is a concentrated zone in the South of Victoria again, just as in Figure 1. However,
there are some changes elsewhere. North of this concentrated high accessibility area in the South,
in Figure 1, the large area indicated relatively low levels of park accessibility; however,
in Figure 2, using Total Population resulted in a substantial increase in the level of accessibility
of this large area, with darker green shading. Figure 2 shows an example of a park within this
discussed area: Pioneer Square. Another area that experienced an increase in park accessibility
was north of the prior area discussed. This area of interest did not have as intense of a change in
accessibility as the area where Pioneer Square is located. However, this area of interest does
stand out compared to its surrounding DAs, with a park shown within Figure 2¸Wesley Place
Park.
Implications:
Having a higher level of accessibility to parks leads to better health outcomes
(Macfarlane et al., 2020). According to Macfarlane’s journal, some critical impacts of park
accessibility are physical health and chronic diseases such as obesity. There is a direct
correlation between higher levels of park accessibility, increased physical accessibility, and
lowered risk of chronic diseases (Macfarlane et al., 2020). Another journal, by Kaczynski and
Henderson, discussed the important role that park accessibility has on social health in urban
environments, including a more robust sense of social cohesion and the sense of being a part of
the community (Kaczynski & Henderson, 2012), increasing levels of positive mental health.
Given both figures, Victoria has substantial park accessibility throughout different areas
of the city. Although in Figure 1 using the Daytime Population, there are lowered levels of
accessibility in central Victoria, using Figure 2 using the Total Population reveals an even higher
level of park accessibility throughout the city, including an increase in central Victoria, with very
minimal areas of the city with low levels of park accessibility. Connecting this visual evidence
from the figures to the sources stated earlier in this section shows implications on these parks’
potential positive impacts on Victoria’s population. According to Statistics Canada, the obesity
levels in British Columbia are lowest compared to other provinces and territories, at 20.4%;
additionally, obesity levels are lower in regions containing major cities within British Columbia
(Government of Canada, 2015). The level in the “South Vancouver Island Health Service
Delivery Area” was slightly lower than the province’s average at 20.1% (Government of Canada,
2015). More specifically, Victoria’s level was even lower at 19.6%. There may be an implication
that this lower level of obesity is partially a result of Victoria’s good level of park accessibility.
The Greater Victoria Local Health Area Profile provided mental health rates, presenting
Victoria’s mental health issues as having higher rates than the rest of Vancouver Island and the
Province, pointing out main contributors, including low-income levels and substance abuse
(Island Health, 2019).
These rates may imply that though park accessibility has a positive impact on
social/mental health, it does not have as significant of an impact as other determinants; therefore,
city resources may instead need to be focused on supporting low-income residents and
combating substance abuse than focusing solely on park accessibility within Victoria.
Gathering the information from initial sources that provided an understanding of the research
done in this area of study, the research conducted by this Transportation Geography and GIS
analysis, and the research gathered from the implications section, there are important impacts
from park accessibility. An increase to park accessibility has a positive impact on public health,
and there is reason to believe that there is also a positive impact on social/mental health;
however, it may not be as strong of an impact compared to other determinants (Island Health,
2019). Park accessibility should be of crucial importance to city councils and community
planners, as its positive impacts are noticeable and beneficial to the community. Victoria’s
accessibility to parks is extensive when considering the total population rather than the daytime
population. However, there are still some pockets where accessibility is much lower than in
surrounding areas, which should be brought to the attention of city officials and planners to focus
their efforts when considering future park area implementation.
References
City of Victoria. (2019, September 11). 2016 census dissemination areas – city of Victoria. City of Victoria Open Data Portal. Retrieved April 14, 2023, from https://opendata.victoria.ca/datasets/VicMap::2016-census-dissemination-areas-city-of-victoria/about
City of Victoria. (2020, December 1). Parks and open space. City of Victoria Open Data Portal. Retrieved April 14, 2023, from https://opendata.victoria.ca/datasets/VicMap::parks-and-open-space/explore?location=48.421357%2C-123.328546%2C13.17
Government of British Columbia. (2023). Commitment to Inclusion. BC Parks Inclusion Plan . Retrieved April 12, 2023, from https://nrs.objectstore.gov.bc.ca/kuwyyf/bcparks_commitment_to_inclusion_english_fa8c686184.pdf
Government of Canada, S. C. (2015, November 27). Health at a glance. Adjusting the scales: Obesity in the Canadian population after correcting for respondent bias. Retrieved April 26, 2023, from https://www150.statcan.gc.ca/n1/pub/82-624-x/2014001/article/11922-eng.htm
Island Health. (2019). Greater Victoria – 411 local health area Profile – Island Health. GREATERVICTORIA-411 Local Health Area Profile. Retrieved April 27, 2023, from https://www.islandhealth.ca/sites/default/files/greater-victoria-local-health-area-profile.pdf
Kaczynski, A. T., & Henderson, K. A. (2012). The impact of park accessibility on physical activity among urban residents. American Journal of Health Promotion, 26(3), 143-150. https://doi.org/10.4278/ajhp.100624-QUAL-221
Macfarlane, G. S., Boyd, N., Taylor, J. E., & Watkins, K. (2020). Modeling the impacts of park access on health outcomes: A utility-based accessibility approach. Environment and Planning B: Urban Analytics and City Science, 48(8), 2289–2306. https://doi.org/10.1177/2399808320974027
Petrunoff, N. A., Yi, N. X., Dickens, B., Sia, A., Koo, J., Cook, A. R., Lin, W. H., Ying, L., Hsing, A. W., van Dam, R. M., & Müller-Riemenschneider, F. (2021). Associations of Park Access, park use and physical activity in parks with wellbeing in an Asian urban environment: A cross-sectional study. International Journal of Behavioral Nutrition and Physical Activity, 18(1). https://doi.org/10.1186/s12966-021-01147-2