
How to find frequently visited locations from human mobility data?
One of the main steps in analyzing human mobility is finding the most visited locations of each person. In doing so, most researchers try to find locations where people spend most of their time. Whether we use a GPS tracking or mobile phone dataset, because of the errors pertaining to the underlying technology (e.g., atmospheric error in GPS data or oscillation in mobile phone data), even if we stay at the same point, we might have different locational records in our data. To avoid this, we need to find points close to each other and make a cluster out of them. After making the cluster, we can label each cluster based on the dwelling time, time of the day, or external GIS data (e.g. POI data). Whether we consider the centroid of that cluster or make a polygon is up to the analyzer.
What we are going to do?
In this post, I will show you how to find frequently visited locations using ArcGIS Pro.
Our Objectives
- Find the most frequent locations for each user
- Label users’ frequent locations
Data
The dataset we used is a fictional cell phone record provided in one of Esri’s tutorials.
Steps
Step 1 – Preparing the data
Download the data. Start the project and from the Geodatabase import AllCellPhoneData Layer. This is what you should see:

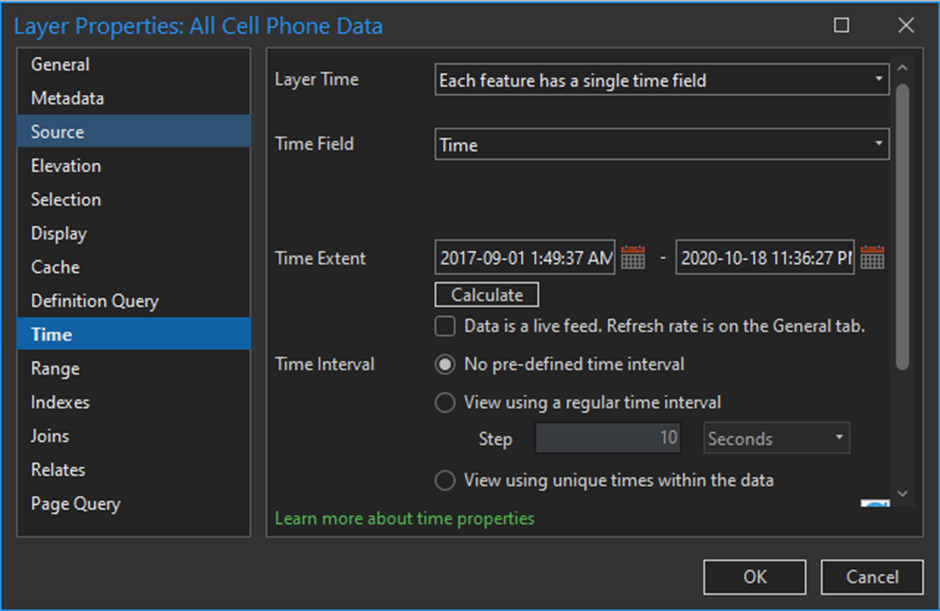
Since all movement analysis needs locational and temporal data, we need a Time attribute for our layer. The data we have has a Time component. However, if we want ArcGIS Pro to understand that the “Time” column in our data is a time feature, not a string, we must time-enable the layer. To do so, open the layer properties and click on the Time tab. Choose the layer time and time field and click okay.
Step 2 – Geoprocessing
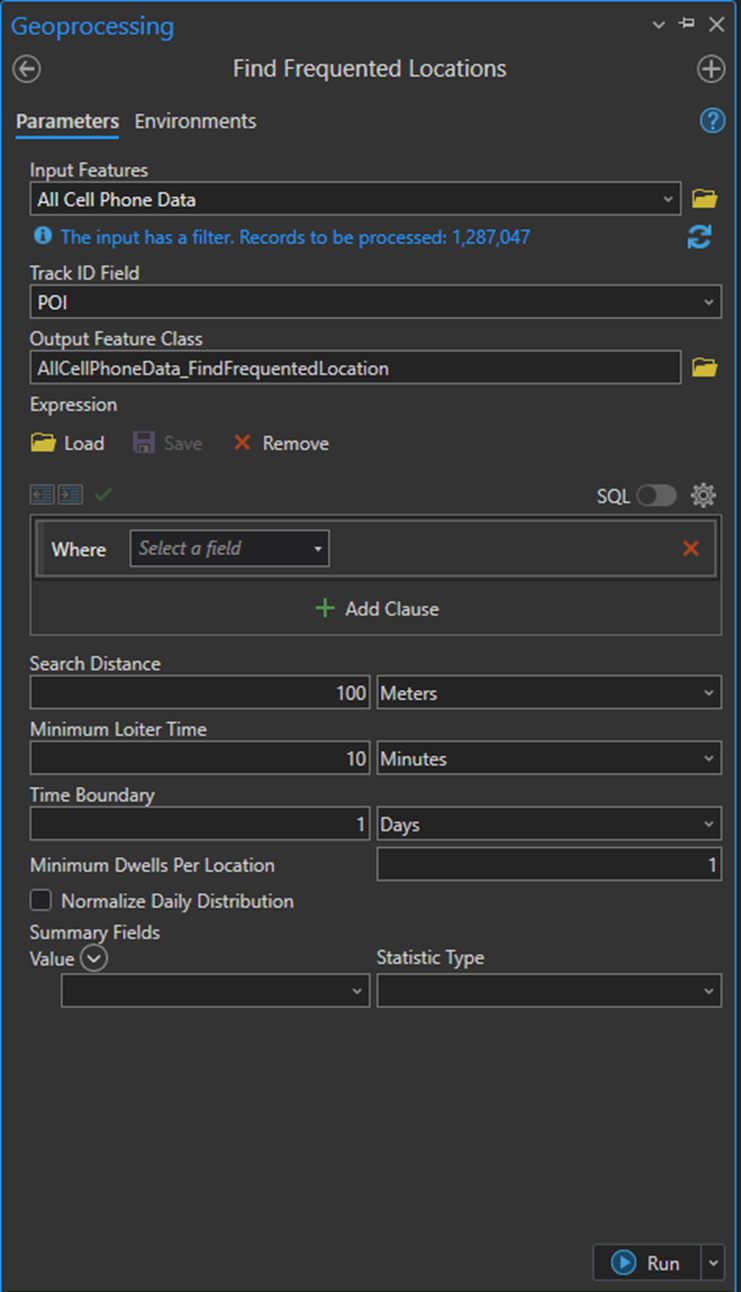
To find the frequent location, we will use Find Frequented Locations in ArcGIS Pro Intelligence Tools under movement analysis. To cluster the points, we first need to find the stops. As we move around, our tracks might collect thousands of points. So we need to clarify which were in-motion points and which were stops. To find the stops, we need a time threshold. We considered a 10-minute threshold for this analysis which means if a point didn’t move more than 10 minutes, we consider that as a stop. It can vary based on the case. So one thing left is how to assume a point is not moving. We know all these data have errors even if we stay at some point, but how can we deal with it? The answer is that we can specify a distance threshold too. If they pass this threshold, they are no longer considered part of that dwell location. In this analysis, we used 100 meters as our distance threshold. We divided the whole study period into days.
Step 3 – The results
After running the tool, we get hundreds of polygons showing the locations each user spent the most. Each user might have multiple locations (e.g., home, work, or a third place).

Step 4 – Labeling
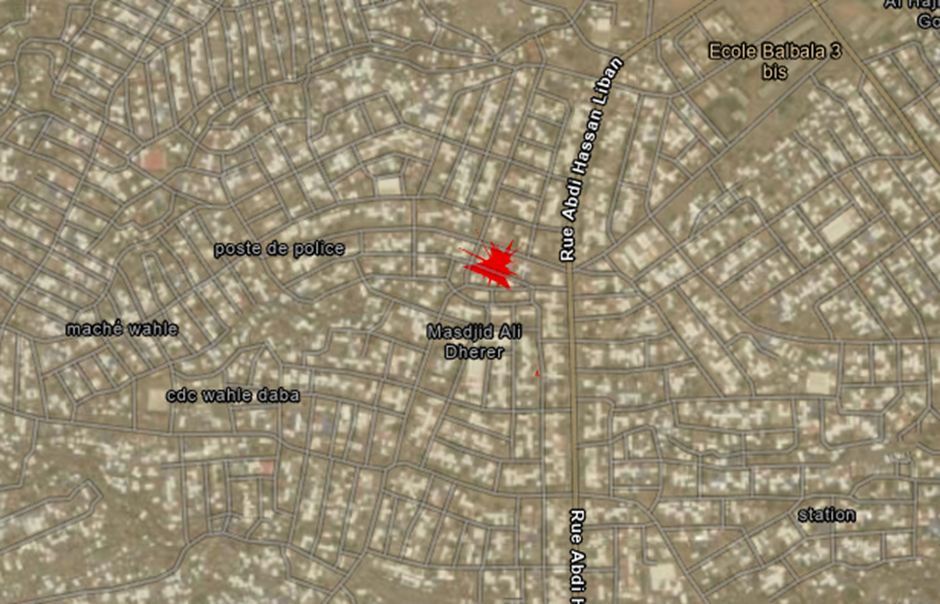
Now that we have frequent locations for all users, we want to investigate how to label them. Here we conduct a manual version; however, using Python Notebook, it is possible to run labeling automatically. You may sort all locations for each user and assign “home” to the place with the highest time dwell time and the second one as “work,” OR you may consider adding GIS data and labeling the locations based on their context. Here we do the second one but manually. We first select one user’s result.
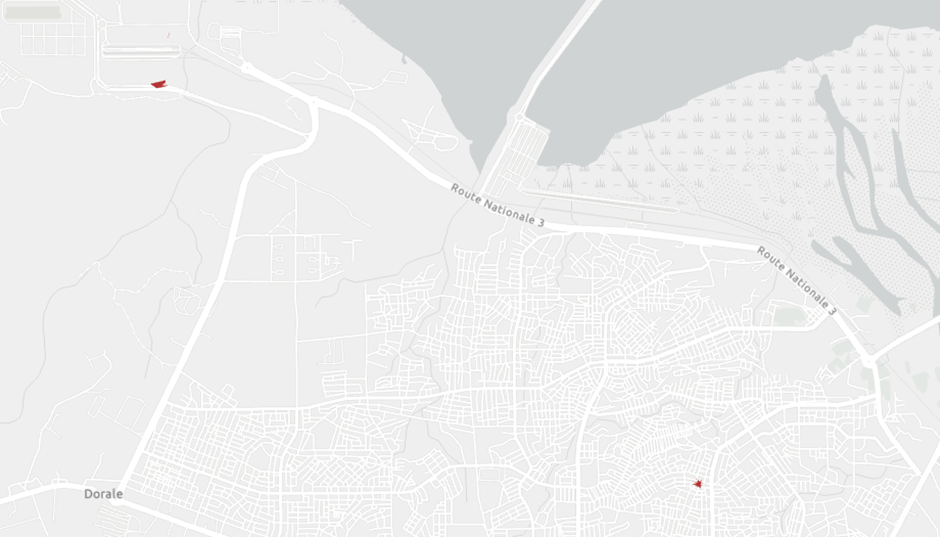
Then we add an imagery basemap. Using the context, we label the locations as home and work. In the first photo, you can see that the location is in a residential area, so we label that as home, and in the second, it is more industrial areas, so we label it as work.
Summary
In this project, we found the most frequent locations of users using mobile phone data and labeled them.