
Using ArcGIS Pro and Python Notebooks to Look at The Interaction of Deer and Hunters in Oklahoma, USA
Over the past summer I had the pleasure of working with Dr. Long here at Western University as a part of the Undergraduate Summer Research Internships program. I learned a tremendous amount about GIS software, particularly ArcGIS pro. I used this time to explore tools and features that I had not previously been taught in any of my GIS courses. At Western most of our GIS labs are based in ArcMap 10.8 and R. So, I thought it would be interesting to experiment with ArcGIS Pro and Python Notebooks. In this blog I will discuss my experience using new tools and what I found made life easier and some challenges I encountered along the way. To do so, I will walk through my project and the steps I took at each stage.
For a bit of background, the topic of the project I worked on was the “Interaction of Deer and Hunters in Oklahoma, USA”. This project analyzed GPS tracking data provided by the Noble Research Institute, collected during the months of November and December of 2008, and 2009 in the state of Oklahoma. The goal was to determine whether or not an interaction of a deer and a hunter was categorized as a GPS interaction or a visual interaction. In other words, based off of proximity, elevation data and land use data, did a hunter potentially see a deer or were they just geographically within 150m of each other?
To begin, I had to do some data clean up. The data I had for GPS tracks of hunter’s outings contained records taht combined multiple values into one field, with different categories separated by TAB characters. The categories of data included location (easting and northing), time and date, and zone information. I had to convert each category to its own field so that the data could be more easily understood by ArcGIS software. To accomplish this task, I had to do some coding. This was very easy, as I could work on Python code in Notebooks right within the ArcGIS Pro interface. Although I had no maps on the go yet, this made it a simple task to keep all of the work I produced over the summer organized.
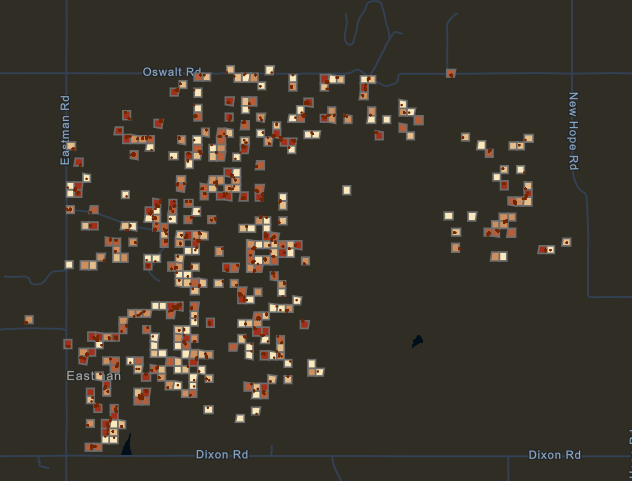
Once the initial data clean-up was complete, I loaded the data in ArcGIS Pro. I added both the hunters and the deer GPS data. Here is what they looked like upon loading the data.
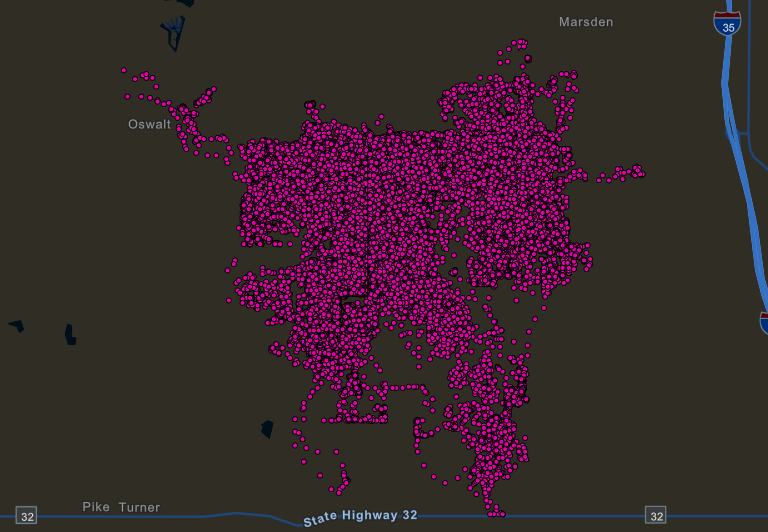
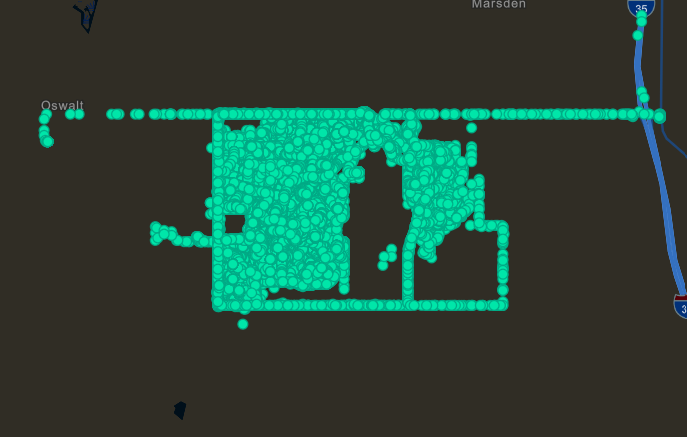
As you can see, this doesn’t really tell us much of a story.
To take a step further into building this story, I was given approximately 30 PDF files, each containing an average of 70 scanned cards from the hunters in Oklahoma. These cards provided reports from hunters that described the time and location when they sighted a deer, and the tag colour that a deer was wearing. I entered the information from these cards into an Excel file, essentially creating a data file that I could use to compare with the GPS tracks recorded for hunters’ outings. I used a second python script here to loop through the records and extract data for outings that corresponded the filled-out hunter cards. This allowed me to focus only on the outings during which the hunter reported a sighting.
Next, I separated the hunter’s data into three categories. Walking, driving and standing still.
I only used the data from the walking and standing still points as this is when it was most likely an interaction between the hunter and deer could occur. One thing I really enjoyed about using ArcGIS Pro was how I could have multiple maps open at the same time and I could easily toggle through the tabs to look at a certain map. Just as easily, I could toggle through my python scripts and notebooks as well as some ModelBuilder workspaces I created, all in one interface. This is not something that you can easily achieve using ArcMap.

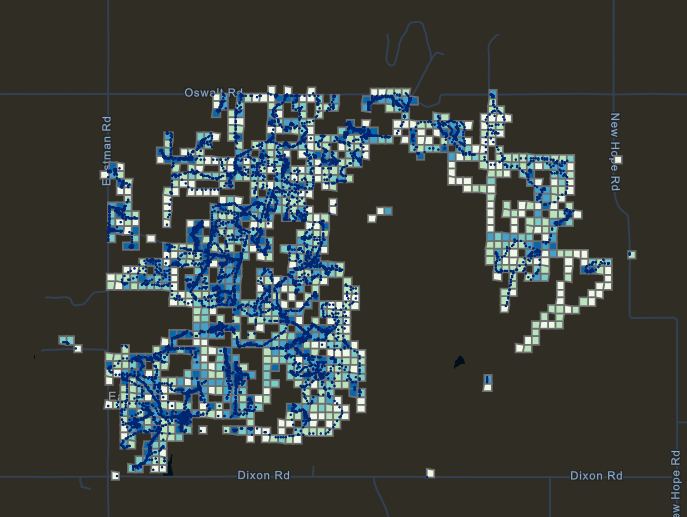
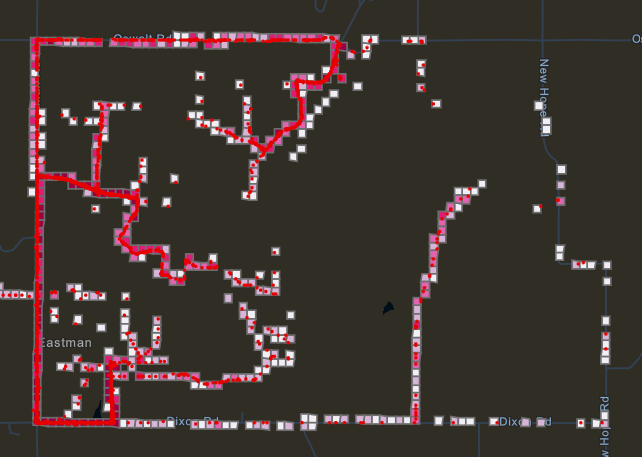
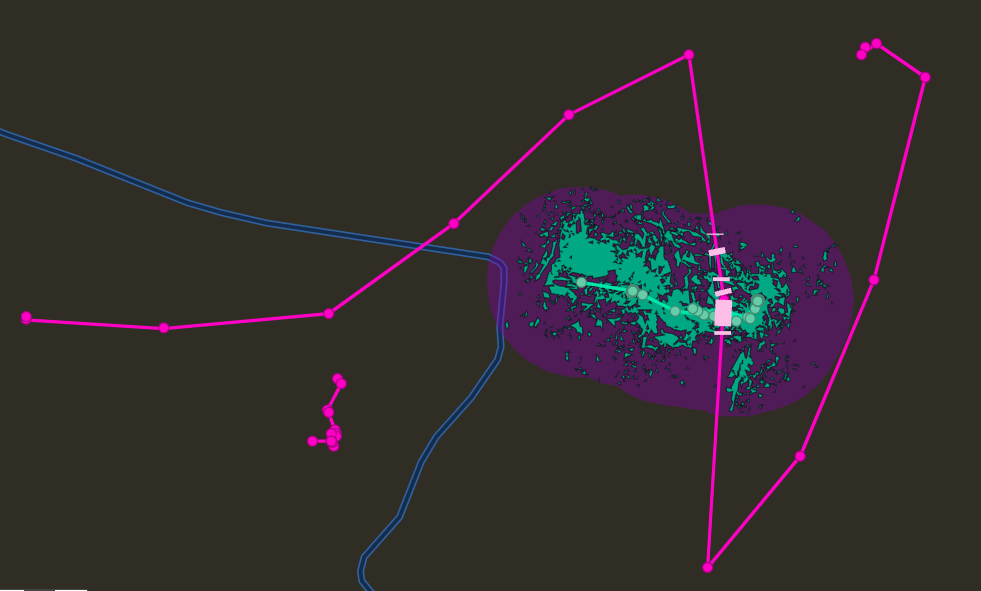
The next step I took was to create buffers, viewsheds, deer paths/points, hunter paths/points, and intersections. My saving grace this summer was discovering the batch geoprocessing mode (Batch Geoprocessing). This allowed me to run tools on many features all at the same time. Rather than writing a whole script to loop through all of the data, I could just push a button and ArcGIS Pro would do it for me. The ability to do this is one of the main reasons I was sold on ArcGIS Pro this summer. The other helpful tool I used inside ArcGIS Pro was ModelBuilder. I was familiar with ModelBuilder from ArcMap, and in ArcGIS Pro it works essentially the same. I used it to create a model that combines a variety of tools as a series of steps, essentially creating a new geoprocessing tool. I used this to calculate which deer points fell within the correct time window of a hunter’s path. This could could easily be looped through multiple data sets, to produce a result for each hunter’s outing. Here is an example of one outing, showing the coincident deer and hunter paths intersecting each other, and the viewshed from the hunter’s path:
Here is the model builder I used to calculate the deer in the correct time window:

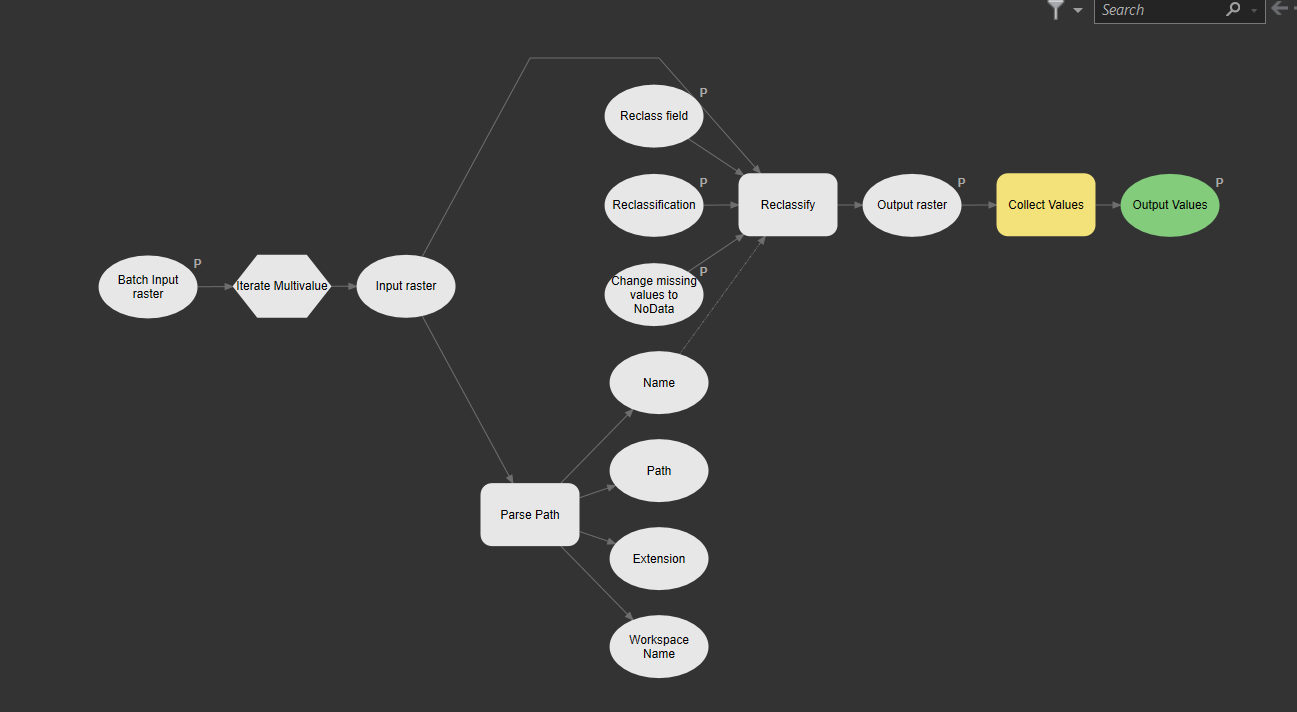
Here is an example of the model created when using a batch mode tool. In this case it was a batch reclassify.
Overall, the only real obstacles I encountered over the summer was simply navigating the software. As I was familiar with ArcMap, it took some time to figure out where all of the tools and buttons were located. Though, it did not take me long to adjust.
If you would like to learn more about my project and the results, feel free to check out my story map here: https://arcg.is/ePeX5