
Remote and Direct Sensing: Merits of Mixed Method Protocols in Ecology
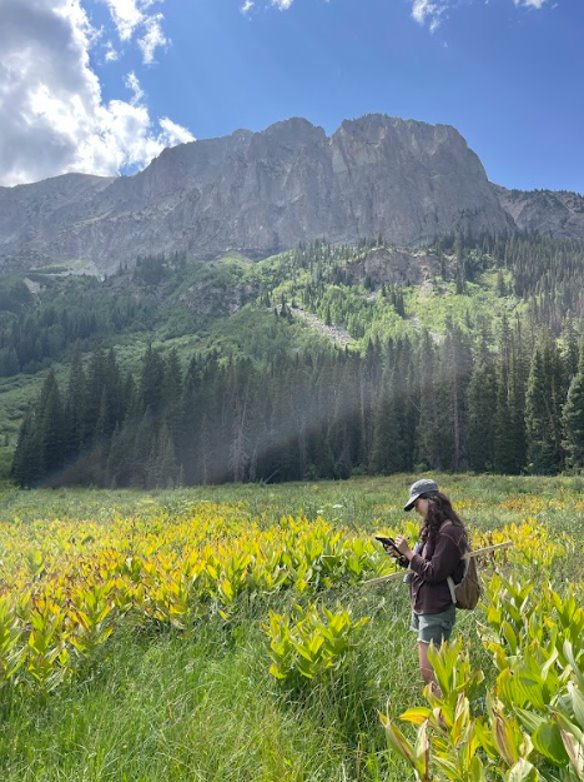
This summer I had the opportunity to design and carry out a week-long research project at the Rocky Mountain Biological Laboratory (RMBL) in Gothic, Colorado—as part of an ecology and evolutionary biology field course. RMBL is a renowned site for long-term ecological research, especially that pertaining to global climatic change. Gothic is situated in a subalpine ecosystem, its high elevation making it among the first areas to study tangible impacts of climate change. RMBL’s central location in the Elk Mountain range provides researchers with access to study sites at a range of elevations, and has facilitated detailed decades-long accounts of climate-linked shifts for a broad set of species and study systems (Wainwright et al. 2020).
One of the key developments in environmental data science is the increased capability of remote sensing systems to aid in understanding complex environmental processes. Remote sensing is highly useful for measurements of phenology and senescence in vegetative plants as it can analyze an entire landscape with high temporal resolution. This strategy for measurement of landscape phenology using remote sensing is called Land Surface Phenology (Misra et al. 2018). Past the data collection stage, vegetative health indices such as the normalized difference vegetation index (NDVI) and soil adjusted vegetation index (SAVI) are powerful analysis tools for assessing plant health on a large spatial scale via remotely collected imagery (Fu & Shen, 2016). However, recent work has highlighted the importance for remotely sensed data and developed models to be supported by data collected in the field (Duncan et al., 2015). I designed this project in the beginning of the field course, and then was partnered with another student to actualize it.
This study sought to explore the promises of combining on-the-ground data-collection with remote-sensing to produce models for vegetative senescence of an abundant perennial plant, Veratrum californicum, in Gothic, Colorado. We used drone-sensed imagery as well as manually collected values of soil moisture, light intensity, temperature, Veratrum cover, herbivore damage, and qualitative Veratrum senescence.
Data Collection:
Remotely sensed data were generously provided by Dr. Ian Breckheimer at the Rocky Mountain Biological Laboratory. From Dr. Breckheimer we sourced remote sensed data collected by drone:
- A classified vegetation raster file
- A digital elevation model (DEM)
- An imagery raster with blue, green, red, near-infrared, red-edge, and thermal bands
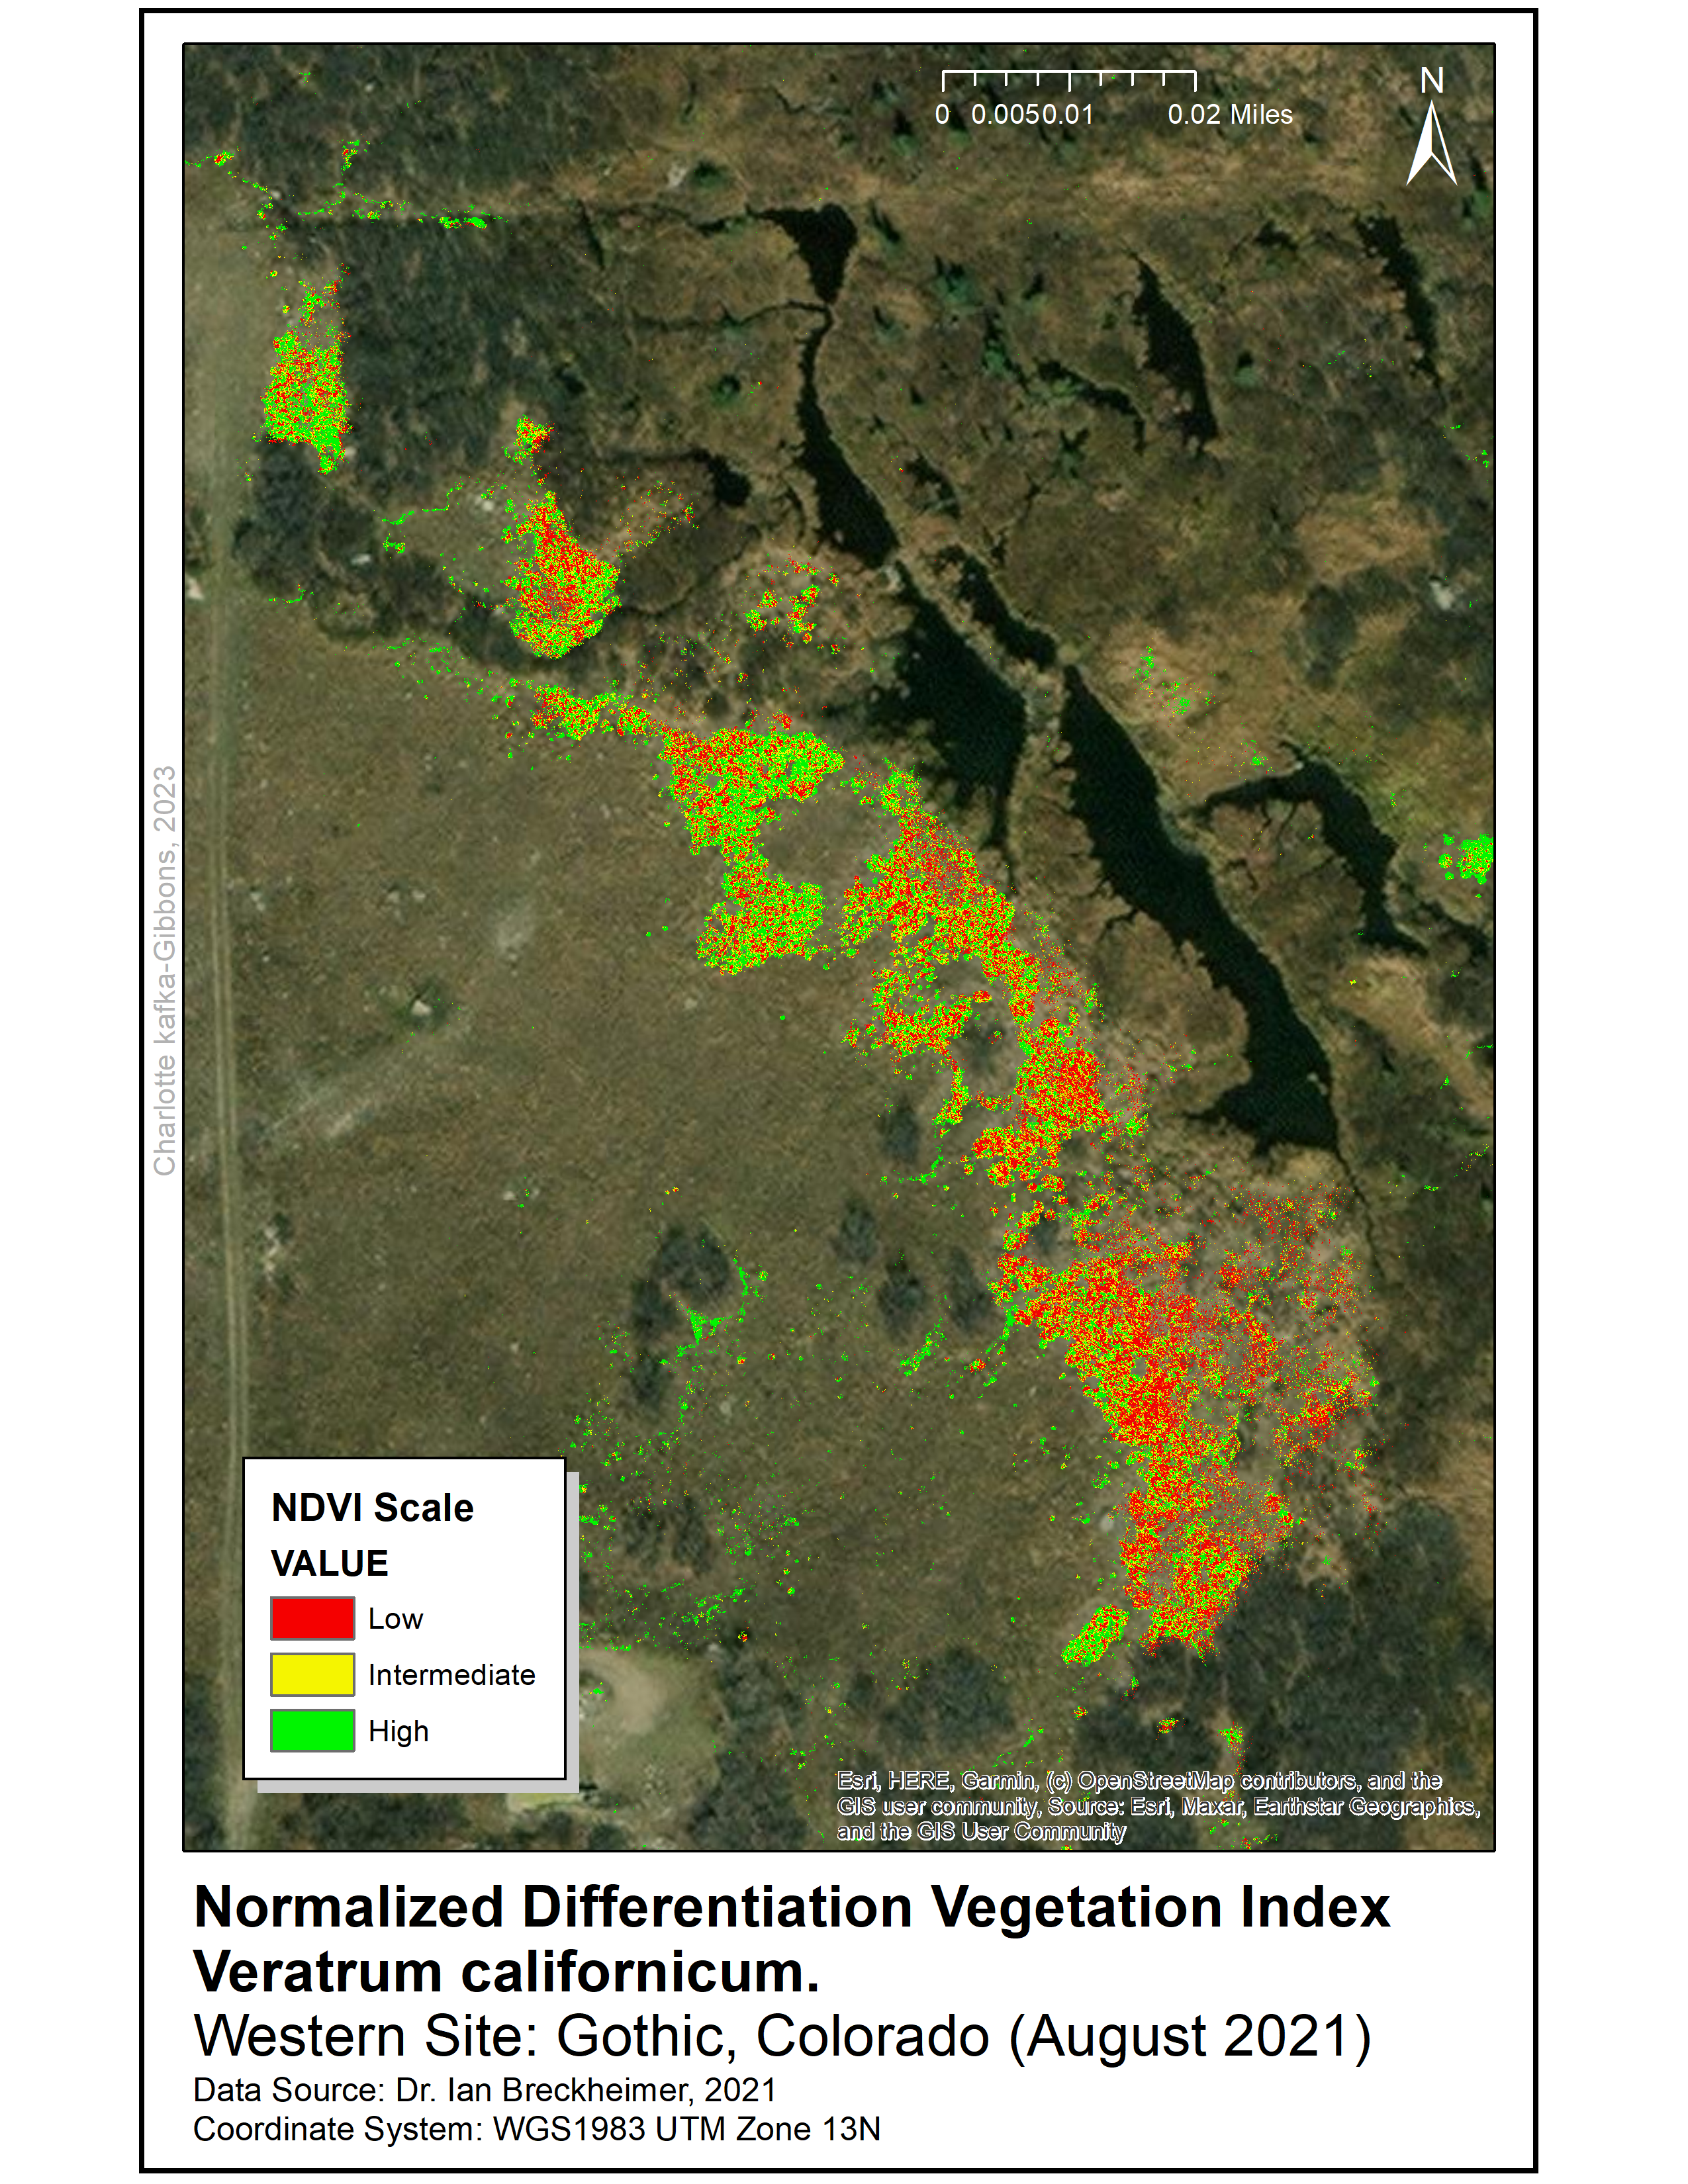
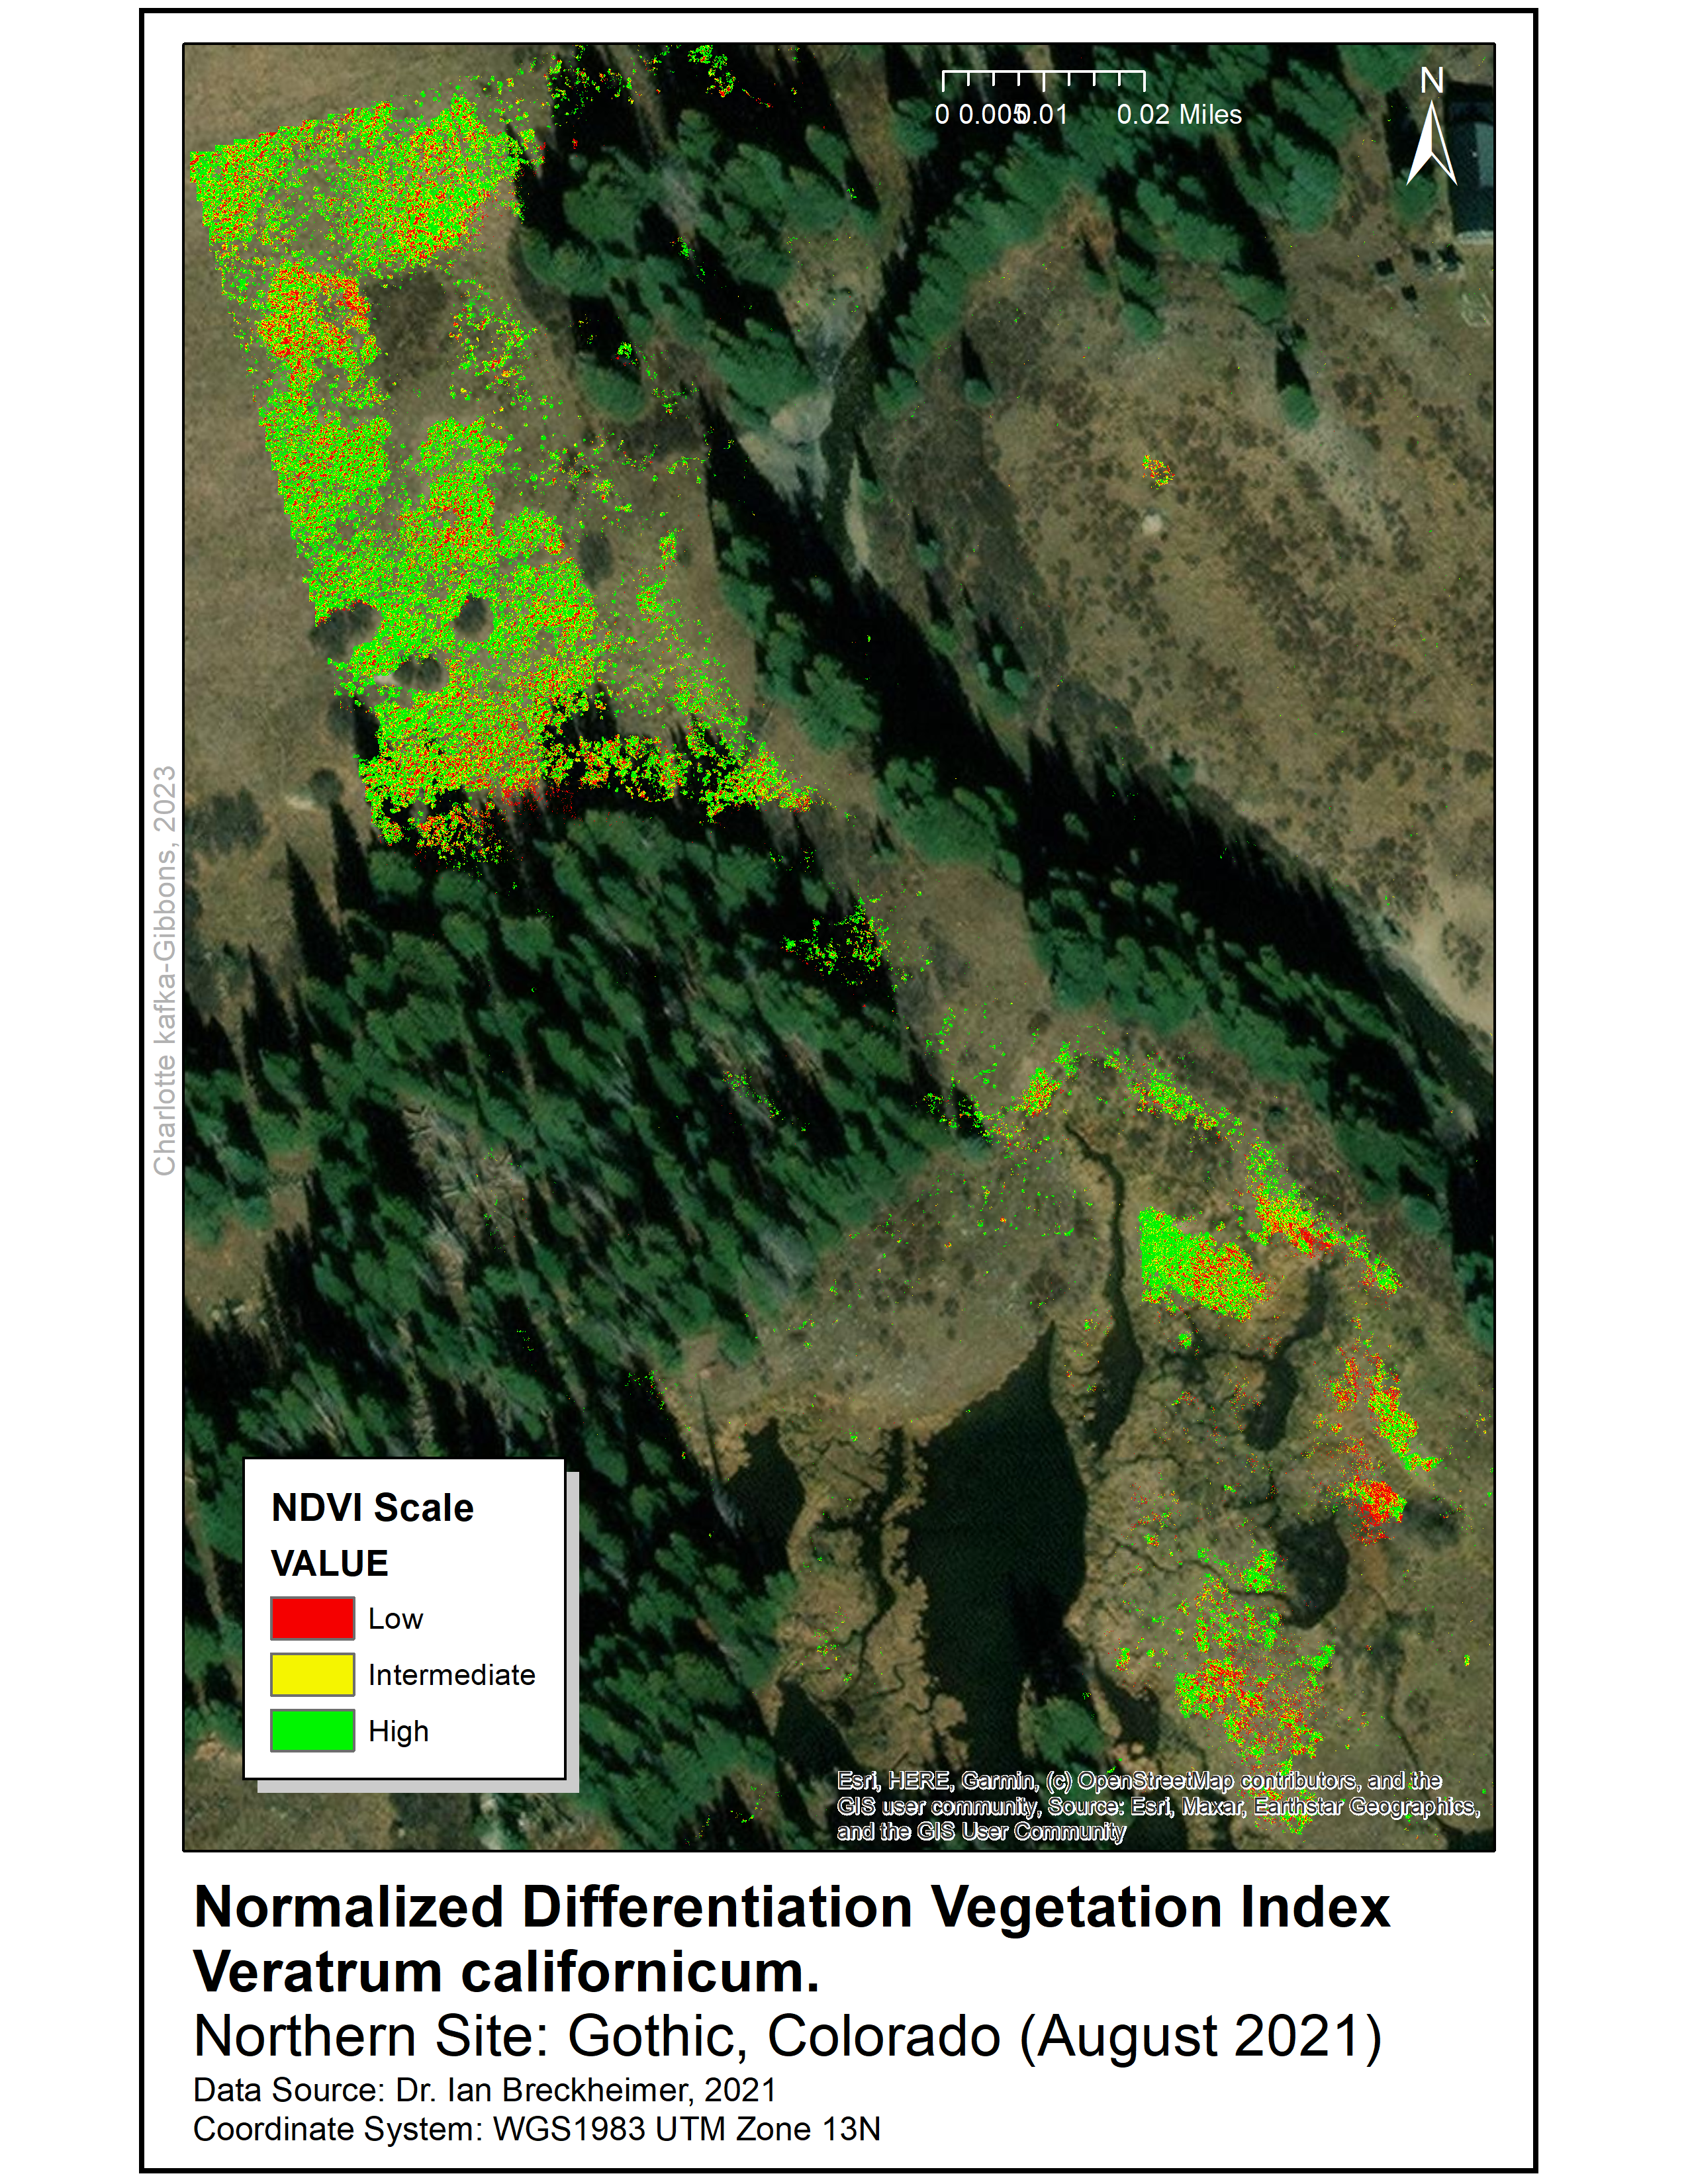
All three files have a resolution of five centimeters and the data was collected in August 2021. Processing and analysis of remote sensed data used ArcGIS 10.7 programs with Spatial Analyst and Geostatistical Analysis extensions. To identify areas for data-collection in the field, we produced a Normalized Difference Vegetation Index (NDVI) raster for the range of V. californicum throughout the Gothic townsite and surrounding areas.
- The V. californicum class was selected and exported as a new raster from the classified vegetation map.
- This raster was then used as a mask in the Extract by Mask tool to trim near-infrared (NIR) and red-edge raster files to the extent of the V. californicum distribution.
- Next, the raster calculator was used to calculate NDVI from the NIR and red-edge bands.
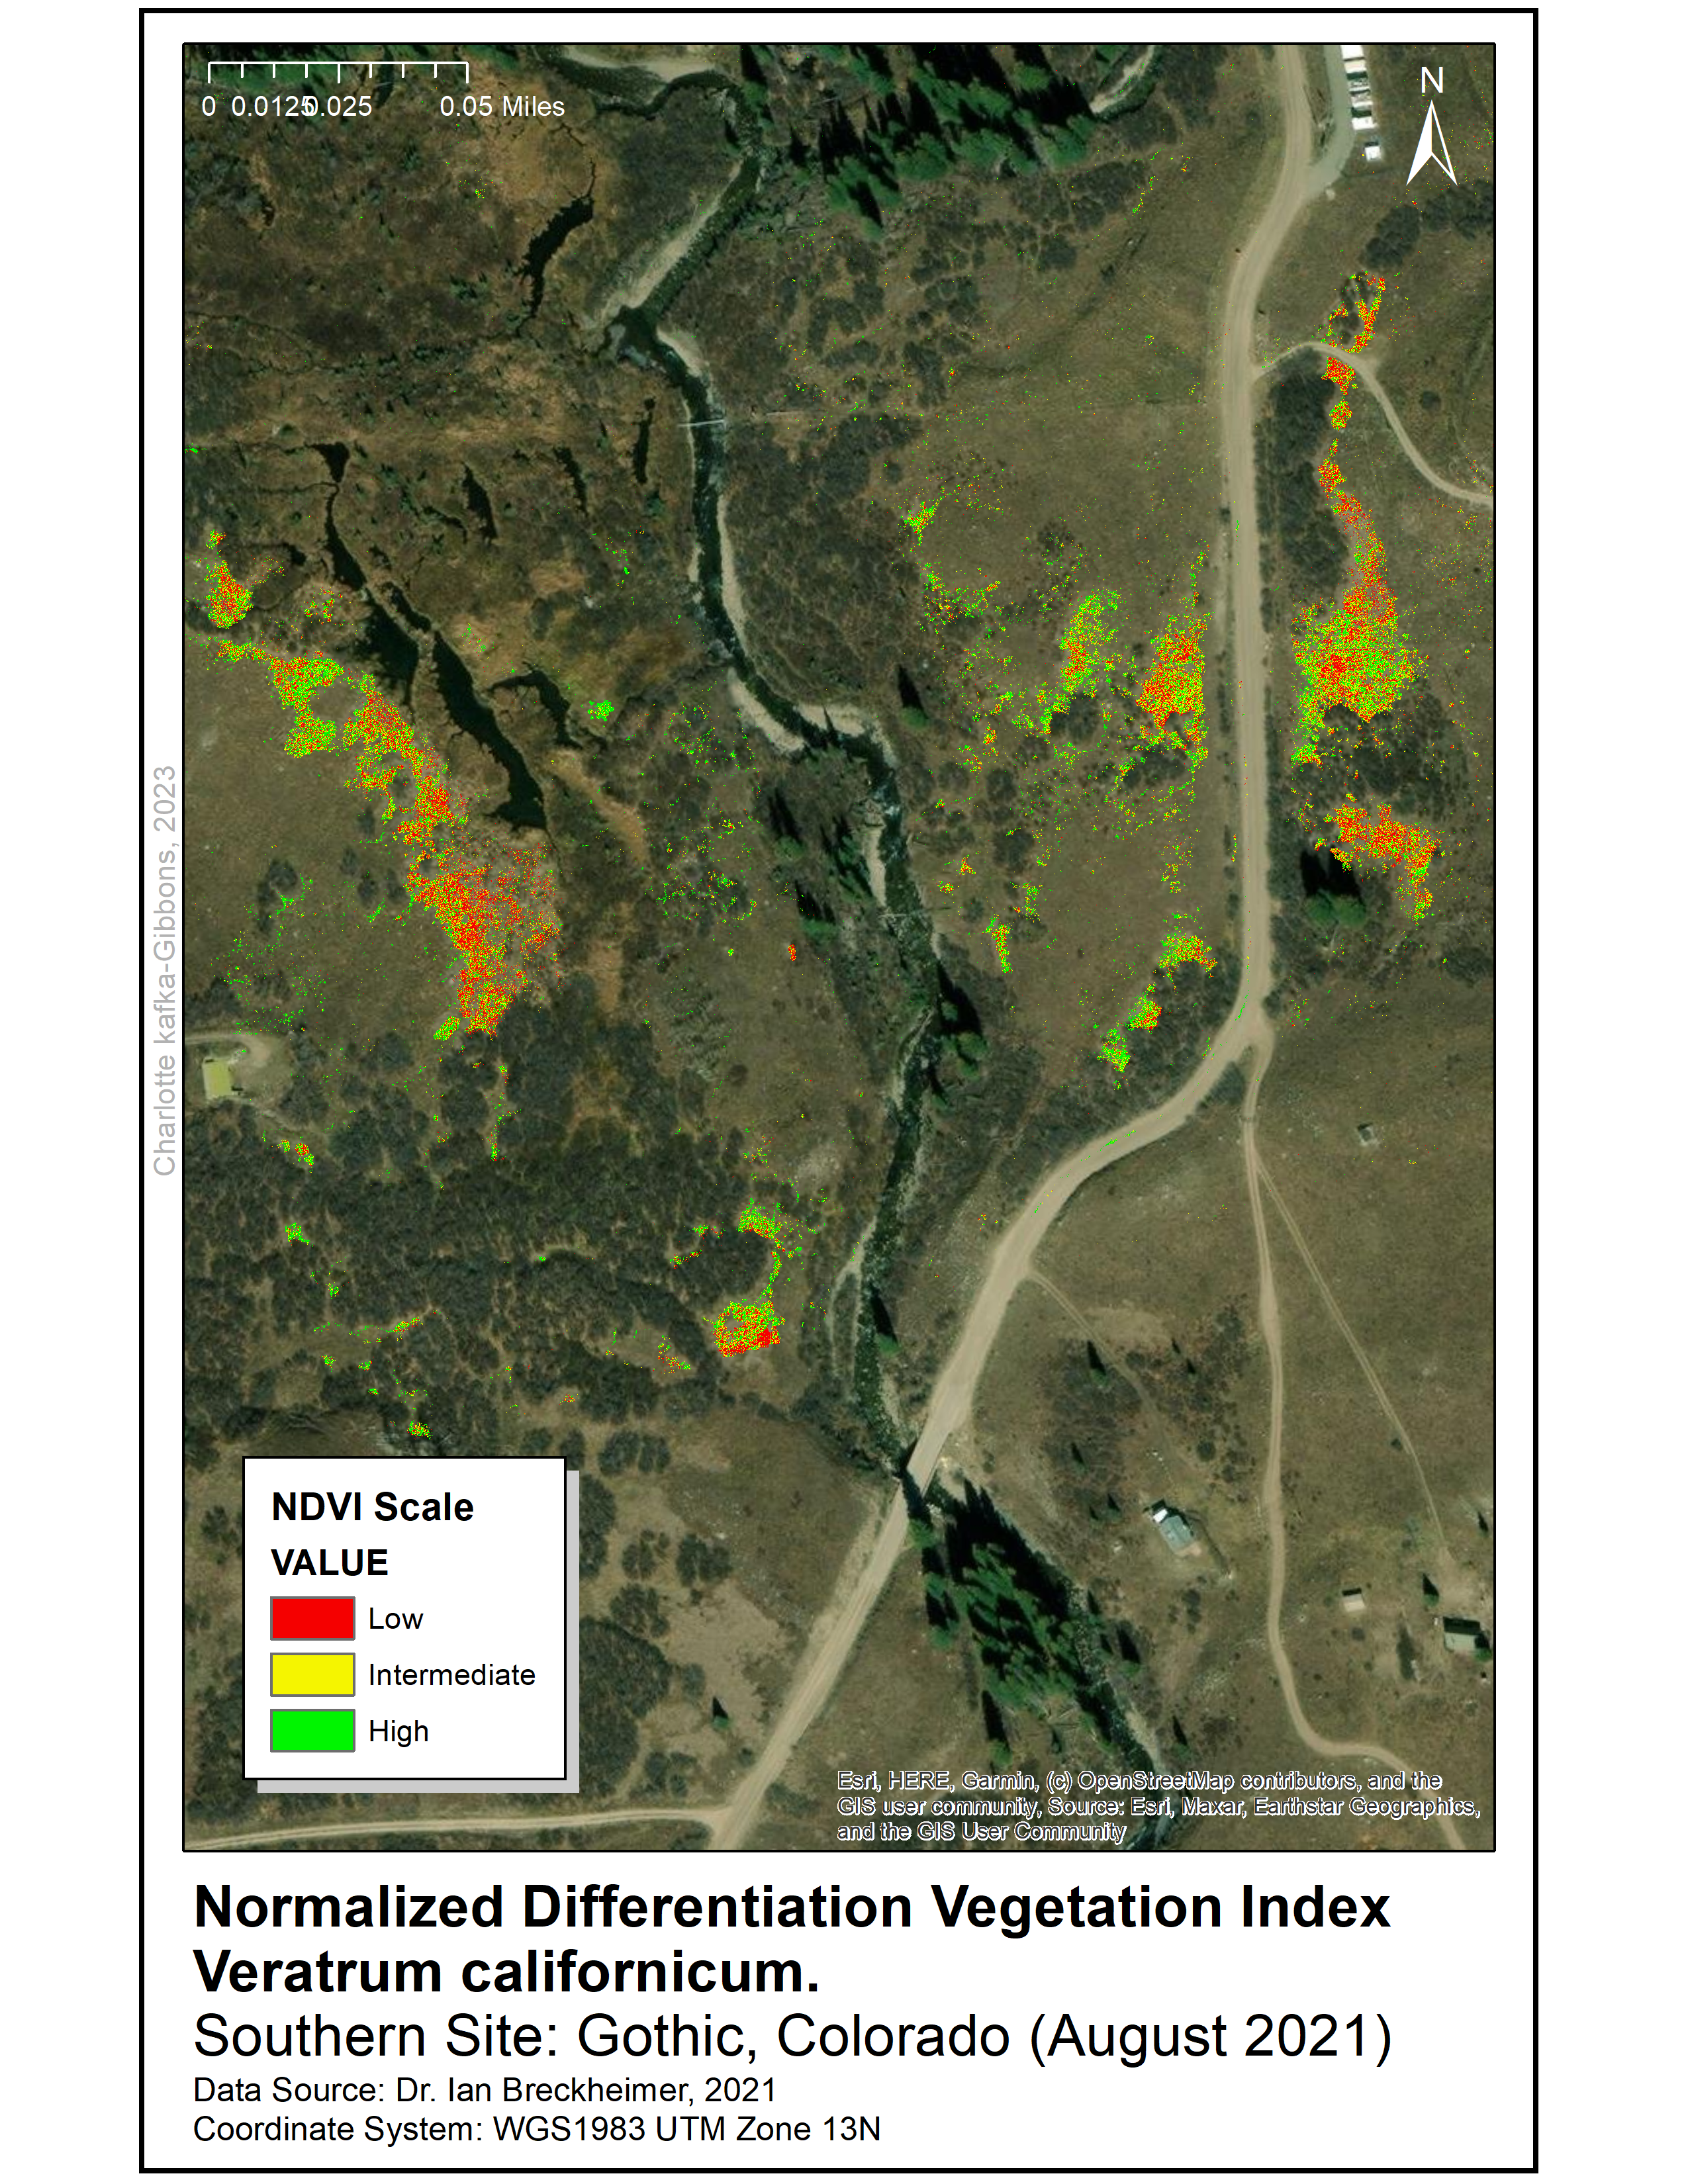
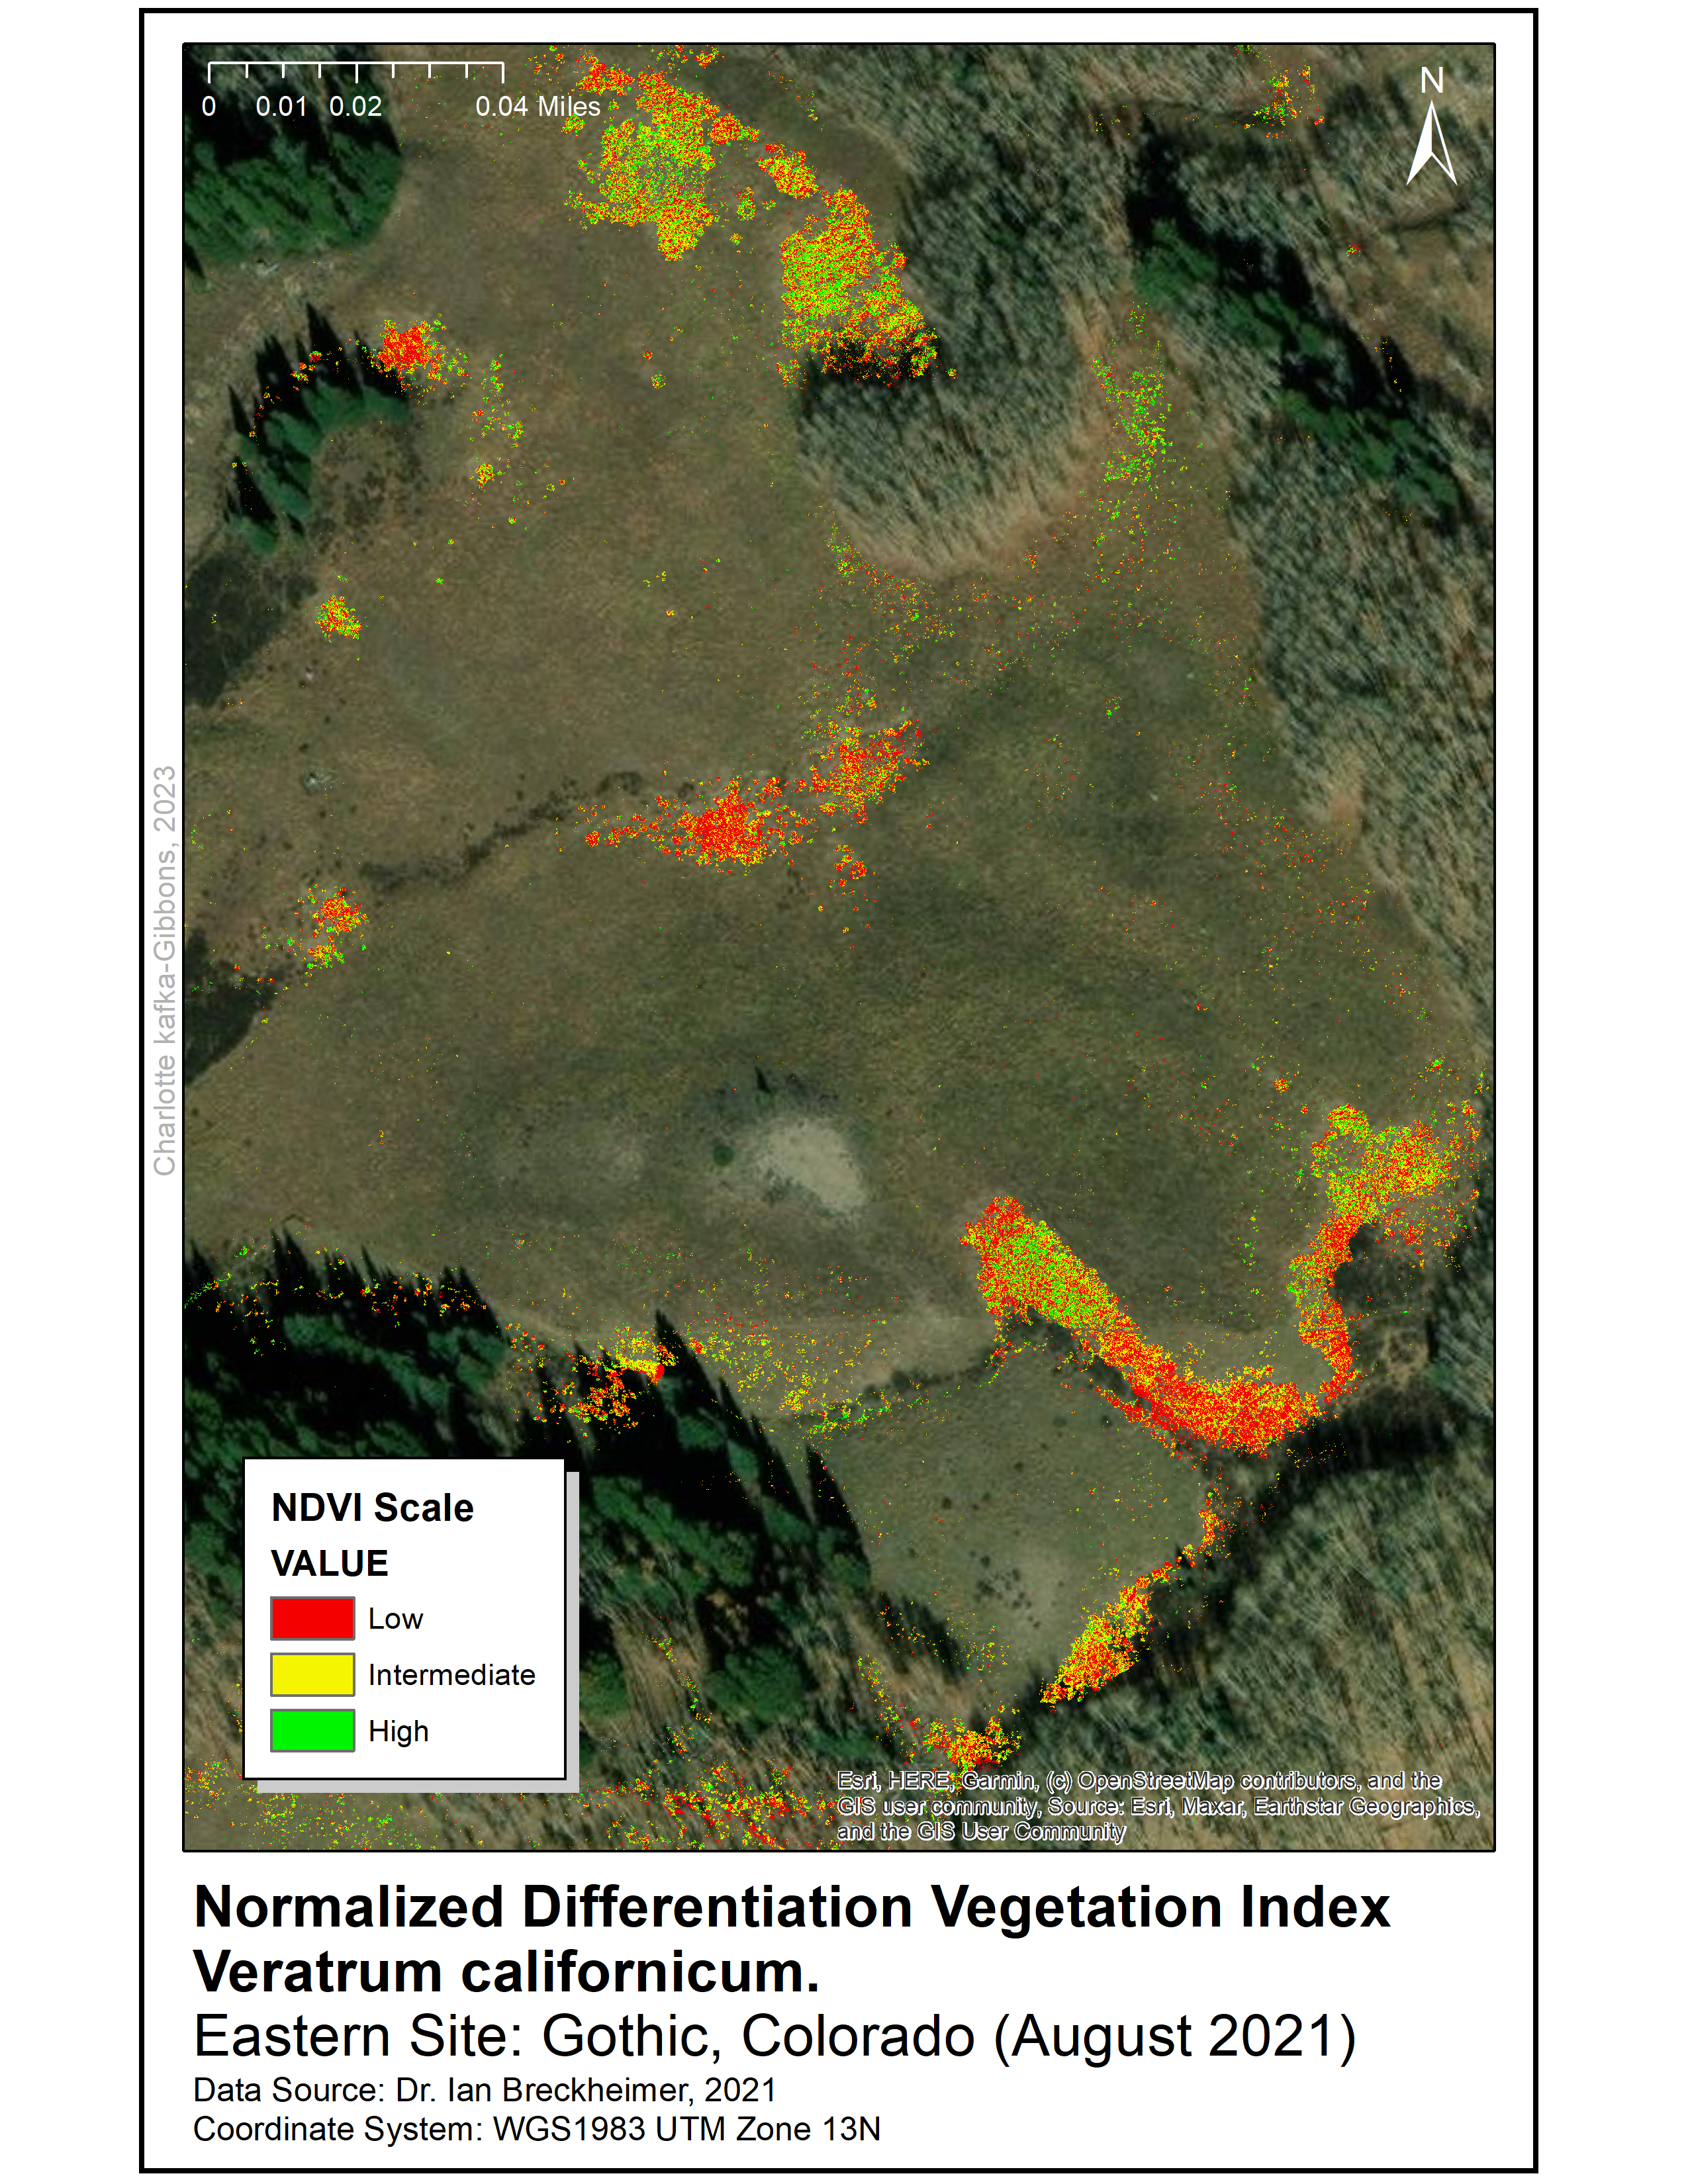
The NDVI raster was used to identify five sampling sites throughout the townsite (See maps). The sites were selected for high density of Veratrum and are approximately 0.5 miles apart. At each site we randomly sampled 10 square 1×1 meter quadrats using marker flags and a meter stick.
- At each quadrat we documented:
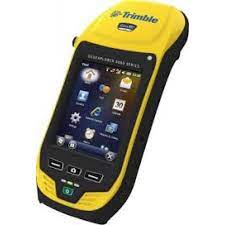
- GPS coordinates using a Trimble GeoXT 6000 (Korec Group, [Liverpool, UK]).
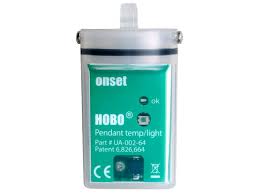
- Air temperature and light intensity using HOBO Pendant Temperature/Light Data Loggers (Onset, [Bourne, MA]) set to collect data every 1 minute for a total of 5 minutes for each plot
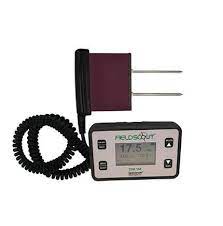
- Average soil moisture from three points in the quadrat using a FieldScout TDR 150 Soil Moisture Meter (Spectrum Technologies, [Aurora, IL]).
- Percent of the quadrat covered by V. californicum: visually estimated to the nearest 5%
- Qualitative assessment of health (by visually estimating the percent of non-green V. californicum) to the nearest 5%
- Percent of herbivore damage to standing plants, visually estimated to the nearest 5%.
Post-Collection Processing:
The Slope (Spatial Analyst) tool was used to calculate a slope raster from the DEM file. We used the join data tool to combine our manually collected field data with the shapefiles produced through documenting our quadrats with the Trimble GPS unit. Next, we used the Zonal Statistics as Table (Spatial Analyst) tool to produce discrete values for each quadrat from continuous NDVI, slope, and elevation surfaces. This produces tables with elevation, slope, and NDVI values that can be joined to the quadrat polygon file. We used inverse distance interpolation to estimate the NDVI value for quadrats that did not directly overlap with pixels on the NDVI raster, allowing NDVI values to be assigned to all quadrat coordinates.
Statistical Analysis:
We ran regressions in RStudio to explore the non-spatial relationships between our manually collected field data, considering relationships between air temperature, soil moisture, and light intensity against Veratrum cover, herbivore damage, and qualitative health. We used the Spatial Autocorrelation (Moran’s I) tool to test for significance of clustering patterns in our quadrat polygons, setting qualitative V. californicum health as the input field and the quadrat points as the focal feature class. Spatial relationships were modeled by inverse Euclidean distance. The Exploratory Regression tool (Geostatistical Analyst) was used to run regressions of predictor variables (slope, elevation, average soil moisture, light intensity, and air temperature) against the NDVI raster.
Findings:
Our results showed that, while V. californicum senescence appears to be driven by environmental variability over the landscape, it cannot be sufficiently modeled by the factors we measured and the number of data points we collected for each factor. Spatial autocorrelation analysis using Global Moran’s I showed that there is less than a 1% chance of the clustering shown in vegetative health distributions to be a random pattern (Z = 4.205; P = 0.000026). Our spatial autocorrelation testing strongly suggested that the variation in vegetative senescence (measured by NDVI) throughout the V. californicum distribution is not driven by chance, but by environmental and ecological factors. Therefore, the results suggest that a successful model for Veratrum health can be synthesized from measures of other biotic and abiotic factors across the landscape. However, there was not a significant relationship shown with our field-collected data, and we were unable to build a multivariate model accounting for more than 30% of the spatial variation in Veratrum NDVI. This inconclusive finding was expected, considering the extremely short timeframe of this study thus our limitation to small sample sizes and number of study sites.
While the factors we studied cannot be used to produce successful models for vegetative health of V. californicum, partial success in model-building suggests that an expanded selection of predictor variables, with a more extensive process of manual data collection may produce successful results. These findings speak to the importance of combining remotely and directly sensed data in developing comprehensive models of complex ecological dynamics. While technologies for remotely collecting environmental data are being rapidly improved, data collected on-the-ground remains highly useful, and can be used to further increase the scope and accuracy of research centering remotely-sensed data.
Works Cited:
Duncan, J., Dash, J., & Atkinson, P. (2015). The potential of satellite-observed crop phenology to enhance yield gap assessments in smallholder landscapes. Frontiers in Environmental Science, 3. https://www.frontiersin.org/articles/10.3389/fenvs.2015.00056
Fu, G., & Shen, Z. X. (2016). Environmental Humidity Regulates Effects of Experimental Warming on Vegetation Index and Biomass Production in an Alpine Meadow of the Northern Tibet. PLoS ONE, 11(10). https://doi.org/10.1371/journal.pone.0165643
Misra, G., Buras, A., Heurich, M., Asam, S., & Menzel, A. (2018). LiDAR derived topography and forest stand characteristics largely explain the spatial variability observed in MODIS land surface phenology. Remote Sensing of Environment, 218, 231–244. https://doi.org/10.1016/j.rse.2018.09.027
Wainwright, H. M., Steefel, C., Trutner, S. D., Henderson, A. N., Nikolopoulos, E. I., Wilmer, C. F., Chadwick, K. D., Falco, N., Schaettle, K. B., Brown, J. B., Steltzer, H., Williams, K. H., Hubbard, S. S., & Enquist, B. J. (2020). Satellite-derived foresummer drought sensitivity of plant productivity in Rocky Mountain headwater catchments; spatial heterogeneity and geological-geomorphological control. Environmental Research Letters, 15(8), 84018-. https://doi.org/10.1088/1748-9326/ab8fd0