
Watershed Analysis Over the Don Valley River: The Potential Pathways of Aqueous Pollutants
Water is a crucial catalyst in propelling an inexhaustible list of anthropogenic activities such as agricultural practices, daily household commodities, and industrial/mining pursuits. Despite being limited to such a finite supply of freshwater resources, future generations will find themselves in a troubling situation as this fundamental resource is being exploited to an irreparable extent by poor practices. As my first GIS project at the University of Toronto, I decided to conduct a watershed analysis over the highly urbanized City of Toronto to unveil possible aqueous contaminant pathways from agricultural and industrial sites leading to Lake Ontario, to propose a watershed that should best be monitored, and to conclude if the highly developed city encourages the movement of said pollutants.
For the purpose of this study, a region closest to the shoreline of Lake Ontario and containing the Don Valley River has been selected. Knowing there is a diverse ecosystem situated around the river itself, we can better visualize the behaviors of artificial versus natural stream networks.
A total of four datasets were retrieved to fulfill this project. These include: Natural Resources Canada’s High Resolution Digital Elevation Model (DEM) from 2015, the Toronto & Region Conservation Authority Landuse Natural Cover 2017, and the Impermeable Surface 2019 and Ravine & Natural Feature Protection Area 2018, both sourced from the City of Toronto Open Data portal.
Before diving into the analysis over the selected region, there are a few parameters set in place when interpreting the maps shown below:
- Since only one DEM is being used, the watersheds generated are accurate to the area, but in reality are part of a much larger watershed.
- Impermeable surfaces are considered to be fully impermeable (i.e. no cracks in sidewalks or roads), and thus groundwater is excluded from this research.
Before starting the watershed analysis, the DEM is scrubbed for any inaccurate elevations caused by potential resolution errors. With an accurate dataset to work with, the flow direction of separate raster cells overlaying the area were calculated to determine flow directions. Potential surface reservoirs were sought out using the flow accumulation tool and the flow directions acquired in the previous step. Delineation of watersheds was done by the manual input of pour points in select areas where flow paths were apparent using the watershed tool. Industrial areas, agricultural plots, impermeable surfaces, and protection areas were added in by clipping their respective datasets to the study area.
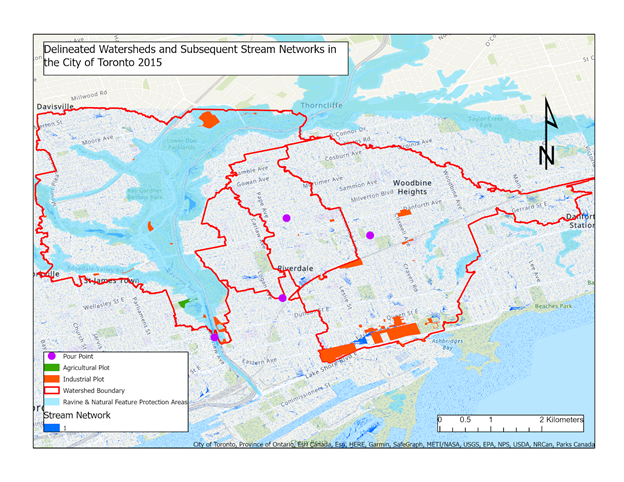
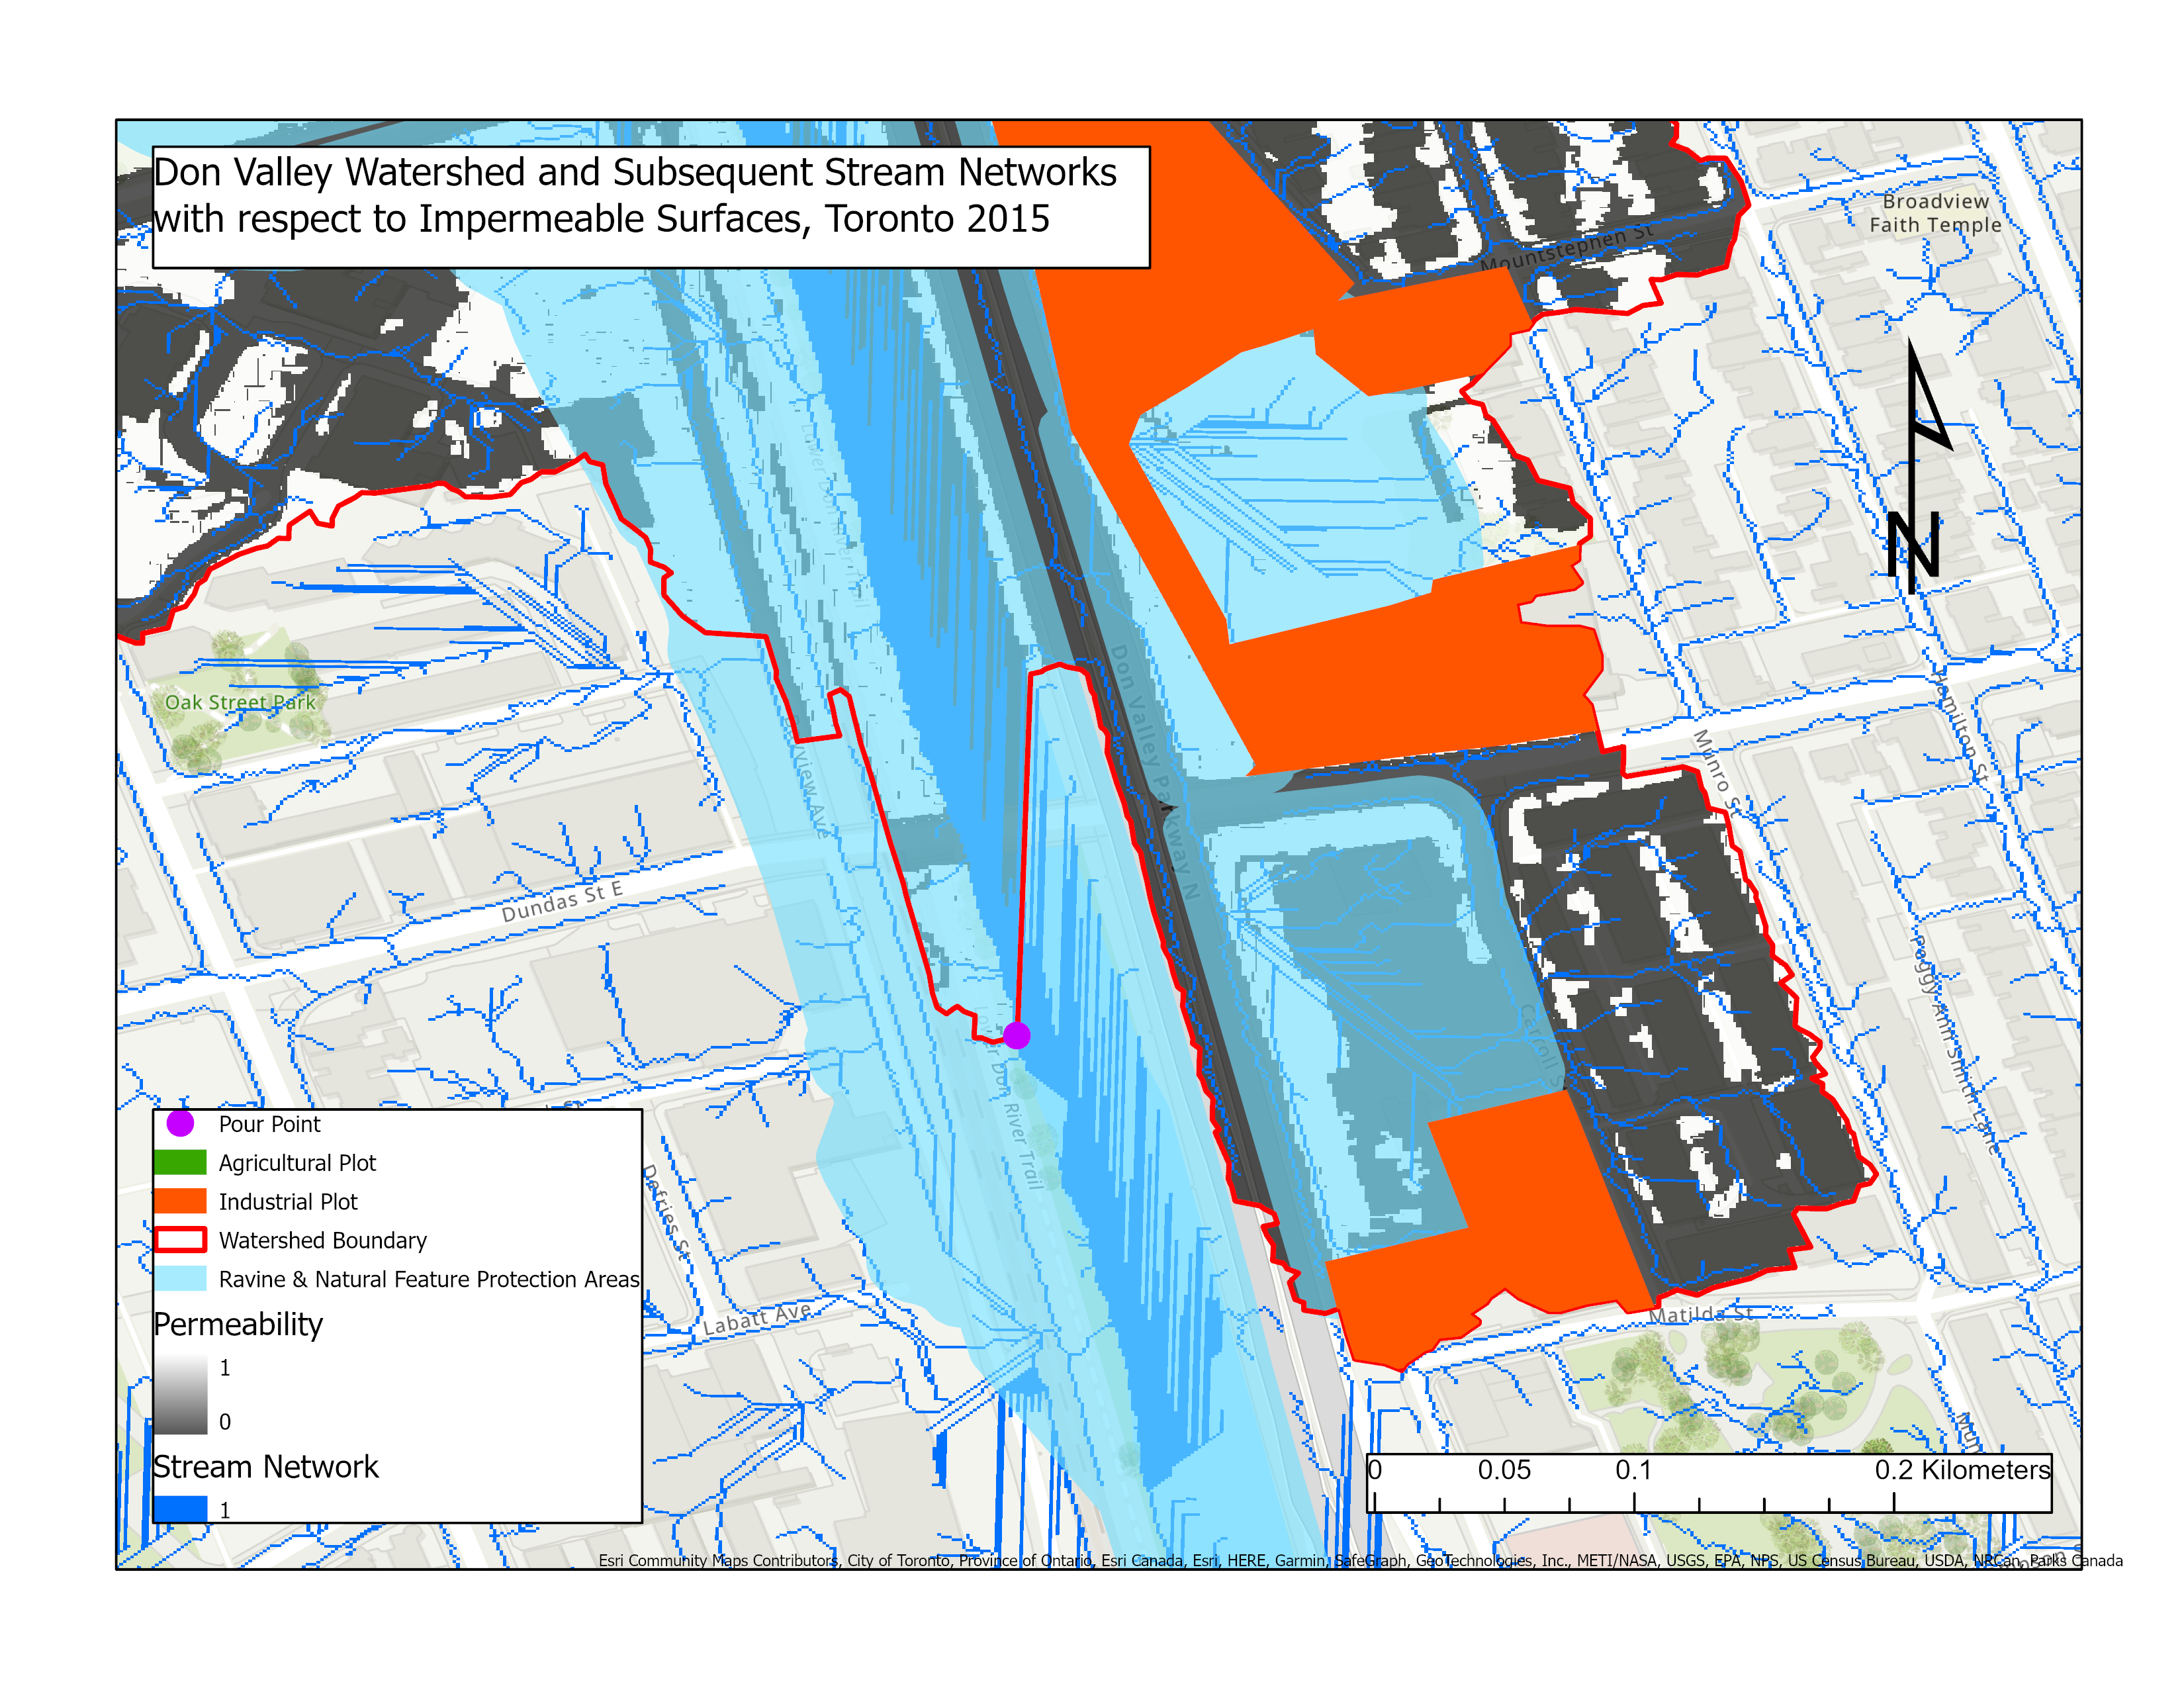
Four watersheds in total have been formulated over the Don Valley Region, with the largest watershed being situated around the river itself at around 10,005,830 km2. The Don Valley watershed, which is supposed to be protected by the City of Toronto’s Municipal Code Chapter 658 – Ravine & Natural Feature Protection, contains two potential sources of pollutants. Zooming into the map for greater detail reveals a notable amount of stream networks amongst the buildings and roads, characterizing the city’s planning scheme as well as the sewer system. Essentially, the loss of the natural tributaries lying underneath the mass urbanization has led to the formation of these artificial tributaries. There does appear to be a possible build up of contaminants between alleys of structures. However, major roadways act as barricades in preventing potential contaminant flow directly onto the lake’s shoreline.
The city’s extensive urbanization proves to be hindering the movement of pollutants into the lake, though that does not mean that the lake’s health is being optimized. These impermeable surfaces being mainly composed of concrete (and thus having fairly low porosity and permeability) do not permit the movement of polluted waters into the lake, yet in the events of major rainfall the possibility of surface runoff is a major factor.
In conclusion, the City of Toronto’s city layout appears to be dampening the flow of contaminants into Lake Ontario, however, runoff is still a considerable factor when it comes to the lake’s health. Of all watersheds, the largest watershed containing the Don Valley River should be monitored regularly as the river provides a entrance for pollutants from many sites throughout the watershed. To improve this mapping of potential contaminant flows, more precise DEMs can be used in the analysis to have a better representation of the geological area and thus closer approximations of the watersheds. Future studies in the area could involve taking an in-depth look at the lake’s scum line with the inclusion of groundwater resources to pinpoint areas under extreme pollutant stress.