
Prediction of Urban Building Permits: Forest-based Classification and Regression (Calgary, Canada)
Introduction
Prior to the lawful construction of any urban structure, the building project must be scrutinized by the pertinent building authority. If the building project is approved in accordance with local regulations, the building permit will be issued (Fauth & Soibelman, 2022). Estimation of building permits is a way to control the urban development process (Wahed et al., 2012; Tasantab, 2017; Noardo et al., 2022), also it helps to understand the potential and capabilities of the local administration (Wahed et al., 2012), residential growth (Noardo et al., 2022), analysis of housing market (Hainc et al., 2019), allocation of urban resources and effective land use planning. The goal of this research is to predict Calgary’s building permits using a Forest-based classification and regression tool on ArcGIS Pro. In this blog post, I will share the association of some factors and the degree of their importance on the number of future building permits in Calgary.
Study Area
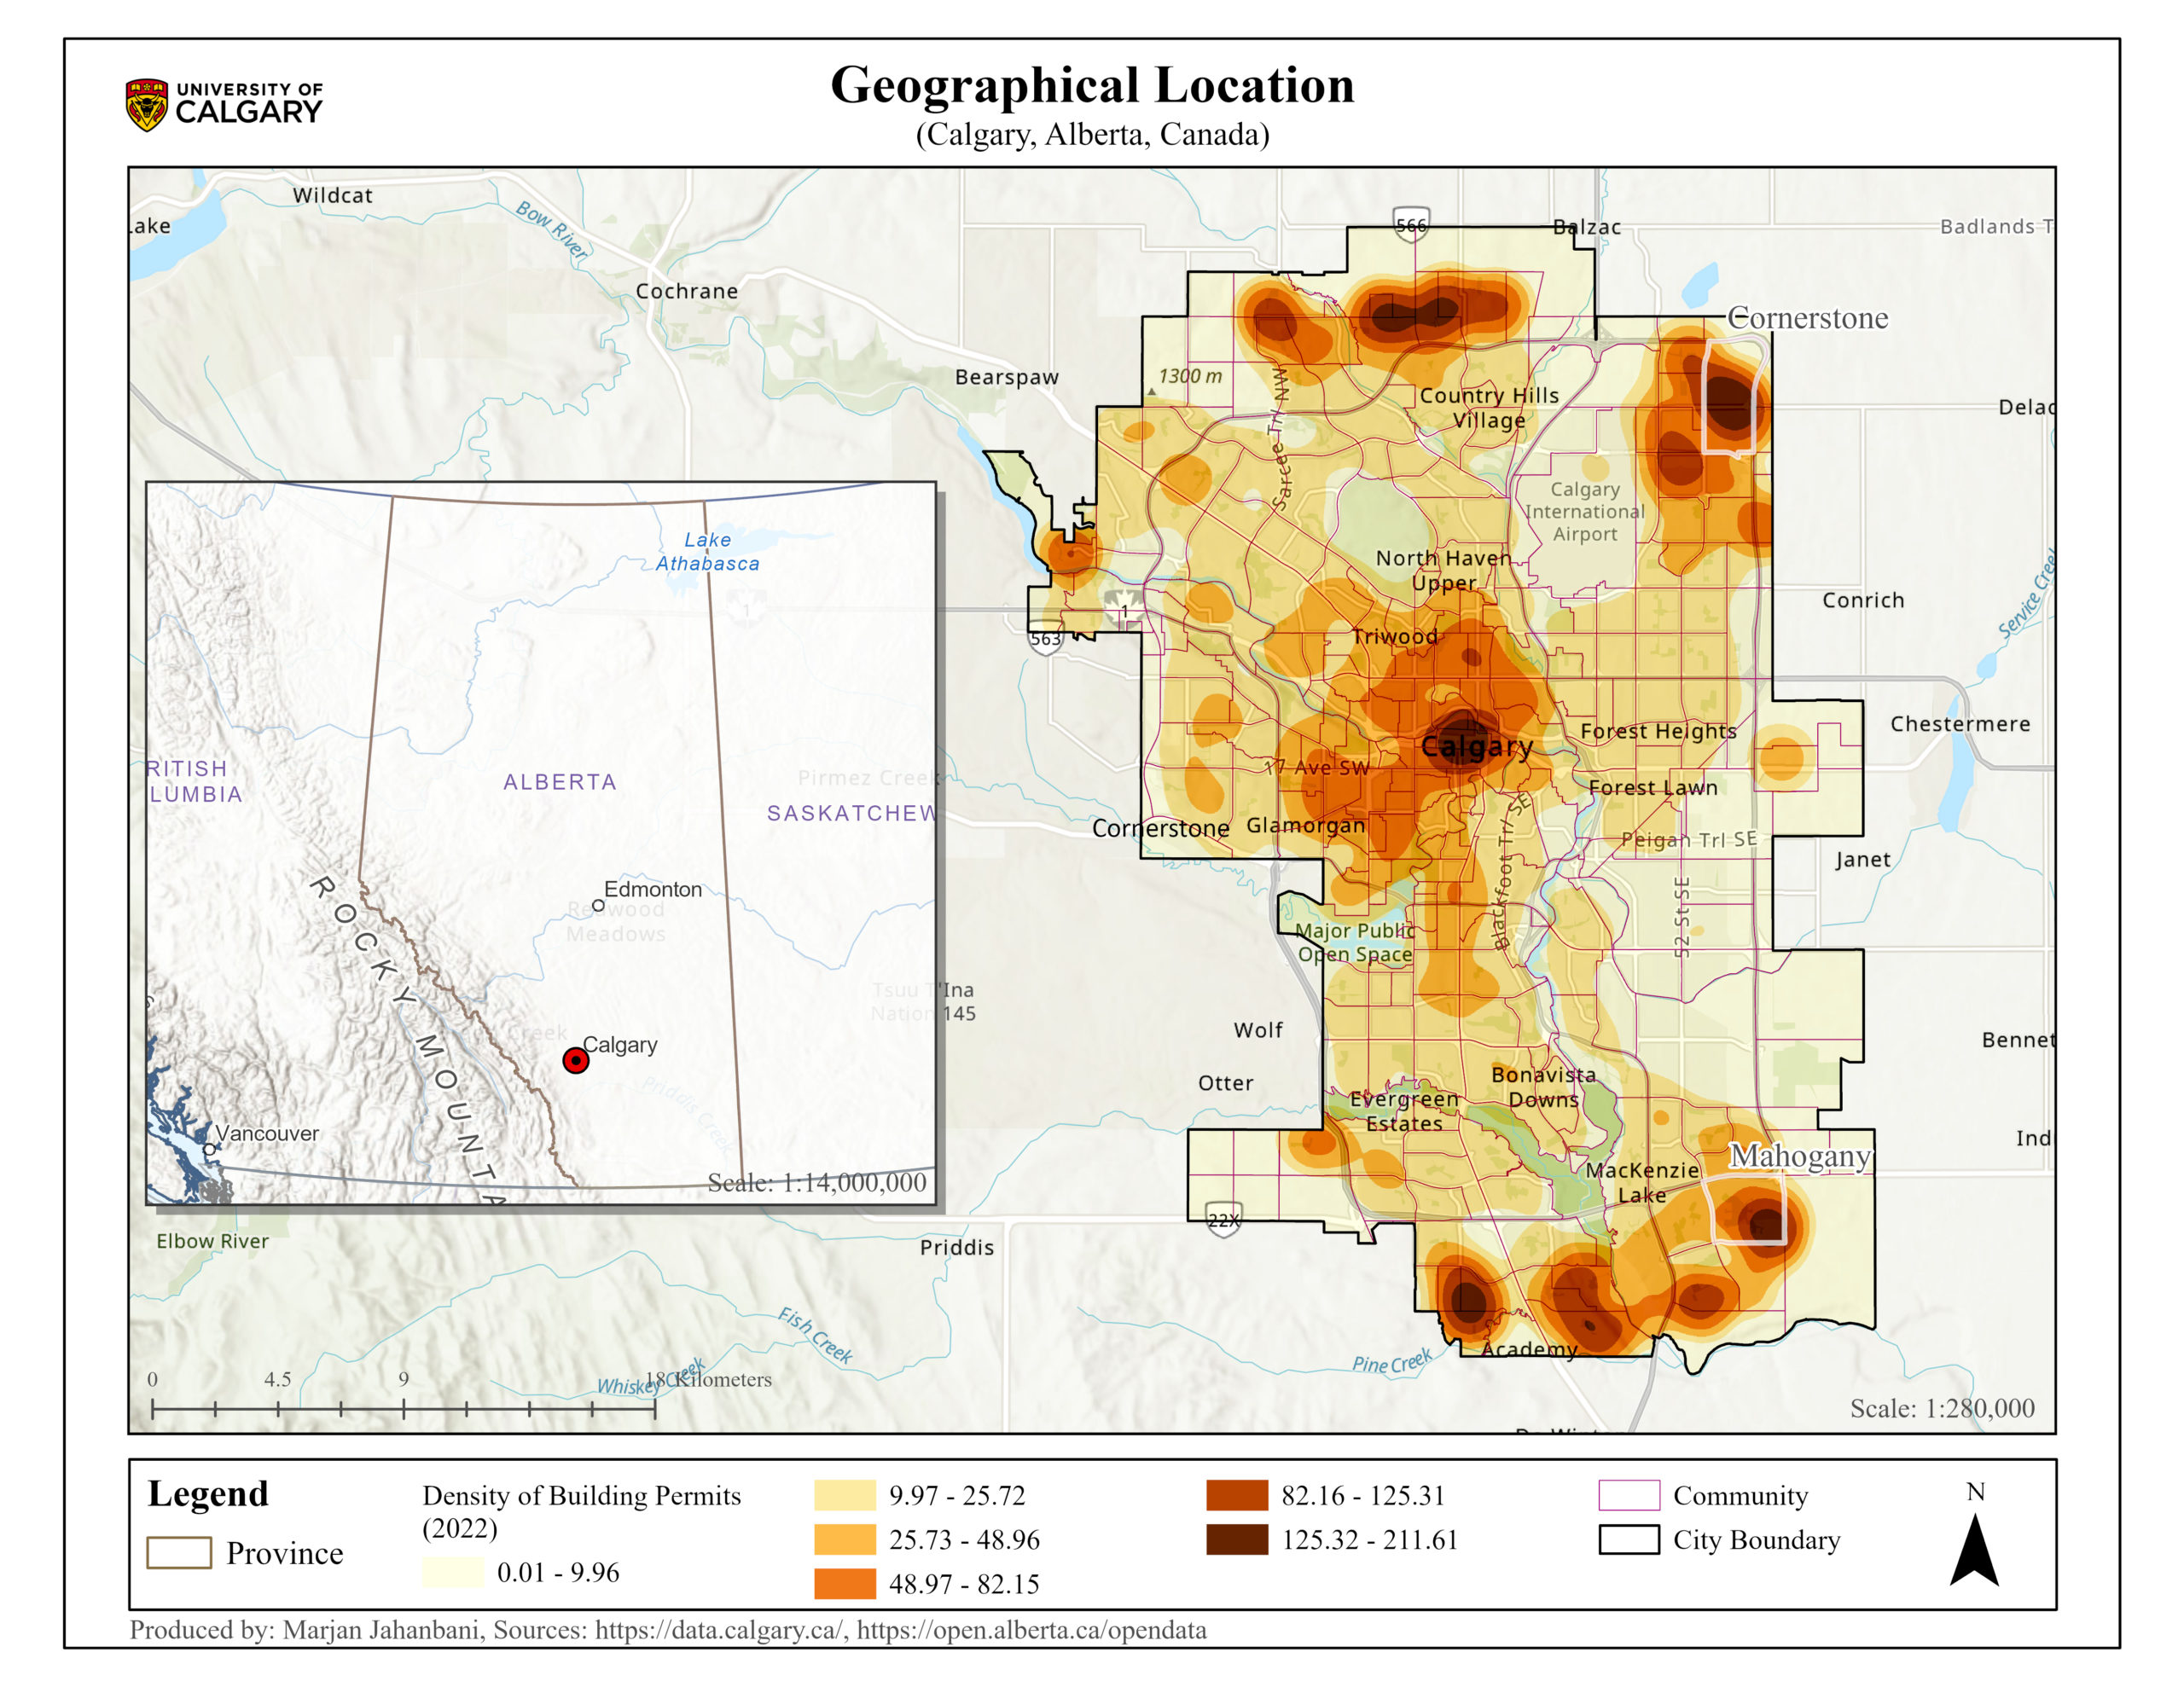
Calgary, where the Bow and Elbow rivers meet, is situated in the south of Alberta, Canada. In 2021, the population of Calgary was 1,306,784 people, with a land area of 820.62 square kilometers and a population density of 1,592.4 people per square kilometer (Statistics Canada, 2021). Based on the Community Census, this urban center consisted of 202 communities in 2016. The number of building permits went up from 14,909 in 2016 to 19,557 in 2022 (Building Permits by Community | Open Calgary, n.d.). In 2022, Cornerstone Community with 885 permits had the highest building permits and Mahogany Community gained second place with 631 (Figure 1).
Method
Random forest, a supervised machine learning method, was developed by Leo Breiman and Adele Cutler. This technique is a collection of tree-structured classifiers generating many individual decision trees and each tree casts a unit vote for the most popular class. The predictors or explanatory variables can be either categorical or continuous data (Breiman, 2001; Mellor et al., 2012; How Forest-Based and Boosted Classification and Regression Works—ArcGIS Pro | Documentation, n.d.).
Results
To predict Calgary’s building permits (dependent variable), nine independent variables were put into the model. Most of the variables are quantitative with ratio data level except for nominal urbanization status, representing the developed and developing areas in the city. Moreover, some explanatory variables come from different years acknowledging temporal mismatch.
| Dependent Variable | Independent Variables | Data Level |
|---|---|---|
| Units under construction | Ratio | |
| Number of homeowners | Ratio | |
| Number of not accepted buildings | Ratio | |
| Density of residents | Ratio | |
| Building Permits | Mean floor | Ratio |
| Median household income | Ratio | |
| Immigrants | Ratio | |
| Traffic volume | Ratio | |
| Urbanization status | Nominal |
To avoid the overfitting of the model and better performance, the Forest-based classification model was run with five hundred trees, and the “Number of Runs for Validation” was set at 10 meaning that the model ran the algorithm with different subsets 10 times and each time ten percent of the data were excluded for validation (i.e.,10 percent of the data were not utilized for predicting the model). The R-squared value for the training data is 0.967 meaning the model can predict almost 96.70 % of the variation in the dataset however to avoid overfitting of the model the R-squared value of validation data can be a better indicator of the model performance which represents a value of 0.819, meaning the model estimates Calgary’s building permits with an accuracy of about 81.90 % on the unseen data (Table 2). Another parameter that can represent the model’s accuracy is the Out of Bag (OOB) error which helps to evaluate the degree to which a model predicts the excluded features. These errors are reported not only for half the number of set trees but also for the total number of those. These numbers aid in evaluating whether increasing the number of trees positively impacts the performance of the model and enhances it. If the values reported for the errors and percentage of variation explained are close together and there is not a significant difference between values for both numbers of trees, it indicates that the inclusion of extra trees into the model does not significantly increase the model performance (How Forest-Based Classification and Regression Works—ArcGIS Pro | Documentation, n.d.). Considering Table 3, The mean squared error for 250 and 500 trees has a narrow difference therefore the number of trees was not increased due to no impact on the better performance of the model.
| Number of Trees | Type of Data | R-squared | P-value | Standard Error |
|---|---|---|---|---|
| 500 | Validation Data | 0.819 | 0.000 | 0.066 |
| 500 | Training Data | 0. 967 | 0.000 | 0.011 |
| Number of Trees | 250 | 500 |
|---|---|---|
| Mean squared error (MSE) | 2509.91 | 2497.14 |
| Variation explained | 61.70 | 61.89 |
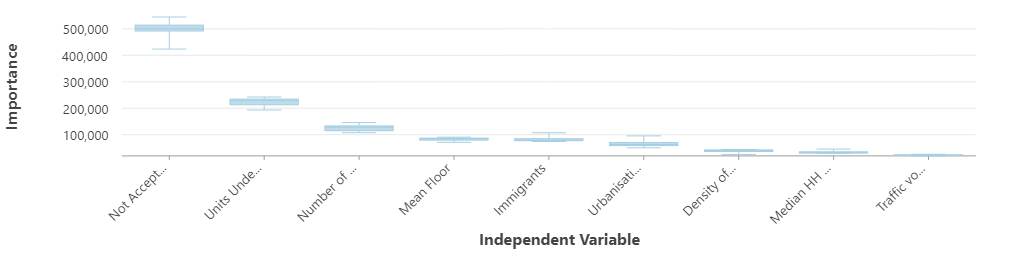
Given the height and whiskers of the boxes, not-accepted buildings gathered from building physical assessment, represent not only great variability but also a wider range of importance across the runs. Therefore, in ten runs, this independent variable has the highest importance and distribution compared to the others, in the other ten runs under-construction units are also significant meaning that these variables are very influential and useful in predicting building permits, as a result. In addition, Table 4 represents the percentage of contribution of each variable to the prediction of Calgary’s building permits. The number of not-accepted buildings stands on the top of the list with 40 percent of importance indicating the higher the number of not-accepted buildings in a community, the higher the number of building permits, and this variable is significantly associated with the dependent variable. However, in terms of traffic, the summary of variable importance (Figure 2) and Table 4 show that the traffic volumes have the lowest distribution and impact in the prediction over the ten runs.
| Independent Variables | Importance (%) |
|---|---|
| Number of not accepted buildings | 40 |
| Units under construction | 18 |
| Number of homeowners | 12 |
| Immigrants | 10 |
| Mean floor | 7 |
| Urbanization Status | 5 |
| Median household income | 3 |
| Density of residents | 2 |
| Traffic volume | 2 |
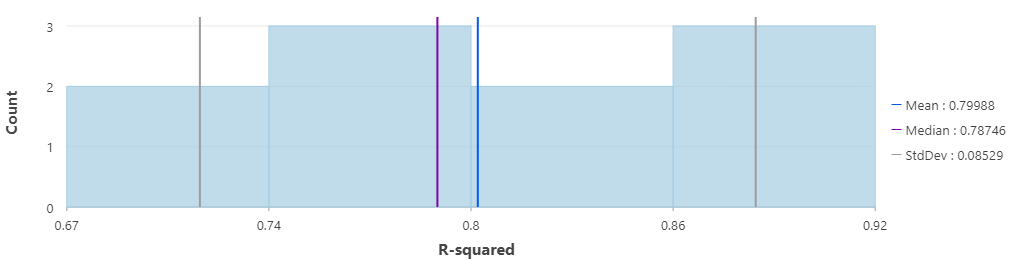
R-squared is a measure showing the goodness-of-fit of the model. Based on Figure 3, the R-squared values range from 0.67 to 0.92 showing the degree that the model can explain the variance in the dataset. On average, the model can explain about 79% of the variance in the dataset over ten runs. Since the Median is less sensitive to outliers in the dataset, in this case, it shows a value of 0.78 suggesting a median goodness-of-fit of the model. In addition, the low value of the standard deviation (0.08), represents the consistency of the model implying the lower dispersion of R-squared values from the mean.
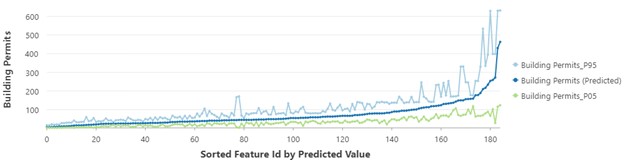
As shown in Figure 4, the upper and lower bounds of predicted values were represented in light blue and green lines. By applying these independent variables, it can be concluded with 90 percent confidence that new estimated values will fall within this range. The prediction interval is very narrow for lower values implying a better model’s performance at predicting these values, but the higher the values, the larger the intervals showing a sign of increasing uncertainty and lower stability of the model. As a result, the model performance is not stable across all the values owing to the observation of high uncertainty.
The model prediction was performed only for 185 communities due to some gaps in the data. Based on Figure 5, the prediction map represents the outcomes of the model symbolizing the communities based on the number of building permits in the future. In addition, the residual map, containing a range of positive to negative values, illustrates the differences between the recorded and predicted building permits. The negative residuals show that the predicted values are too high from the real record of building permits in 2022. On the other hand, the positive residuals mean that the predicted building permits were too low compared to the actual values in 2022. Generally, two communities named Mahogany (southwest) and Saddle Ridge (northeast) have the highest number of estimated values among 185 communities, but they represent positive residuals meaning the model estimation of building permits is lower than the recorded values in 2022, as a result, the model prediction is not very precise for these communities and there are signs of poor prediction.
The performance map identifies the communities where the predictions were accurate, poor, or overfitted. According to this map, the number of building permits was estimated accurately for 115 communities among which Panorama Hills (located in the north) and Cityscape (Situated in the northeast) Communities have the highest number of predicted building permits with 210 and 177 permits sequentially in the future. In other cases, poor and overfitted predictions were observed for communities that could have originated from spatial heterogeneity, temporal difference, missing data of variables, model complexity, and outliers.
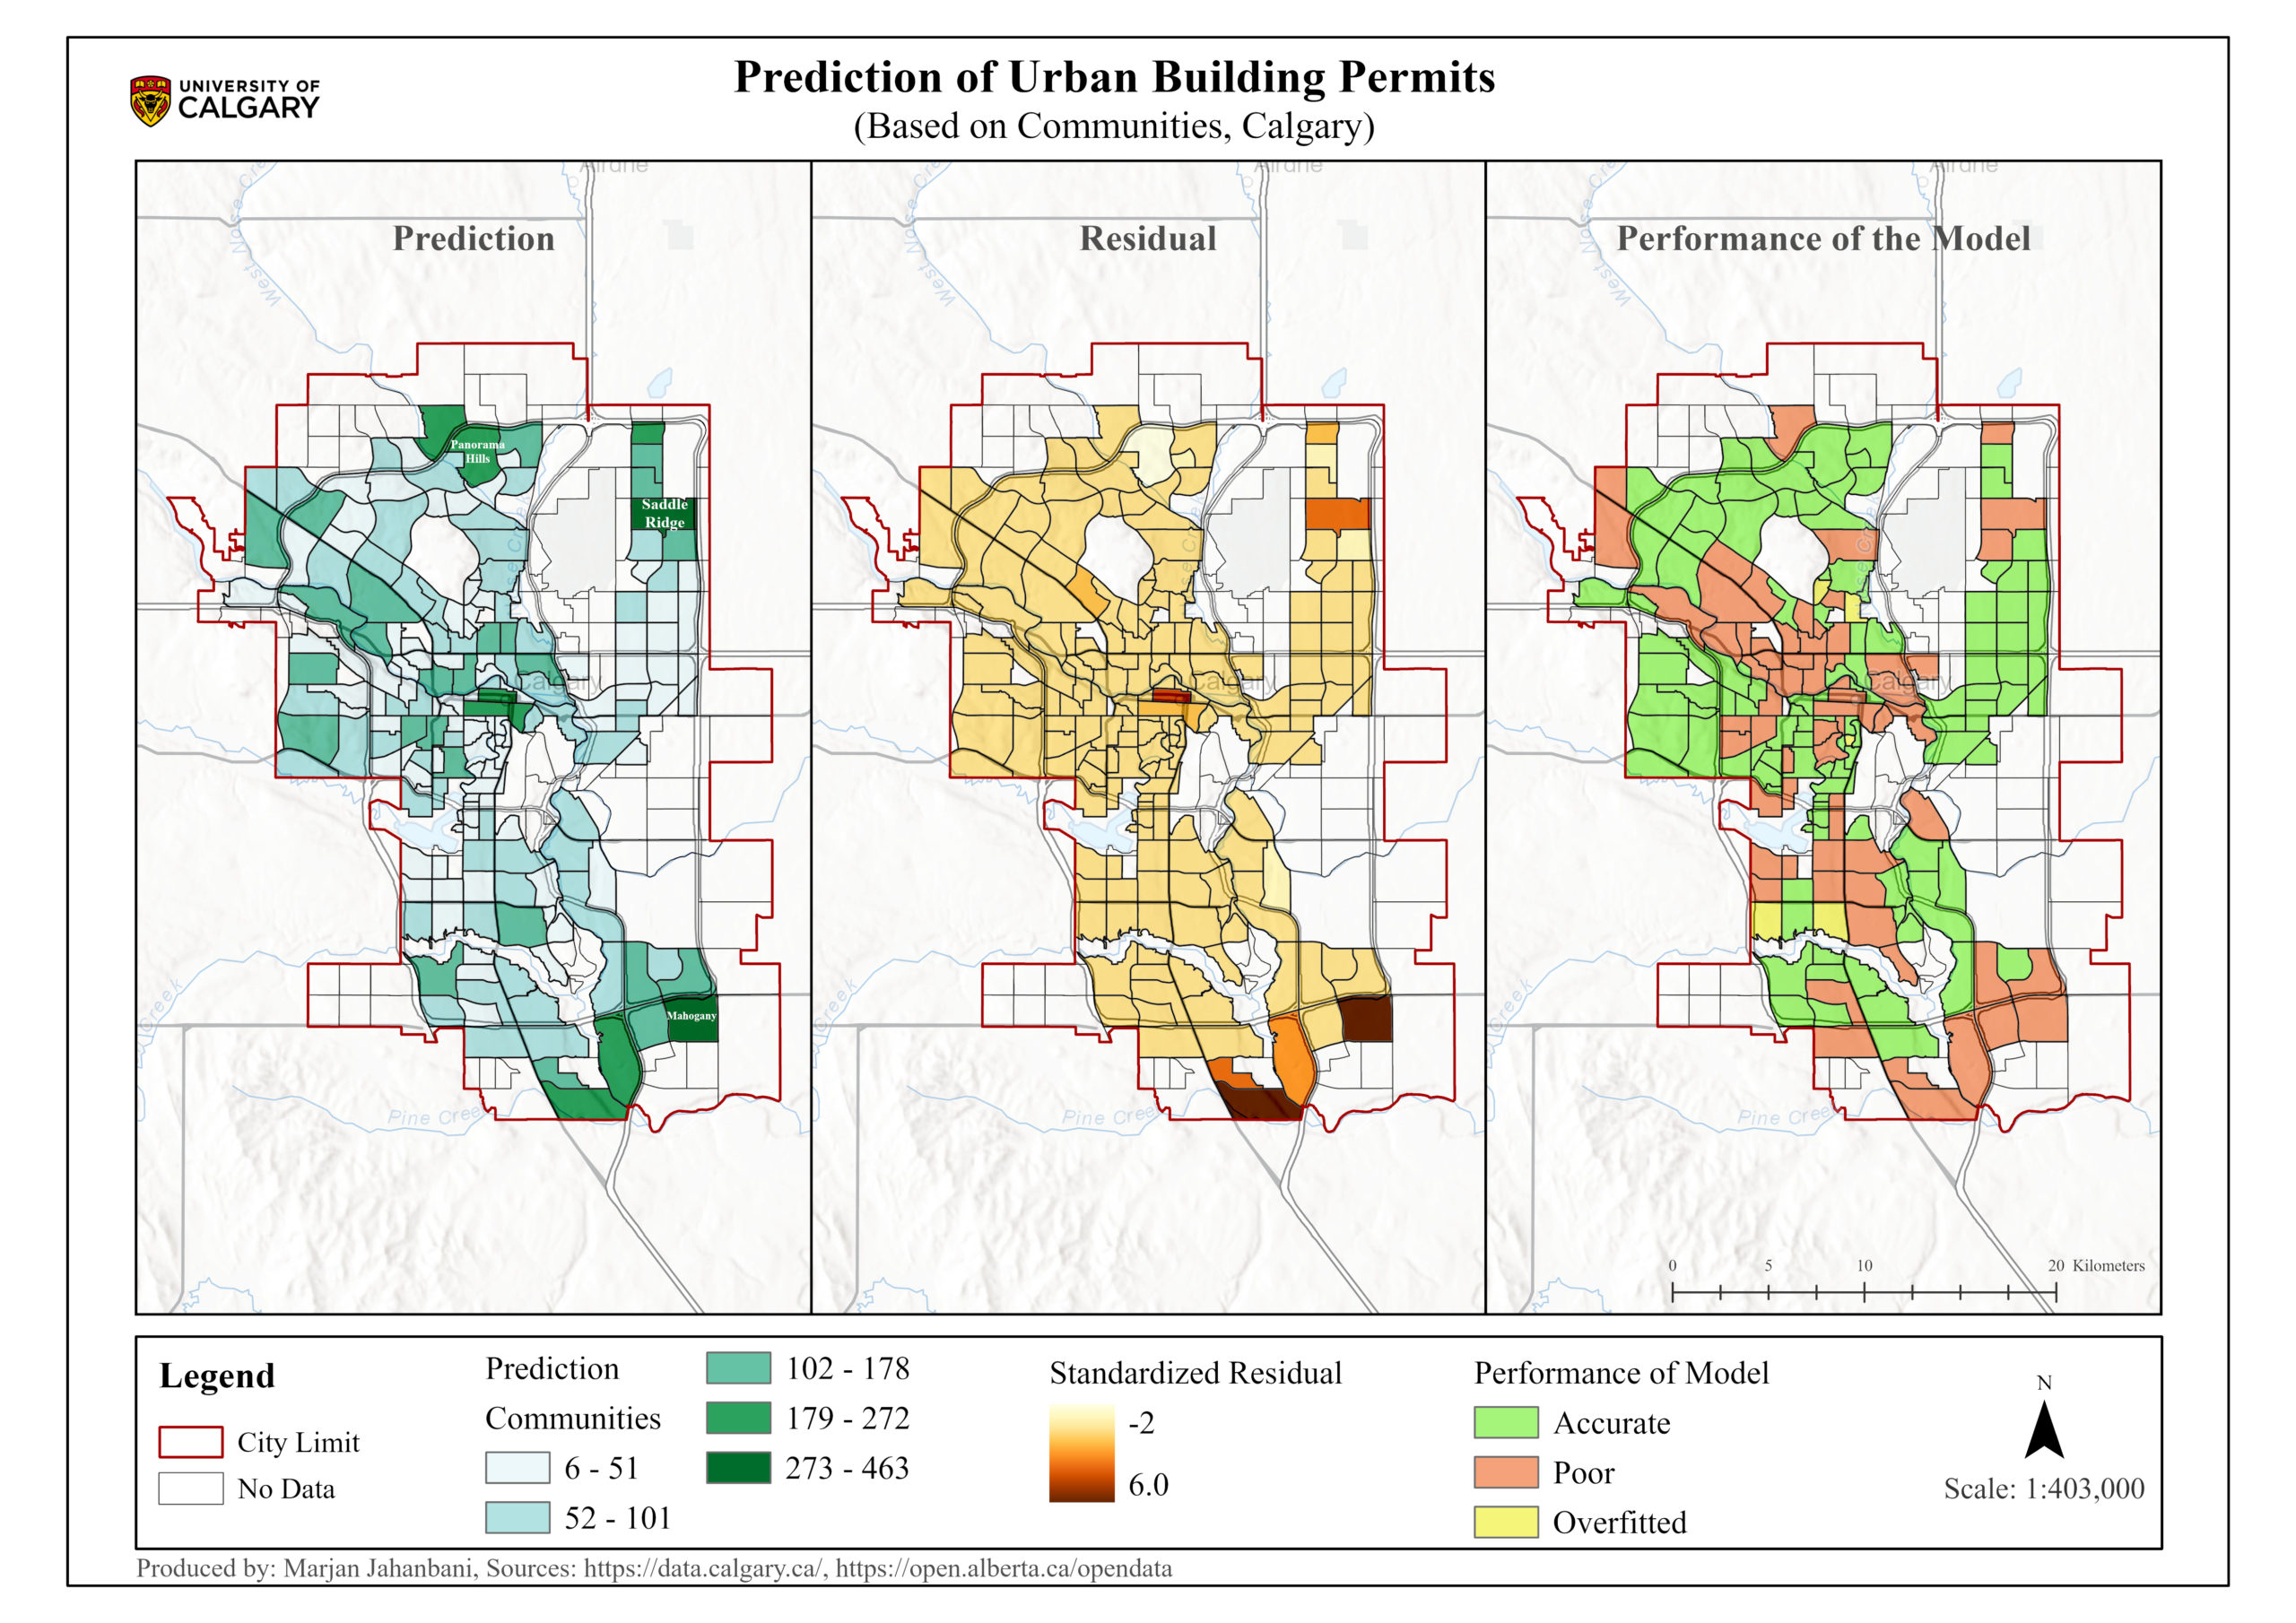
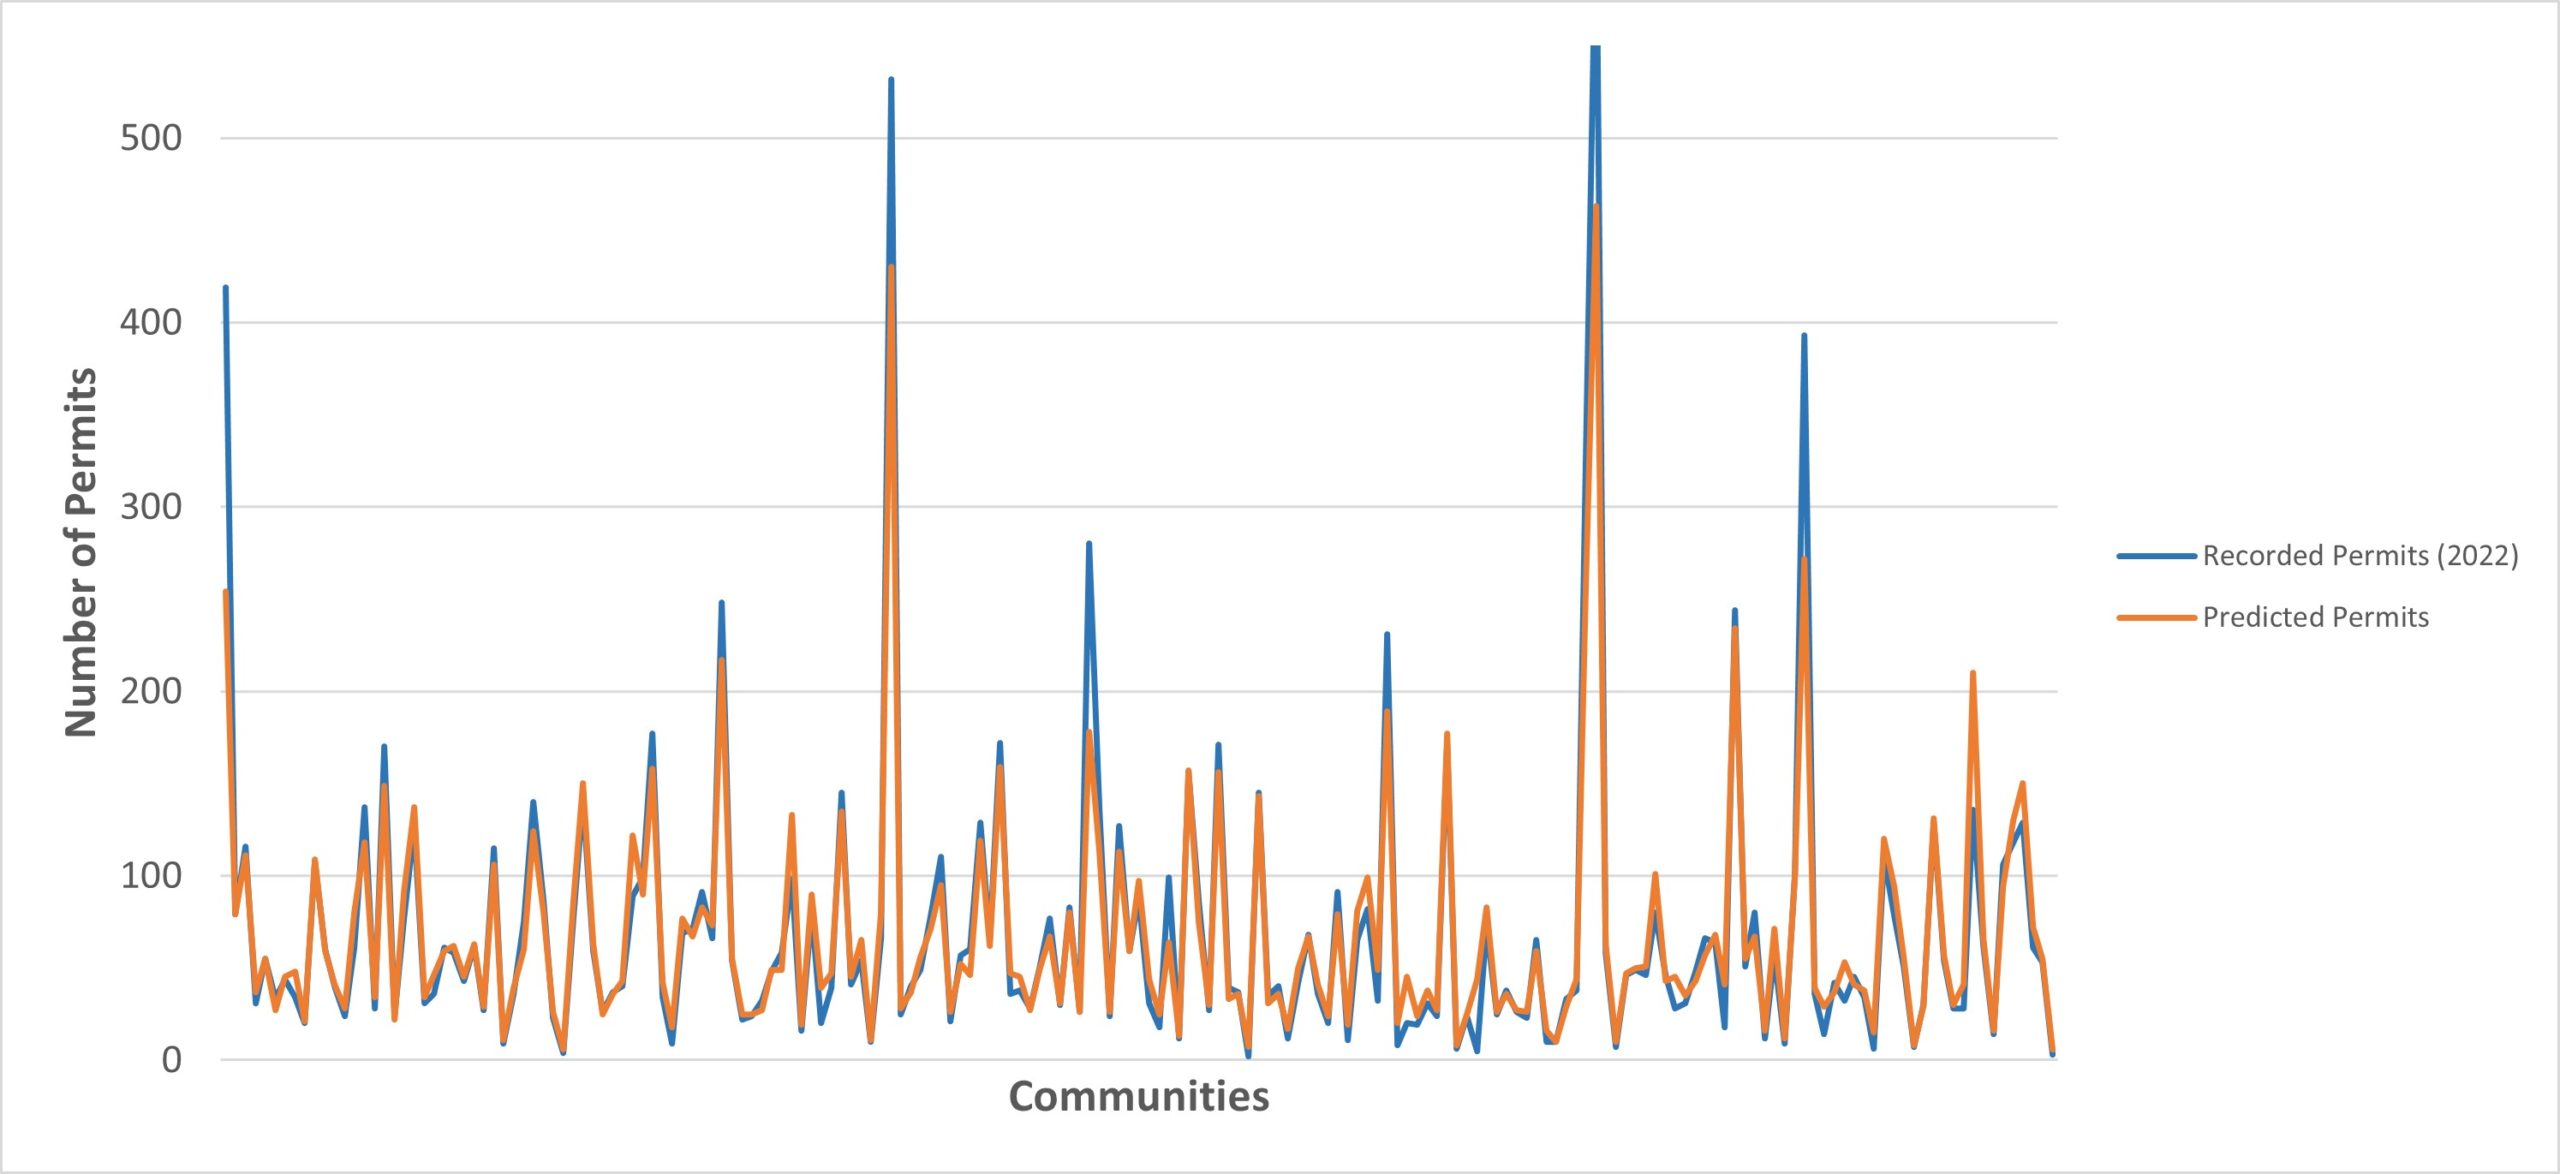
Figure 6 juxtaposes the recorded and estimated charts of building permits. Where the estimated chart is upper compared to the real data, it shows that the explanatory variables accurately predicted the estimation. On the contrary, in some communities, the predicted chart is below the real data indicating poor prediction of the response variable. Therefore, considering the values of residuals and the model’s performance, it can be perceived that the regression model could predict Calgary’s building permits to some extent and the model’s performance is mediocre.
Conclusion
Calgary’s building permits were predicted using Forest-based classification and regression based on nine indices. The final output represents that the buildings with unacceptable inspection results (40%) and units under construction (18%) play significant roles in the estimation of Calgary’s building permits. R-squared values for validation and training data are approximately 81 and 96 percent respectively showing the model can explain most of the variation in the number of building permits however this parameter cannot solely identify the goodness-of-fit of the model. Given the prediction interval chart and residual values, it can be drawn that the performance of the model is not stable for all the communities and reveals a partially accurate estimation. In other words, the model performs poor prediction for some communities due to uncertainty originating from data properties. Ultimately, based on the results showing accurate prediction, two communities named Panorama Hills (210 building permits) and Cityscape (177 building permits) have the highest estimated values, implying that the decision-makers should pay attention to these communities in terms of urban resources, capacity of development, and accommodation of future population.
Reference
Breiman, L. (2001). Random forests. Machine Learning, 45(1), 5–32. https://doi.org/10.1023/A:1010933404324
Building Permits by Community | Open Calgary. (n.d.). Retrieved December 21, 2023, from https://data.calgary.ca/Business-and-Economic-Activity/Building-Permits-by-Community/kr8b-c44i
Fauth, J., & Soibelman, L. (2022). Conceptual Framework for Building Permit Process Modeling: Lessons Learned from a Comparison between Germany and the United States regarding the As-Is Building Permit Processes. Buildings, 12(5). https://doi.org/10.3390/buildings12050638
Hainc, J., Hudeček, T., Čtyroký, J., Vojtíšková, Z., & Gardoňová, A. (2019). Long-term sustainable development of Prague, Czech Republic: Proposal for changes in administrative division for the authorization of new construction. WIT Transactions on Ecology and the Environment, 238, 35–45.
How Forest-based and Boosted Classification and Regression Works—ArcGIS Pro | Documentation. (n.d.). Retrieved December 2, 2023, from https://pro.arcgis.com/en/pro-app/latest/tool-reference/spatial-statistics/how-forest-works.htm
How Forest-based Classification and Regression Works—ArcGIS Pro | Documentation. (n.d.). Retrieved November 28, 2023, from https://pro.arcgis.com/en/pro-app/3.1/tool-reference/spatial-statistics/how-forest-works.htm
Mellor, A., Haywood, A., Jones, S., & Wilkes, P. (2012). Forest Classification using Random forests with multisource remote sensing and ancillary GIS data. 16th Australian Remote Sensing and Photogrammetry Conference, January.
Noardo, F., Guler, D., Fauth, U., Malacarne, G., Ventura, S. M., Azenha, M., Olsson, P.-O., & Senger, L. (2022). Unveiling the actual progress of Digital Building Permit: Getting awareness through a critical state-of-the-art review. Building and Environment, 213(108854). https://doi.org/https://doi.org/10.1016/j.buildenv.2022.108854
Statistics Canada. (2021). Census Profile. https://www12.statcan.gc.ca/census-recensement/2021/dp-pd/prof/details/page.cfm?Lang=E&GENDERlist=1,2,3&STATISTIClist=1&HEADERlist=0&DGUIDlist=2021A00054806016&SearchText=calgary
Tasantab, J. C. (2017). Building Permit as a Tool for Development Control : Evidence from Sekondi- Building Permit as a Tool for Development Control : Evidence from Sekondi-Takoradi. November 2016.
Wahed, M. M. A., Barmalgy, M. M. El, & Haggag, M. R. (2012). Towards an advanced mechanism to benefit from information systems in the issuance of building permits. HBRC Journal, 8(1), 58–63. https://doi.org/https://doi.org/10.1016/j.hbrcj.2012.08.007