
Developing a Better Appreciation of the Value of a Geographical Approach Through the Use of ArcGIS
I always wanted to acquire GIS capabilities, but my busy schedule as an urban development practitioner did not permit me. However, the advent of big data and the need to remain competitive in the ever-changing global labor market was the push required to embark on the Master of GIS program at the University of Calgary. Despite a hectic term, I am delighted about the progress I have made, which is why I am sharing a few highlights from my GIS learning journey in this post.
Welcome to the world of Esri
My initial belief was that GIS was fundamentally about mapping, but my experience in the MGIS program has dispelled this notion. I was introduced to various tools on different ArcGIS platforms during the Fall Term, and within four months I have enhanced my spatial analytics capabilities by taking 26 Esri online courses to complement instructor-led classes and lab assignments at school.
From starting with little or no GIS capabilities, I can now design static and dynamic maps in both 2-D and 3-D scenes, use different 3-D tools to enhance my maps, as well as export maps from ArcGIS Pro to ArcGIS online, and create a story map. I can also conduct different spatial analyses on vector and raster datasets such as proximity analysis, overlays and extract operations, pattern analysis, local operations, neighborhood operations, and zonal operations. I learned how to derive slope, contour, and hillshade maps from Digital Elevation Models (DEMs) as well as perform viewshed analysis, line-of-sight analysis, watershed analysis, landcover classification, and band rationing using different tools in ArcGIS Pro.
Figure 1 is a layout where the primary map shows flights from Heathrow to major cities on the North American continent and the insert shows flights from Heathrow to major cities globally. The maps were designed using a customized projection which made the location of Heathrow the point of origin, and a query was used to show only cities in North America in the primary map. The base map was obtained from Esri online and it made the map to be more visually appealing. Also, due to the objective of the visualization, I decided not to include a title but instead used a callout.
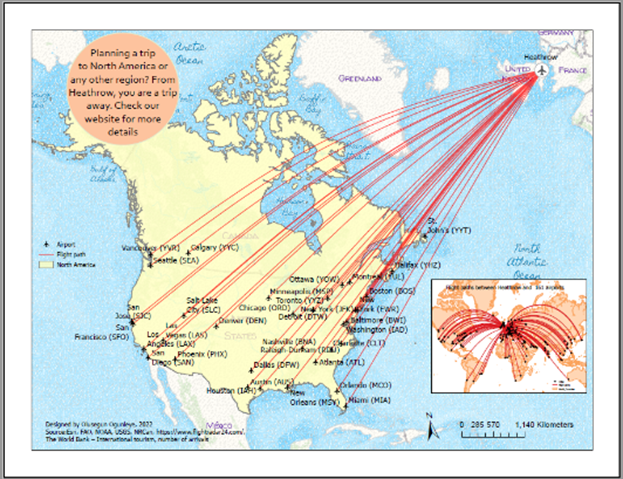
Figure 2 is a Layout showing two trails. The essence was to enable runners to comprehend the level of difficulty of the race. This was accomplished by using a 3-D perspective to show the extruded elevation points of the trail as well as an elevation profile created by using the Interpolate Shape tool in ArcGIS Pro.
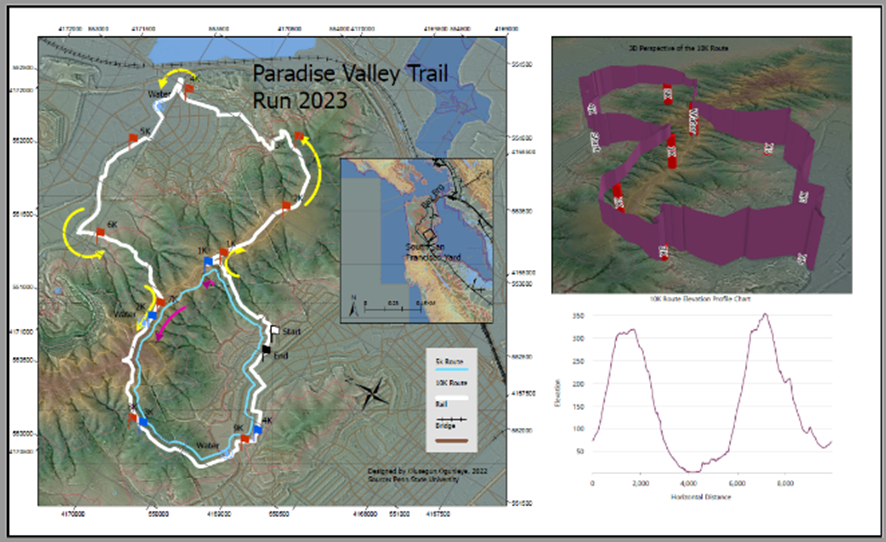
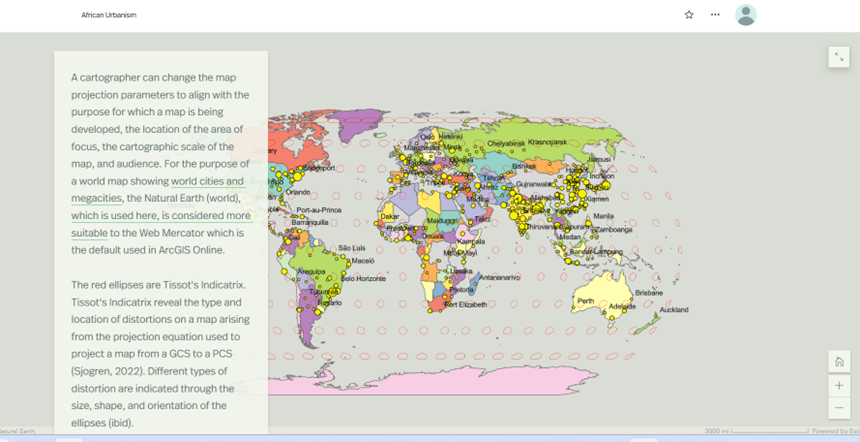
Figure 3 is a world multiscale map showing world cities and Major cities included in my first story map. It was designed with a customized projection and imported into ArcGIS Online and subsequently into story map.
Beyond understanding how to use these tools in ArcGIS Pro, I also understand how they can be applied. For instance, the viewshed analysis can assist in determining where to locate watchtowers to monitor forest fires as well as determine suitable locations for landfill sites. On the other hand, the proximity tool can be used to find the closeness of houses to a pipeline or pipelines, while the network analysis tool can be used to determine the service coverage of existing business outlets or public facilities as well as where to locate new ones. Lastly, combinations of these tools and processes can be used to carry out complex analyses such as watershed analysis, Flood Impact Analysis, and land suitability analysis.
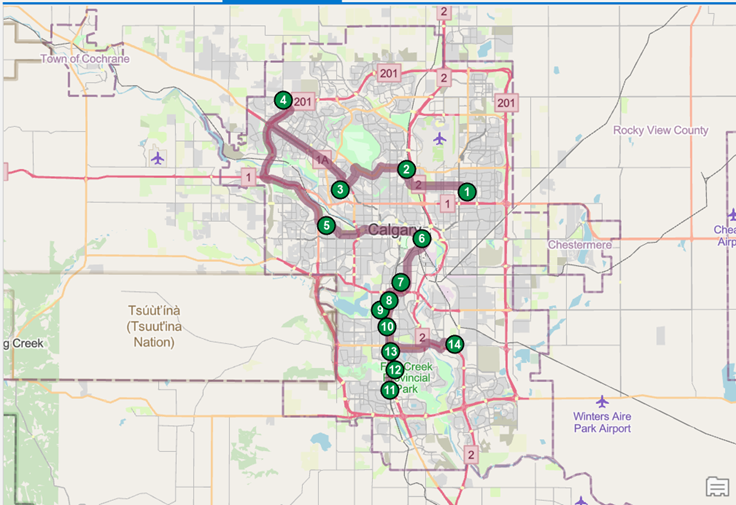
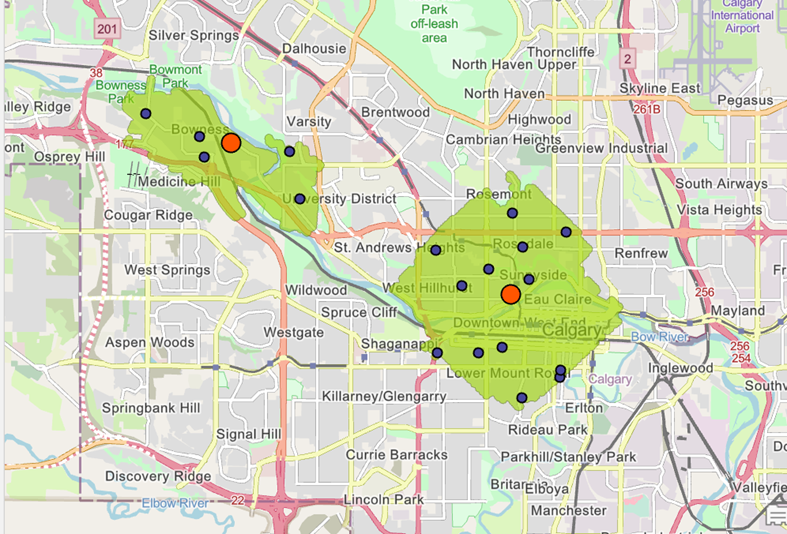
Figures 4 and 5 are derived using the network analyst tool in ArcGIS Pro. Figure 4 was created by using the network analyst to determine the best route starting from a predefined location, while Figure 5 entails calculating the service areas of two facilities. These are useful tools for routing purposes for logistic companies and for visualizing areas that are underserved by public facilities or businesses.
Next step
I look forward to further enhancing my spatial analytics capabilities during the winter semester, and through subsequent research. I am eager to learn how to develop diverse types of loosely and tightly coupled models as well as how to integrate deep learning into my models using different tools on ArcGIS. I promise to keep you posted about my learning experience and hope to inspire the next generation of spatial analysts.