
Using ArcGIS Field Maps to Collect Data on Sidewalk Obstacles in Calgary, Alberta, Canada
As a Master of Geographic Information Systems (MGIS) Student and a research assistant for Dr. Victoria Fast at the University of Calgary, I had the opportunity to assist in setting up and leading a module for undergraduate students that would require them to recognize barriers in the built environment that would affect the accessibility of pedestrian pathways for people with disabilities. In the module, we used ArcGIS Field Maps to collect data about obstacles on sidewalks to understand the different levels of sidewalk accessibility in residential neighbourhoods. Obstacles are anything that is considered a barrier in the built environment. In this case, that includes anything that is obstructing the pathway of any pedestrians using a sidewalk. For my role, I had two main responsibilities that included the technical setup for using ArcGIS Field Maps, and facilitating the subsequent fieldwork to collect data.
Setting up ArcGIS Field Maps (Technical)
To begin, Field Maps needed to be set up for the field data collection step to run smoothly. This involved setting up a geodatabase using ArcGIS Pro, publishing the geodatabase as a feature layer in ArcGIS Online, creating a new web map with the feature layer, and opening the newly created web map in Field Maps.
In the first step, nine types of obstacles were identified in this study:
- narrow sidewalk/pathway;
- ground obstacles;
- overhead obstacles;
- missing curb cuts;
- broken/uneven pavements;
- maze gates;
- manual doors (without automatic door buttons);
- stairs without a ramp option; and
- other types of obstacles such constructions and abrupt end of the sidewalk.
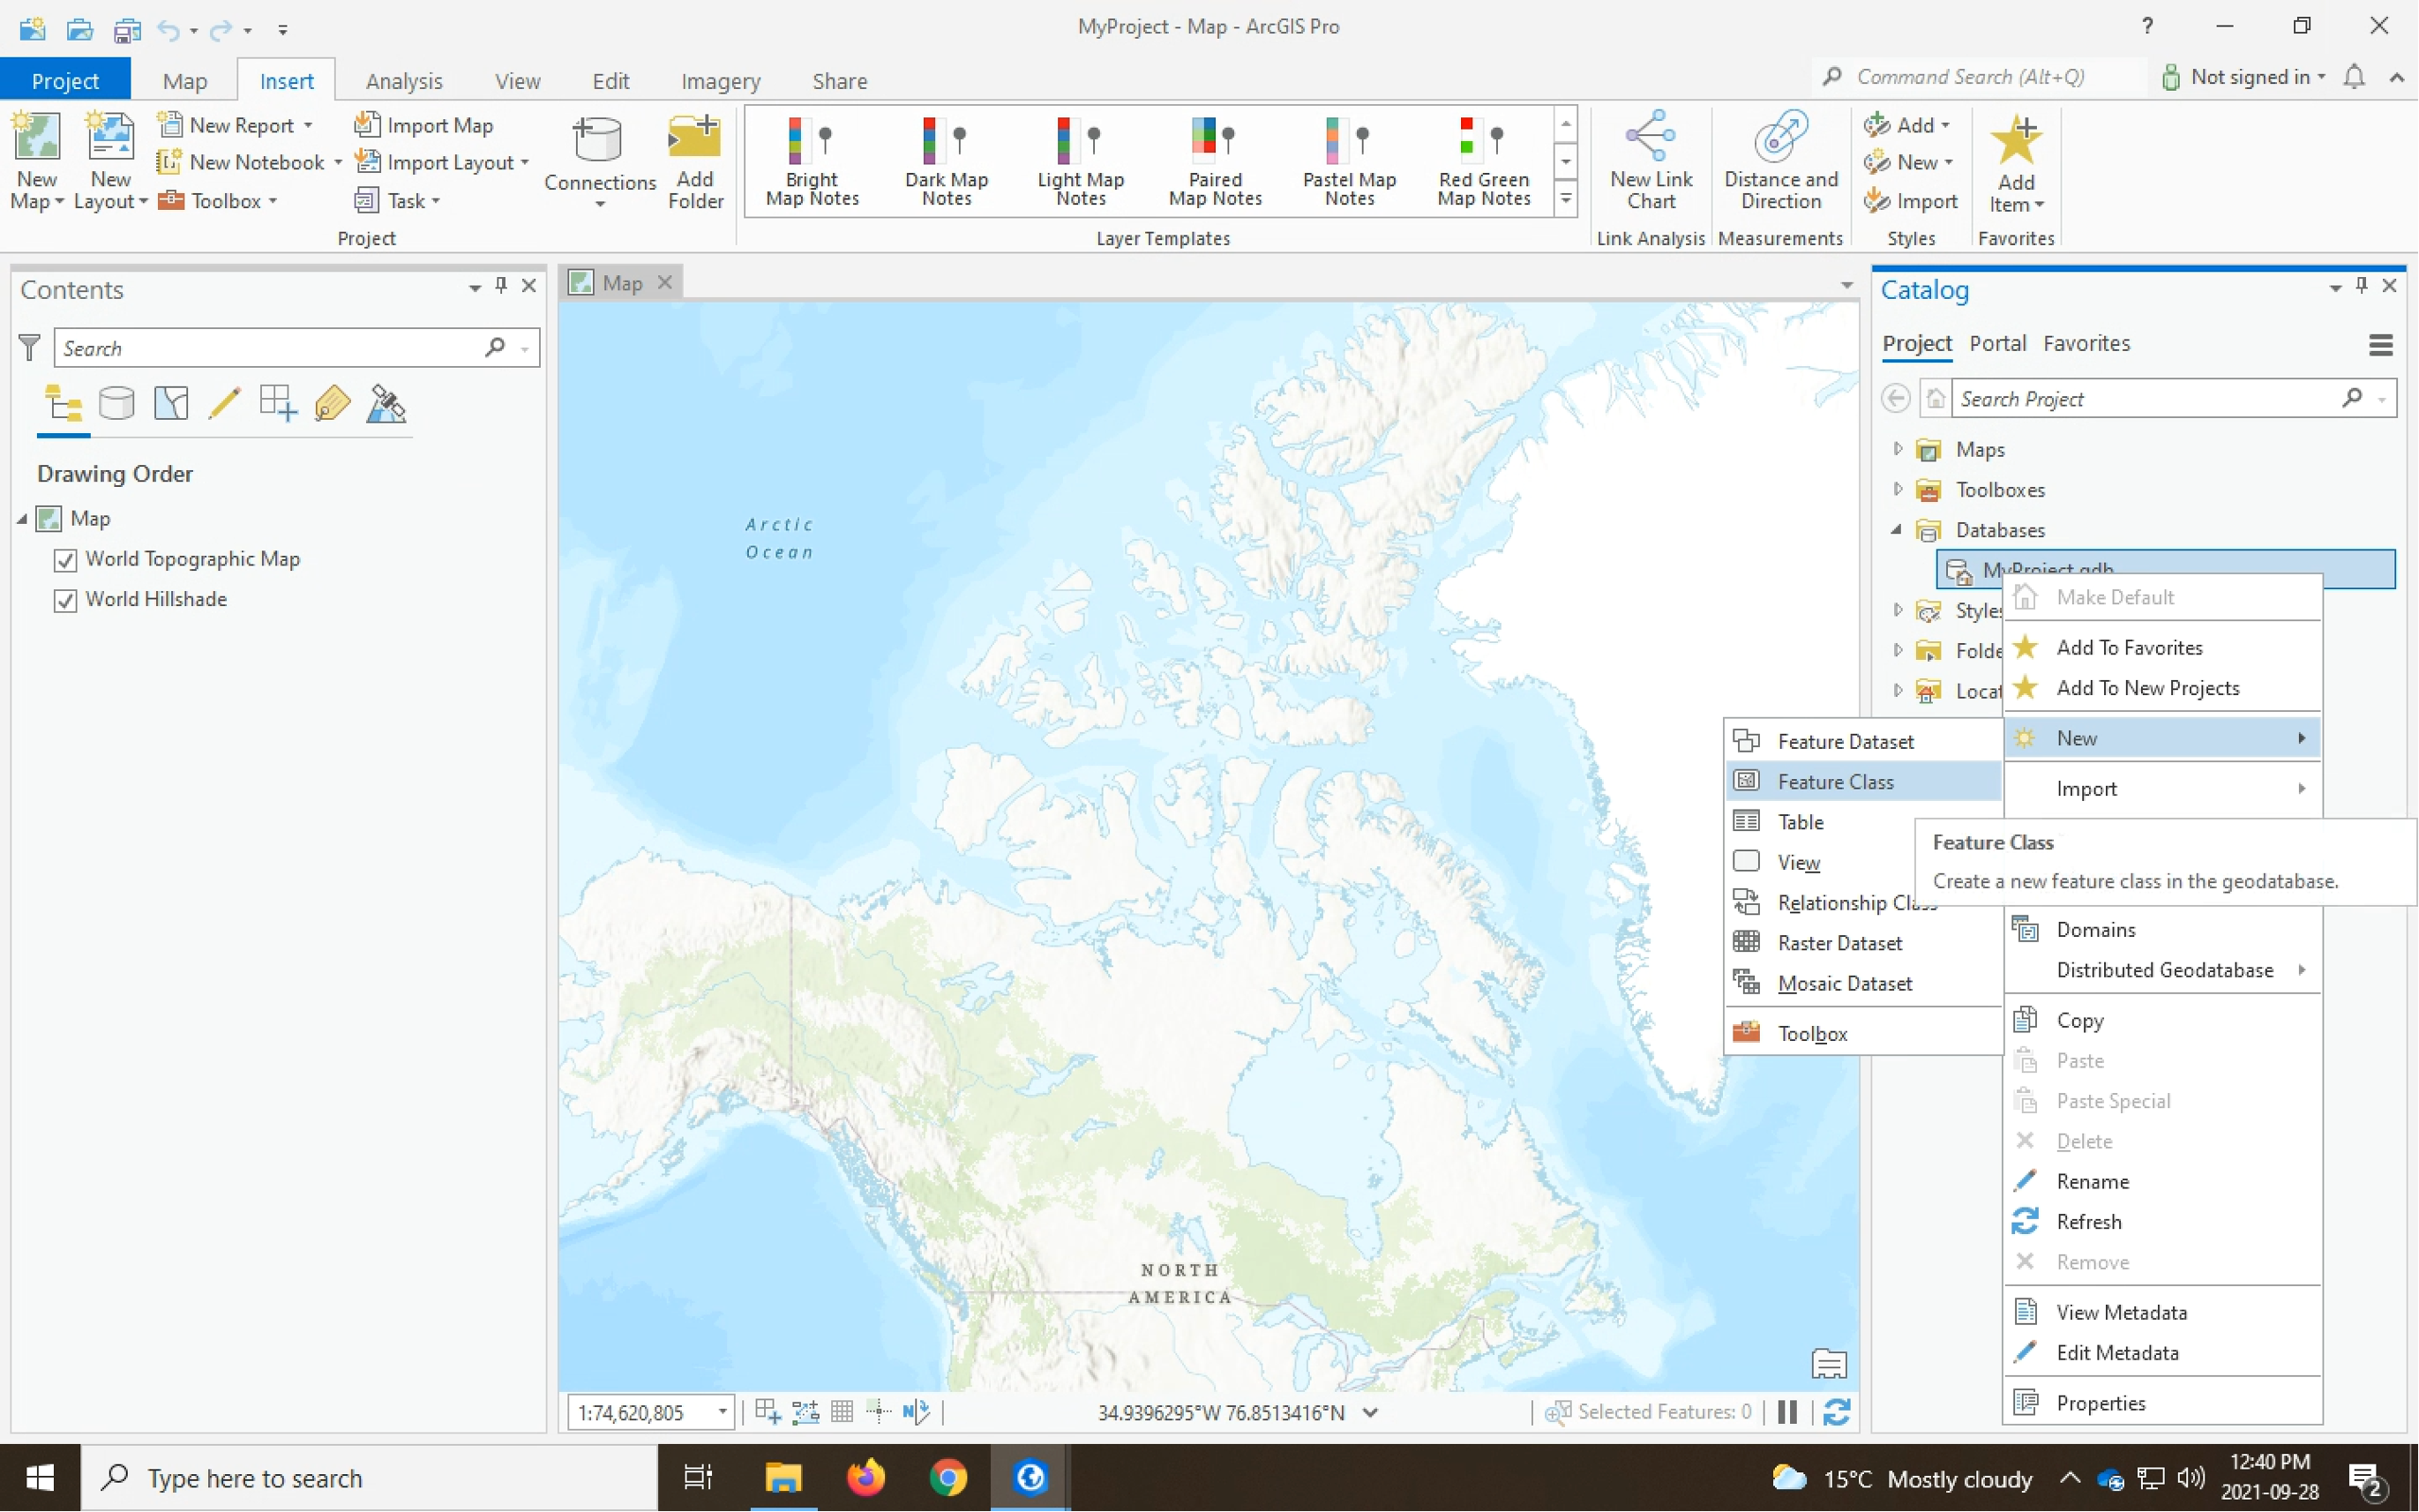
A separate point feature class was created for each of the nine different obstacle types (Figure 1). The base map was set to OpenStreetMap, and a shapefile with a boundary for the study area was added to the project. In this study, the study area will focus on different communities located in the City of Calgary, thus a shapefile with community boundaries was downloaded from Open Calgary and included in the project.
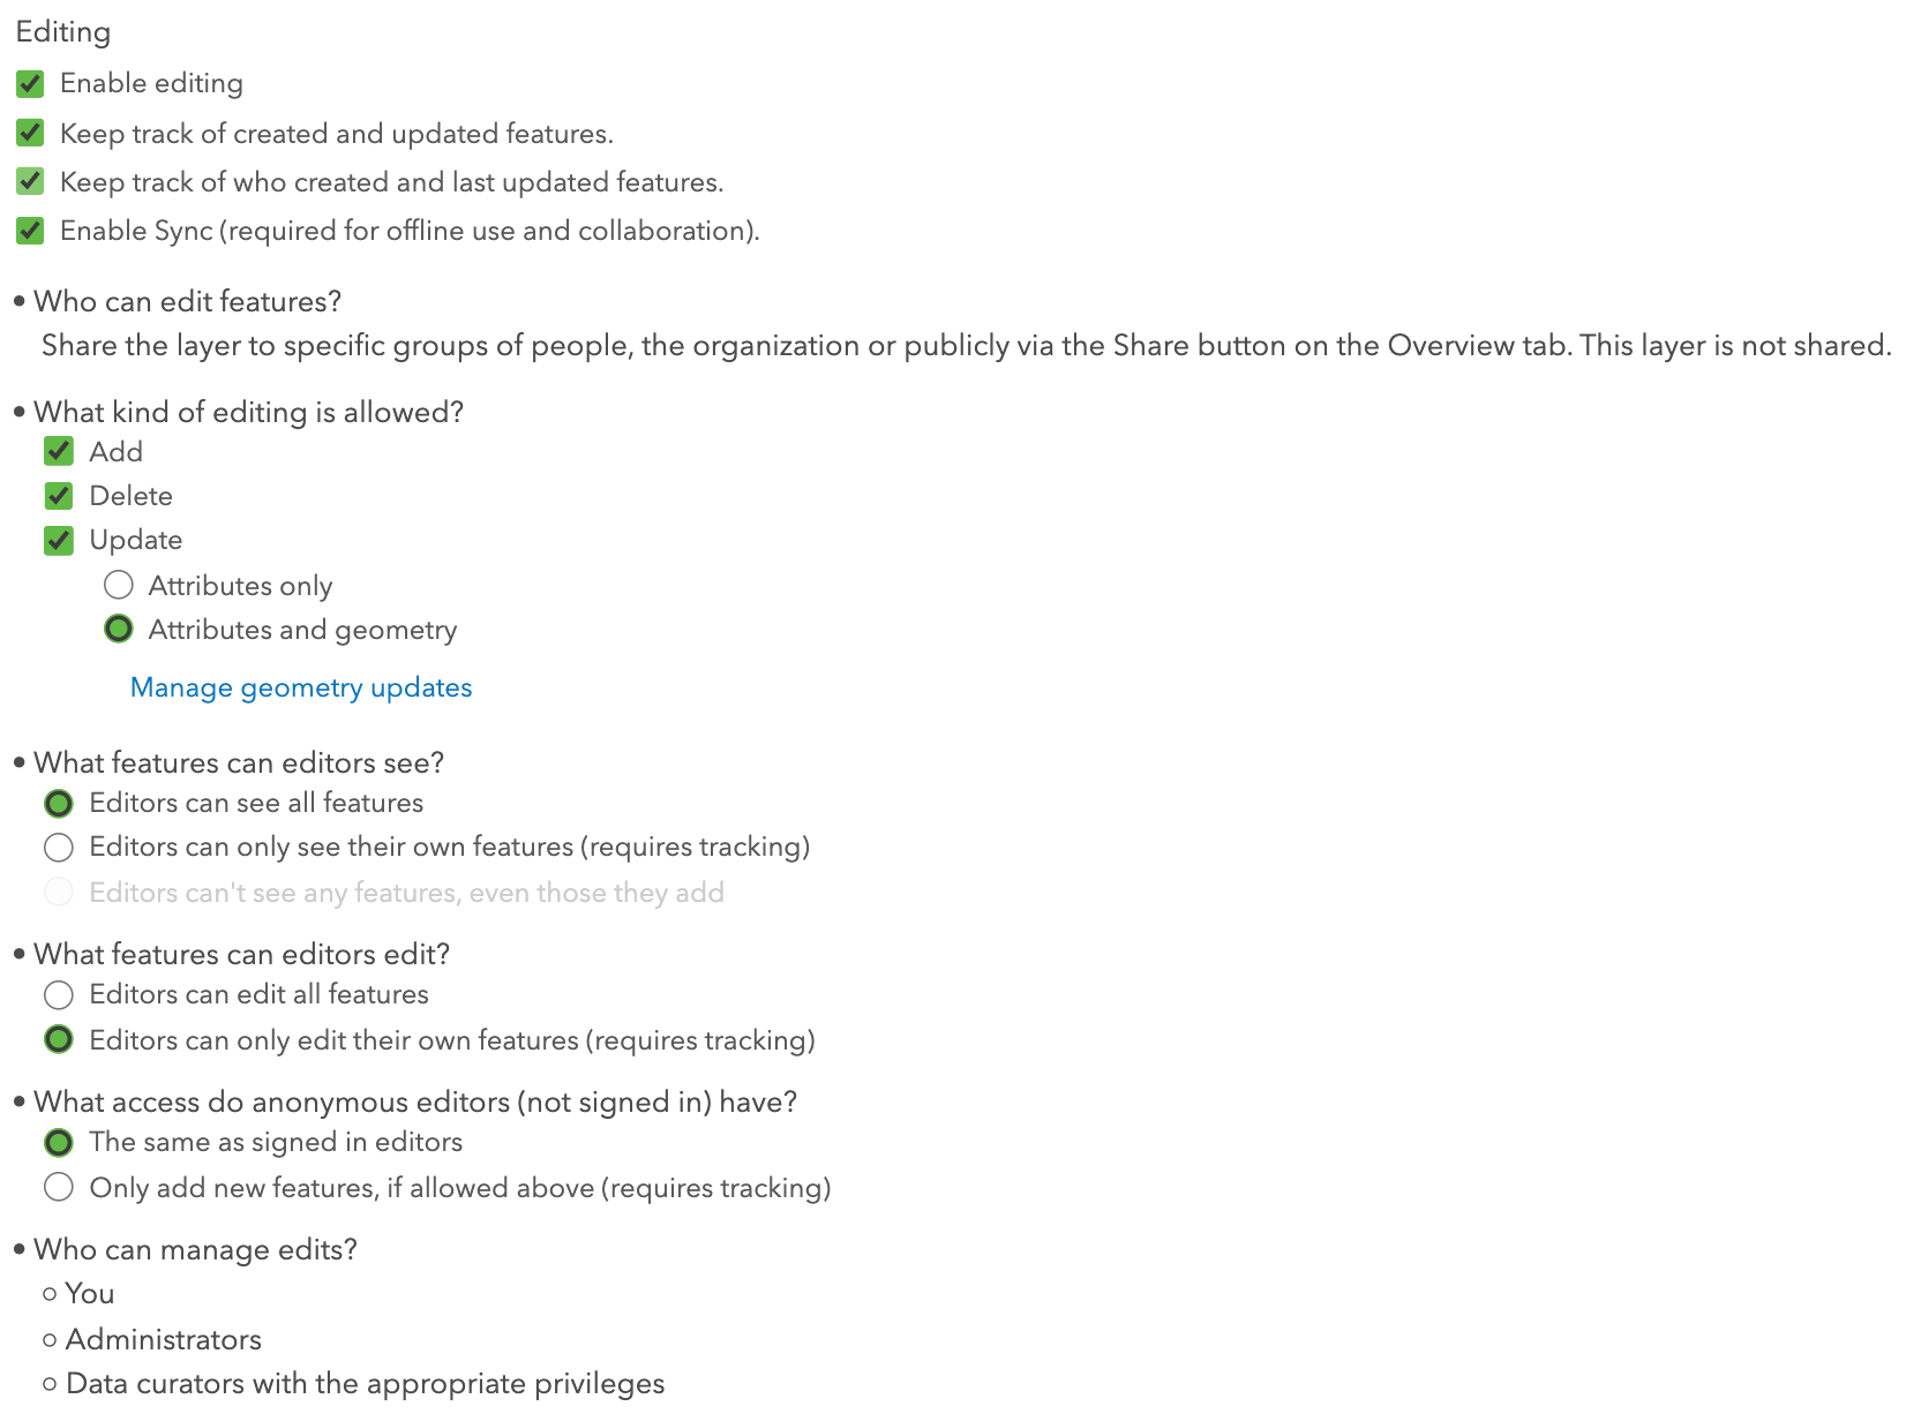
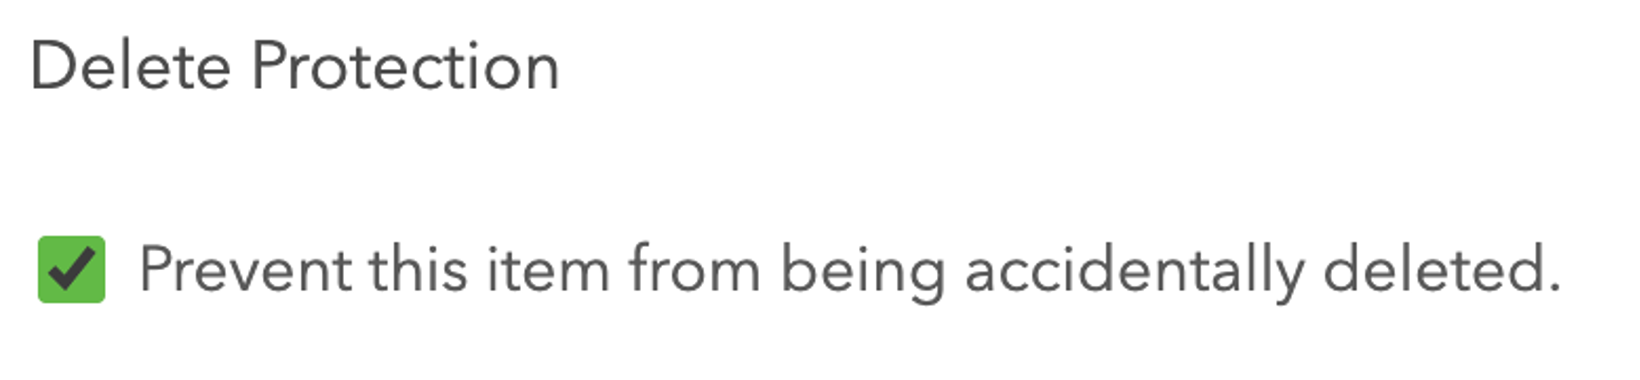
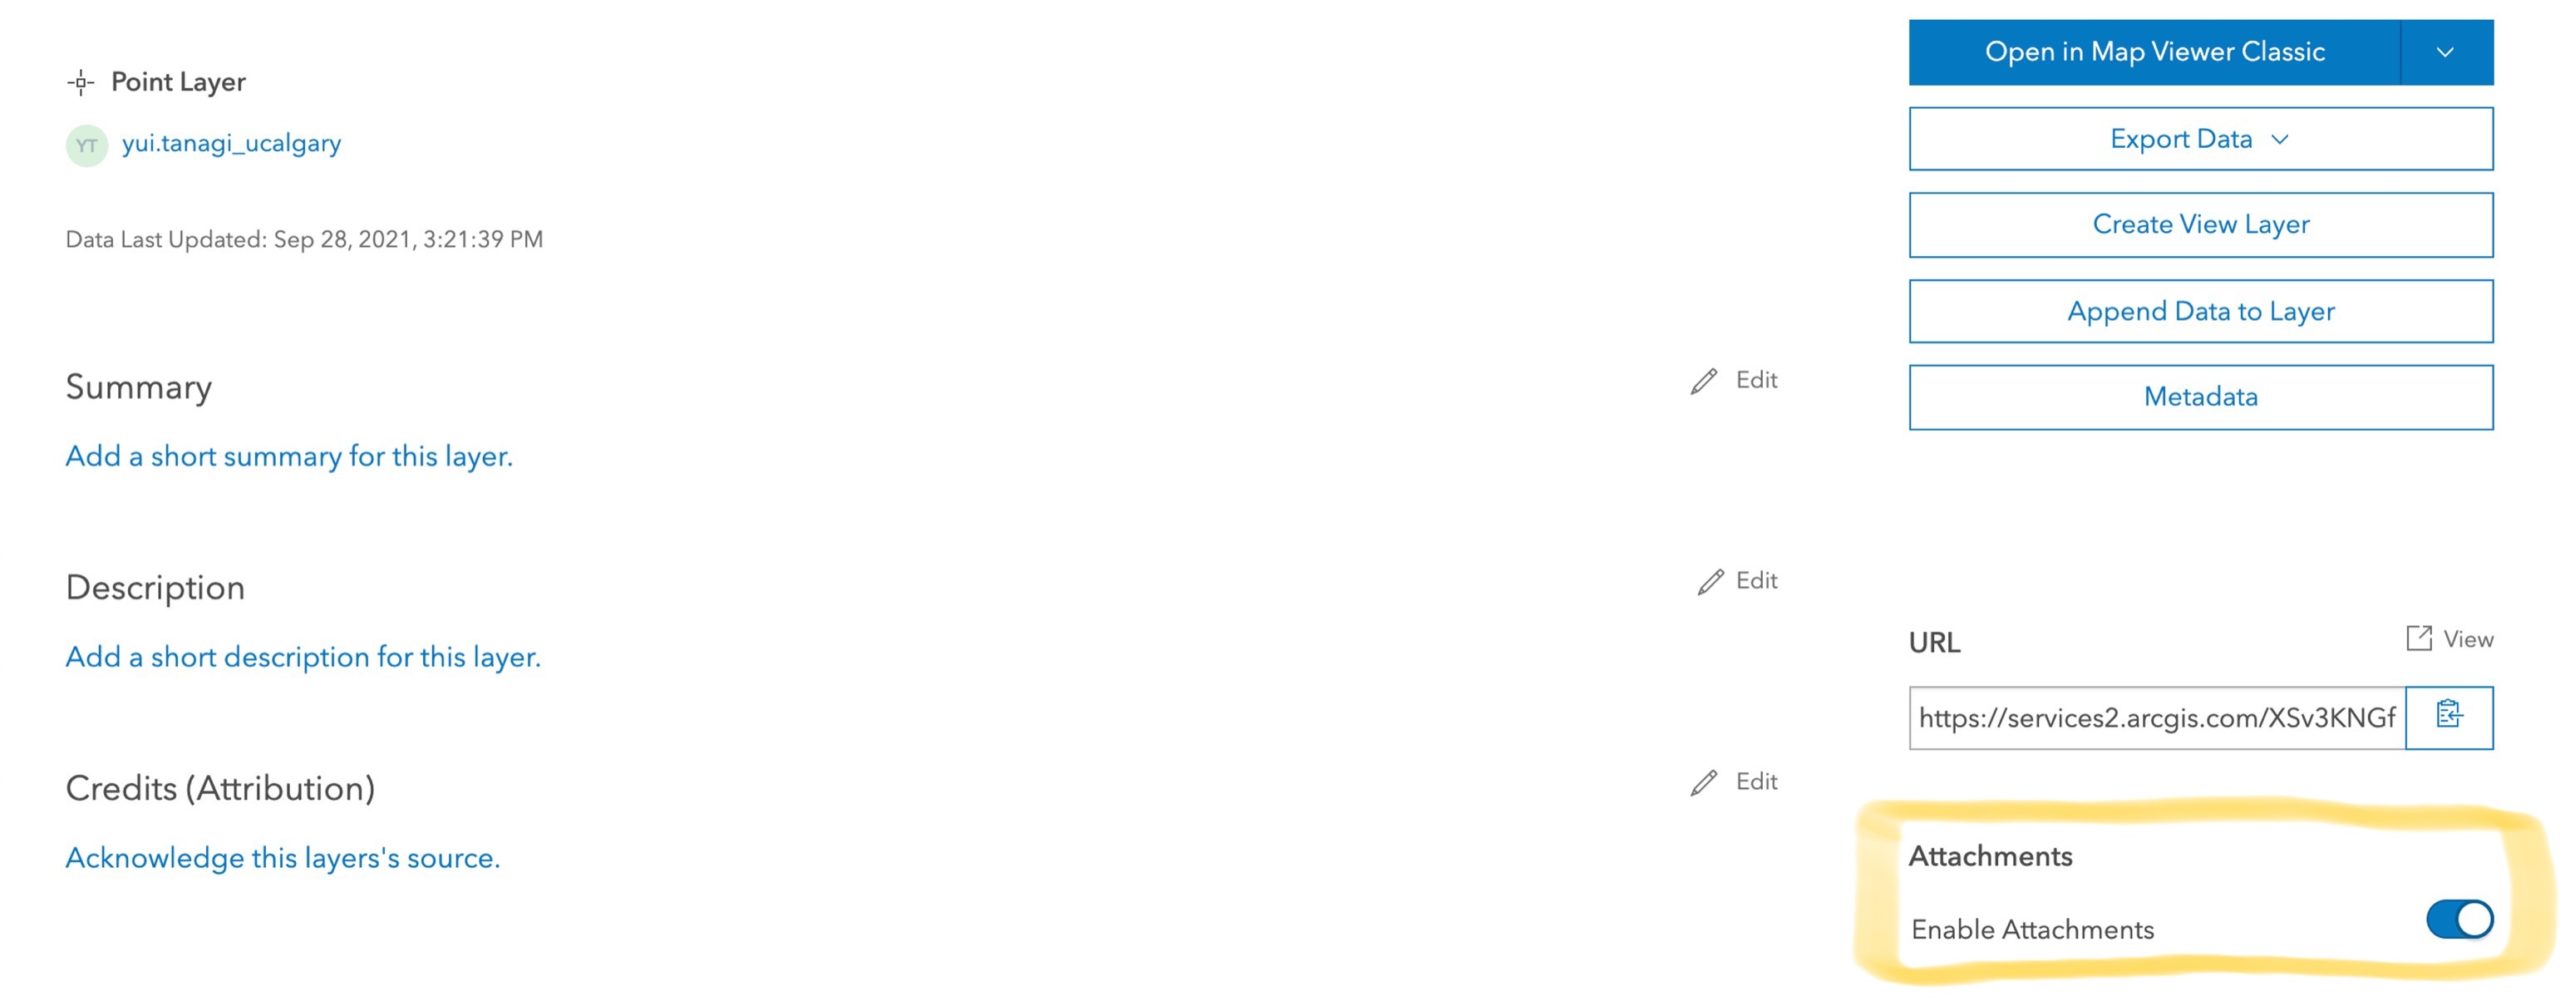
The next step was setting up the web map on ArcGIS Online. The geodatabase with the 9 different feature classes and the base map was published from a map in ArcGIS Pro to my ArcGIS online account as a web map. This included a feature layer that would store the 9 different types of obstacles. The feature layer was configured to allow anyone participating in the module was to edit features (Figure 2), and the delete protection option was enabled so that the feature layer won’t accidentally be deleted (Figure 3). Next, the attachments option was enabled to allow photos/files to be attached to points added to each feature layer (Figure 4). The delete protection option was also enabled for the web map that will be used during field data collection on Field Maps. The web map was shared with the module group created in ArcGIS Online.
The last step for setting up Field Maps was to download the Field Maps application on any phone or tablet that will be used during the field data collection step. Once Field Maps was downloaded, the participants were required to open the web map shared with them in the application.
Data Collection (Fieldwork)
The next part of my responsibility was to assist my supervisor, Dr. Fast, with instructing the students in the module and collecting obstacle data with them using Field Maps. For my role as an assistant module instructor, I was tasked to help students with recognizing different types of barriers in the built environment and how those obstacles would affect the accessibility of sidewalks for people with disabilities.
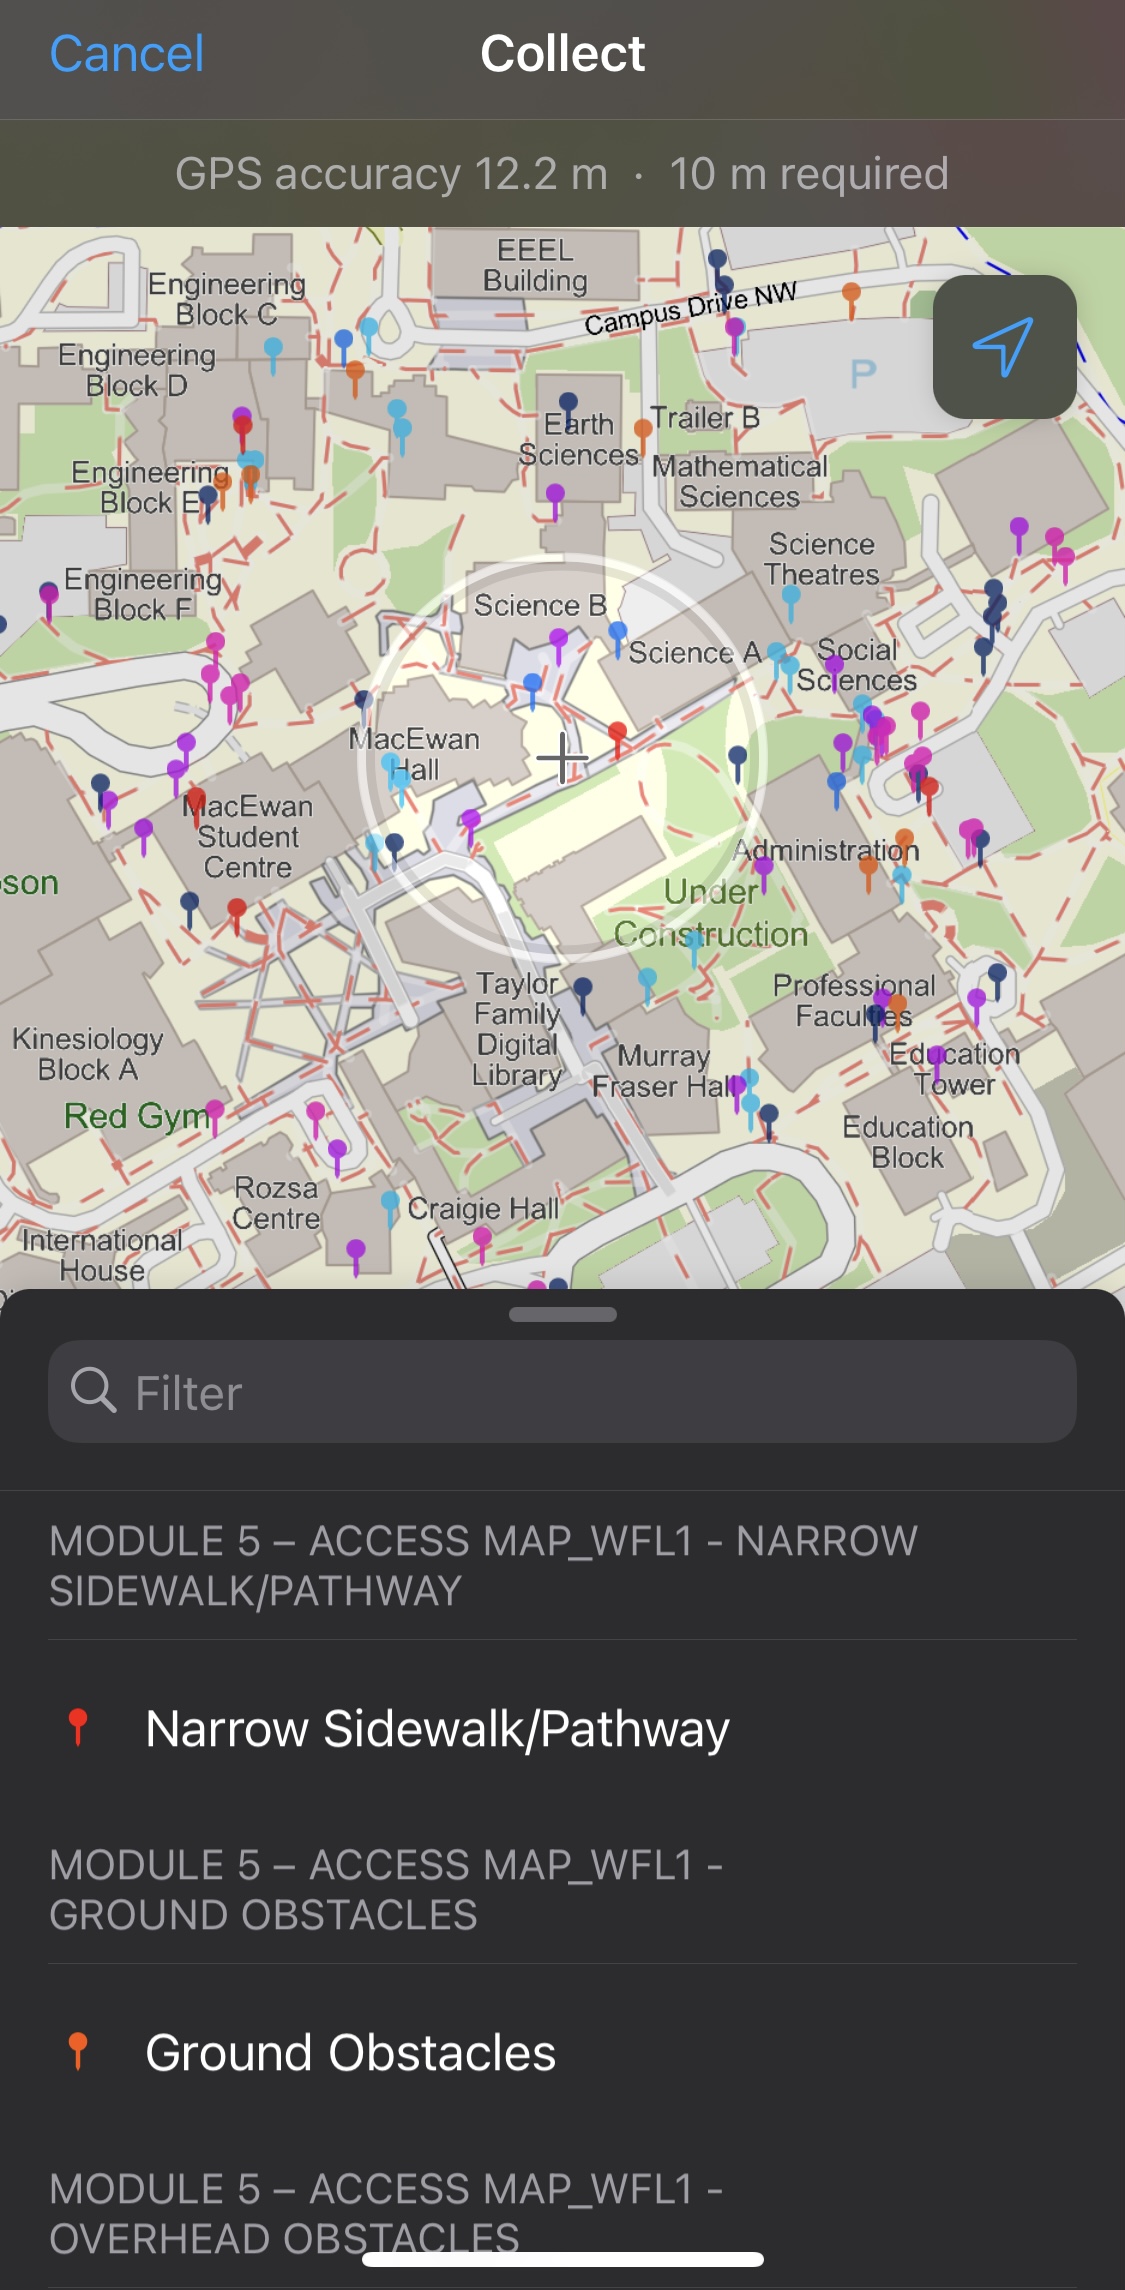
First, we walked around the University of Calgary main campus to familiarize the students with the different types of obstacles present on pedestrian pathways (sidewalks). Then each of the students was required to record any obstacles they found in their study area and record them using Field Maps as a new point in the correct point feature layer (Figure 5). Each of the nine layers will provide information regarding the location, type of obstacle and how it could be obstructing the pathway. For most observed obstacles, a picture was taken to capture the type of obstacle and help better explain how it could be affecting the accessibility of that sidewalk (Figure 6).

Overall Experience
I gained a lot of skills and knowledge from this opportunity, especially familiarizing myself with recognizing barriers in residential neighbourhoods, setting up Field Maps, and manual field data collection using Field Maps. Through my role as an assistant module instructor, I was able to help students become more accustomed to Field Maps by going around the study area while they were collecting data, which further helped me become very familiar with using Field Maps. It was also very interesting to hear students’ different opinions of what they considered an obstacle in the built environment.
I believe that these skills will help me in the future. I am thankful that I have some fieldwork experience under my belt due to this role. From this experience, I now understand the importance and hardship of conducting manual field data collection, and I now will be able to set up Field Maps with ease no matter the type of the project as I know my way around the platform.