
Mineralogical Analysis using Remote Sensing, Machine Learning, and ArcGIS Pro
Due to the global pandemic, scientists worldwide have had to find remote alternatives to their usual in-person research. This is no different for geologists, many of whom have not been able to access the field sites they would usually visit to collect data. Thus, many earth scientists have turned to remote sensing as an alternative method of investigating natural phenomena.
One field in particular that can benefit from the use of remotely sensed data is mineralogy. Whereas traditional mineralogical analysis requires the collection of samples which get turned into thin sections, and then require further analysis with a petrographic microscope, remotely sensed data can for the most part be acquired virtually, through databases such as GoogleEarthEngine and the USGS Earth Explorer.
This is where my research in the Structural Tectonics Lab at McMaster University has been focussed. Through both machine learning analysis of thin section scans, as well as the analysis of remotely sensed data, I have worked to gain insight on the mineralogy of various locations using virtual techniques. This work has included the implementation of programming scripts in languages such as R and Python, alongside the use of GIS software such as ArcGIS Pro. More specifically, on the programming side, the random forest machine learning algorithm was used to determine the mineralogy of the scanned thin sections. This required me to label specific identified pixels with their human-determined mineral identification, and it was executed using the randomForest package in R. Using this, the overall mineralogy of each slide was classified, though the results are not ready to be shared in this blog post.
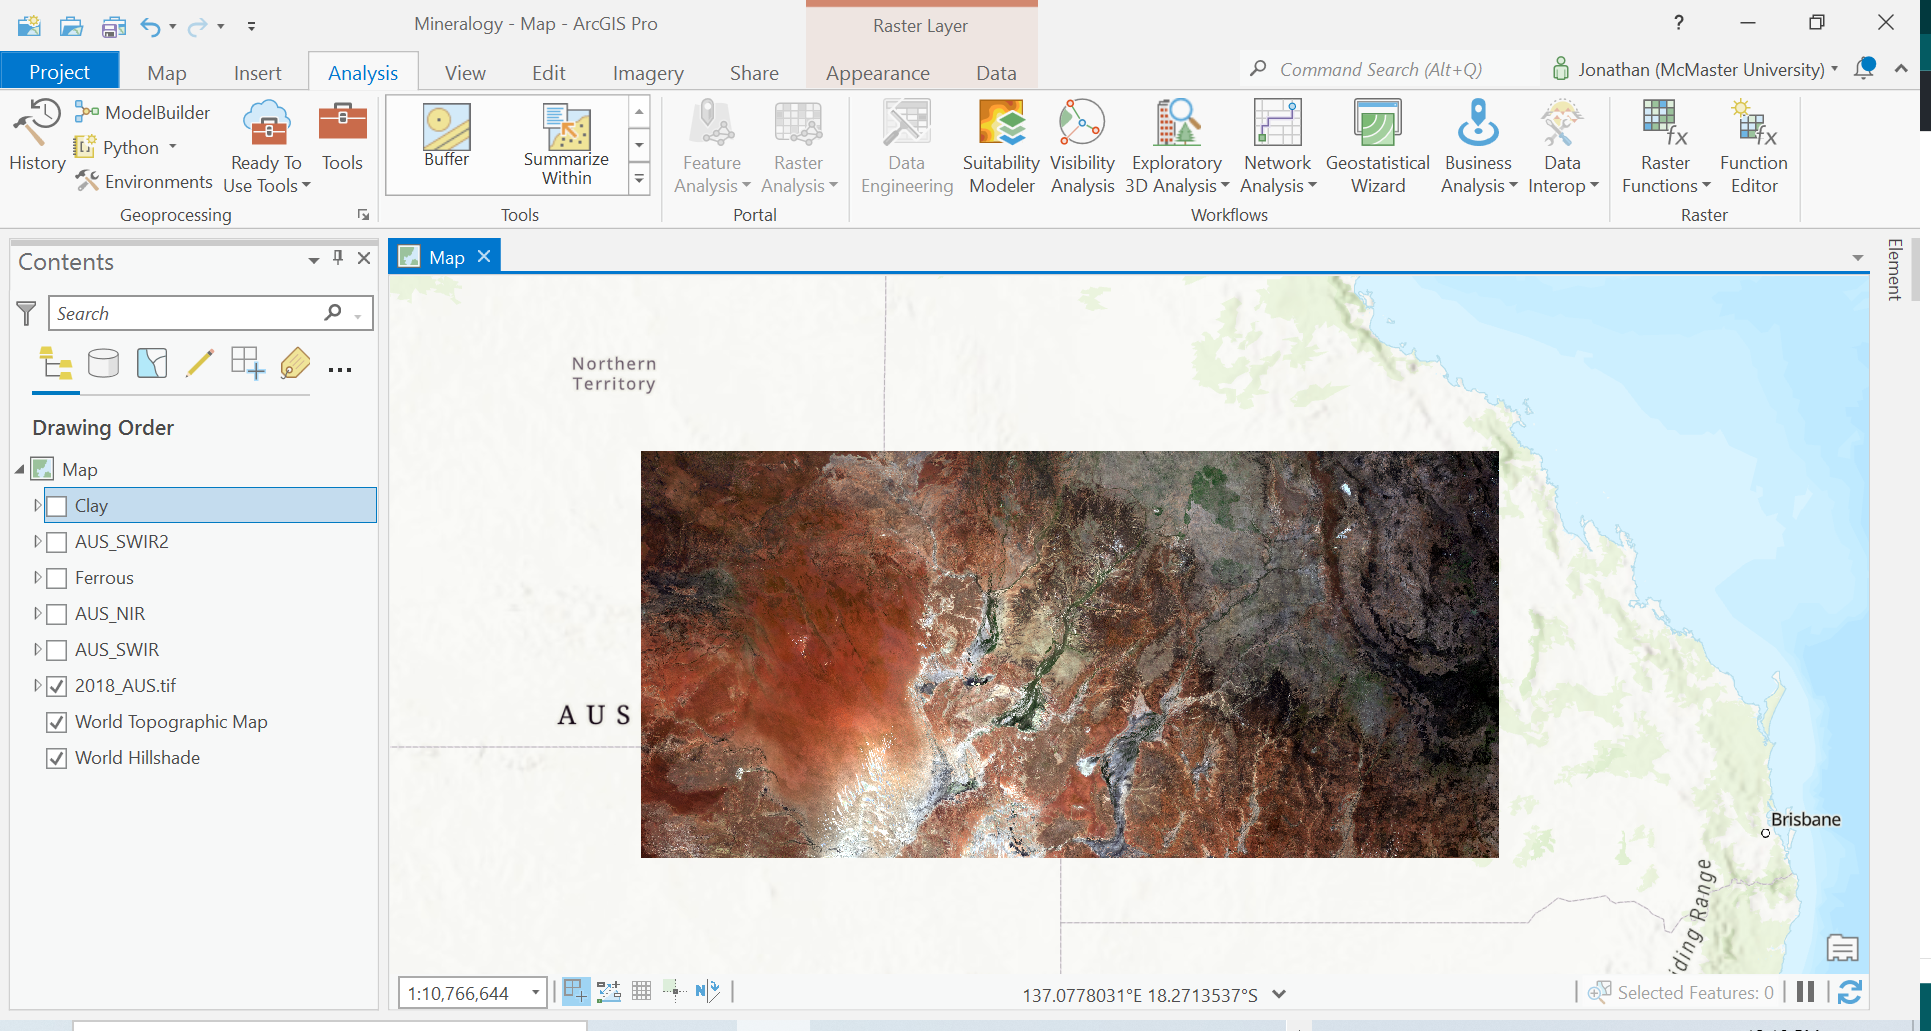
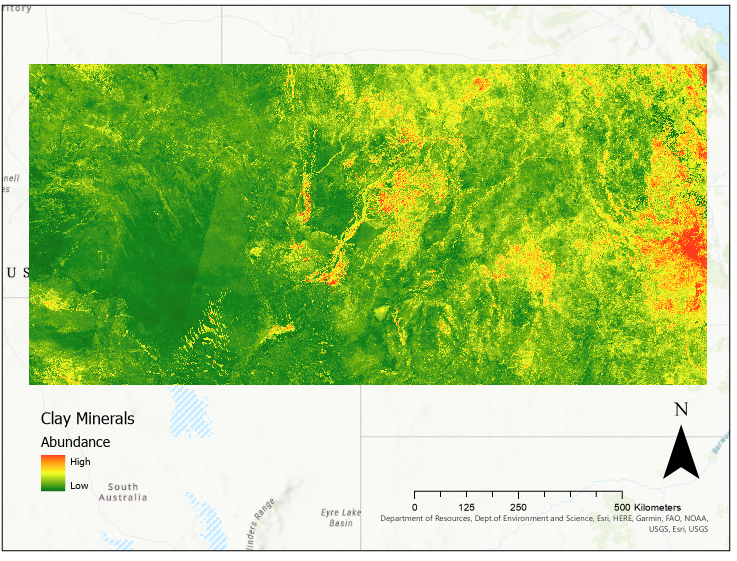
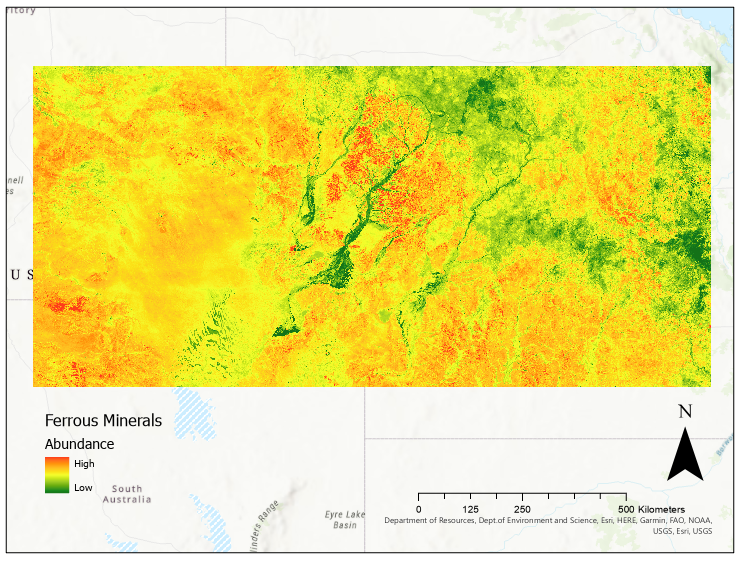
On the GIS side, however, I preformed all of my analysis in ArcGIS Pro. ArcGIS Pro provides an excellent platform to view and analyze remotely sensed data. The user interface is far more intuitive than any other remote sensing software packages, and the Spatial Analyst and Image Analyst tools allow for effective and efficient analysis of remotely sensed data. Additionally, tools like Raster Calculator are useful for computing various mineralogical indices (as seen in Figures 2 and 3). The specific indices used in this analysis were the clay mineral index and the ferrous mineral index, and these were calculated using Raster Calculator with the equations CM = SWIR 1/SWIR 2 and FM = SWIR 1/NIR. While these do not provide the same detail as thin section analysis, they can provide insight on mineral abundance and mineralogy dependent factors, such as nutrient availability, erosional potential, and potential resource distribution. Additionally, these analyses are much more cost-effective than other analyses, while also allowing for a much larger area of study.
In addition to providing a platform for the analysis of remotely sensed rasters, ArcGIS Pro provides many additional benefits. First, its built-in python environment allows for the efficient analysis of large datasets through iterated processes. Additionally, ArcGIS Pro provides access to the Living Atlas and ArcGIS Online databases, which can provide useful datasets that work in conjunction with downloaded remotely sensed data. On top of this, ArcGIS Pro provides many more tools that can be used to analyze factors related to your study topic, for example hydrologic flow.
Overall, while remote sensing and machine learning may never replace field and lab work fully, it is clear that they can serve as informative substitutes when in-person work is not an option. As such, I hope that I am able to continue my work in this field, as I finish my undergraduate degree and begin work on my master’s next year. Thank you for reading, and keep an eye out for updates as this project progresses.