
Flood Depth Mapping in Calgary, Alberta
I am currently in the second year of my M.Sc. degree at McMaster University, working with my supervisor, Dr. Darren Scott. Right now, I am in the middle of processing my data and have some preliminary results to share.
Extreme weather events, such as floods, can cause severe consequences to the road network, such as traffic congestion, trip cancellations and inaccessible destinations. Historically, some of the most disastrous floods in Canada have occurred in Calgary, due to the presence of the Bow and Elbow River, and smaller nearby waterbodies. The objective of my research is to measure the changes in accessibility to emergency services in the event of a 100-Year flood in Calgary, Alberta. These emergency services include fire, police and emergency medical services (EMS). The analysis will identify isolated populations and areas that are not within the targeted response times of emergency services.
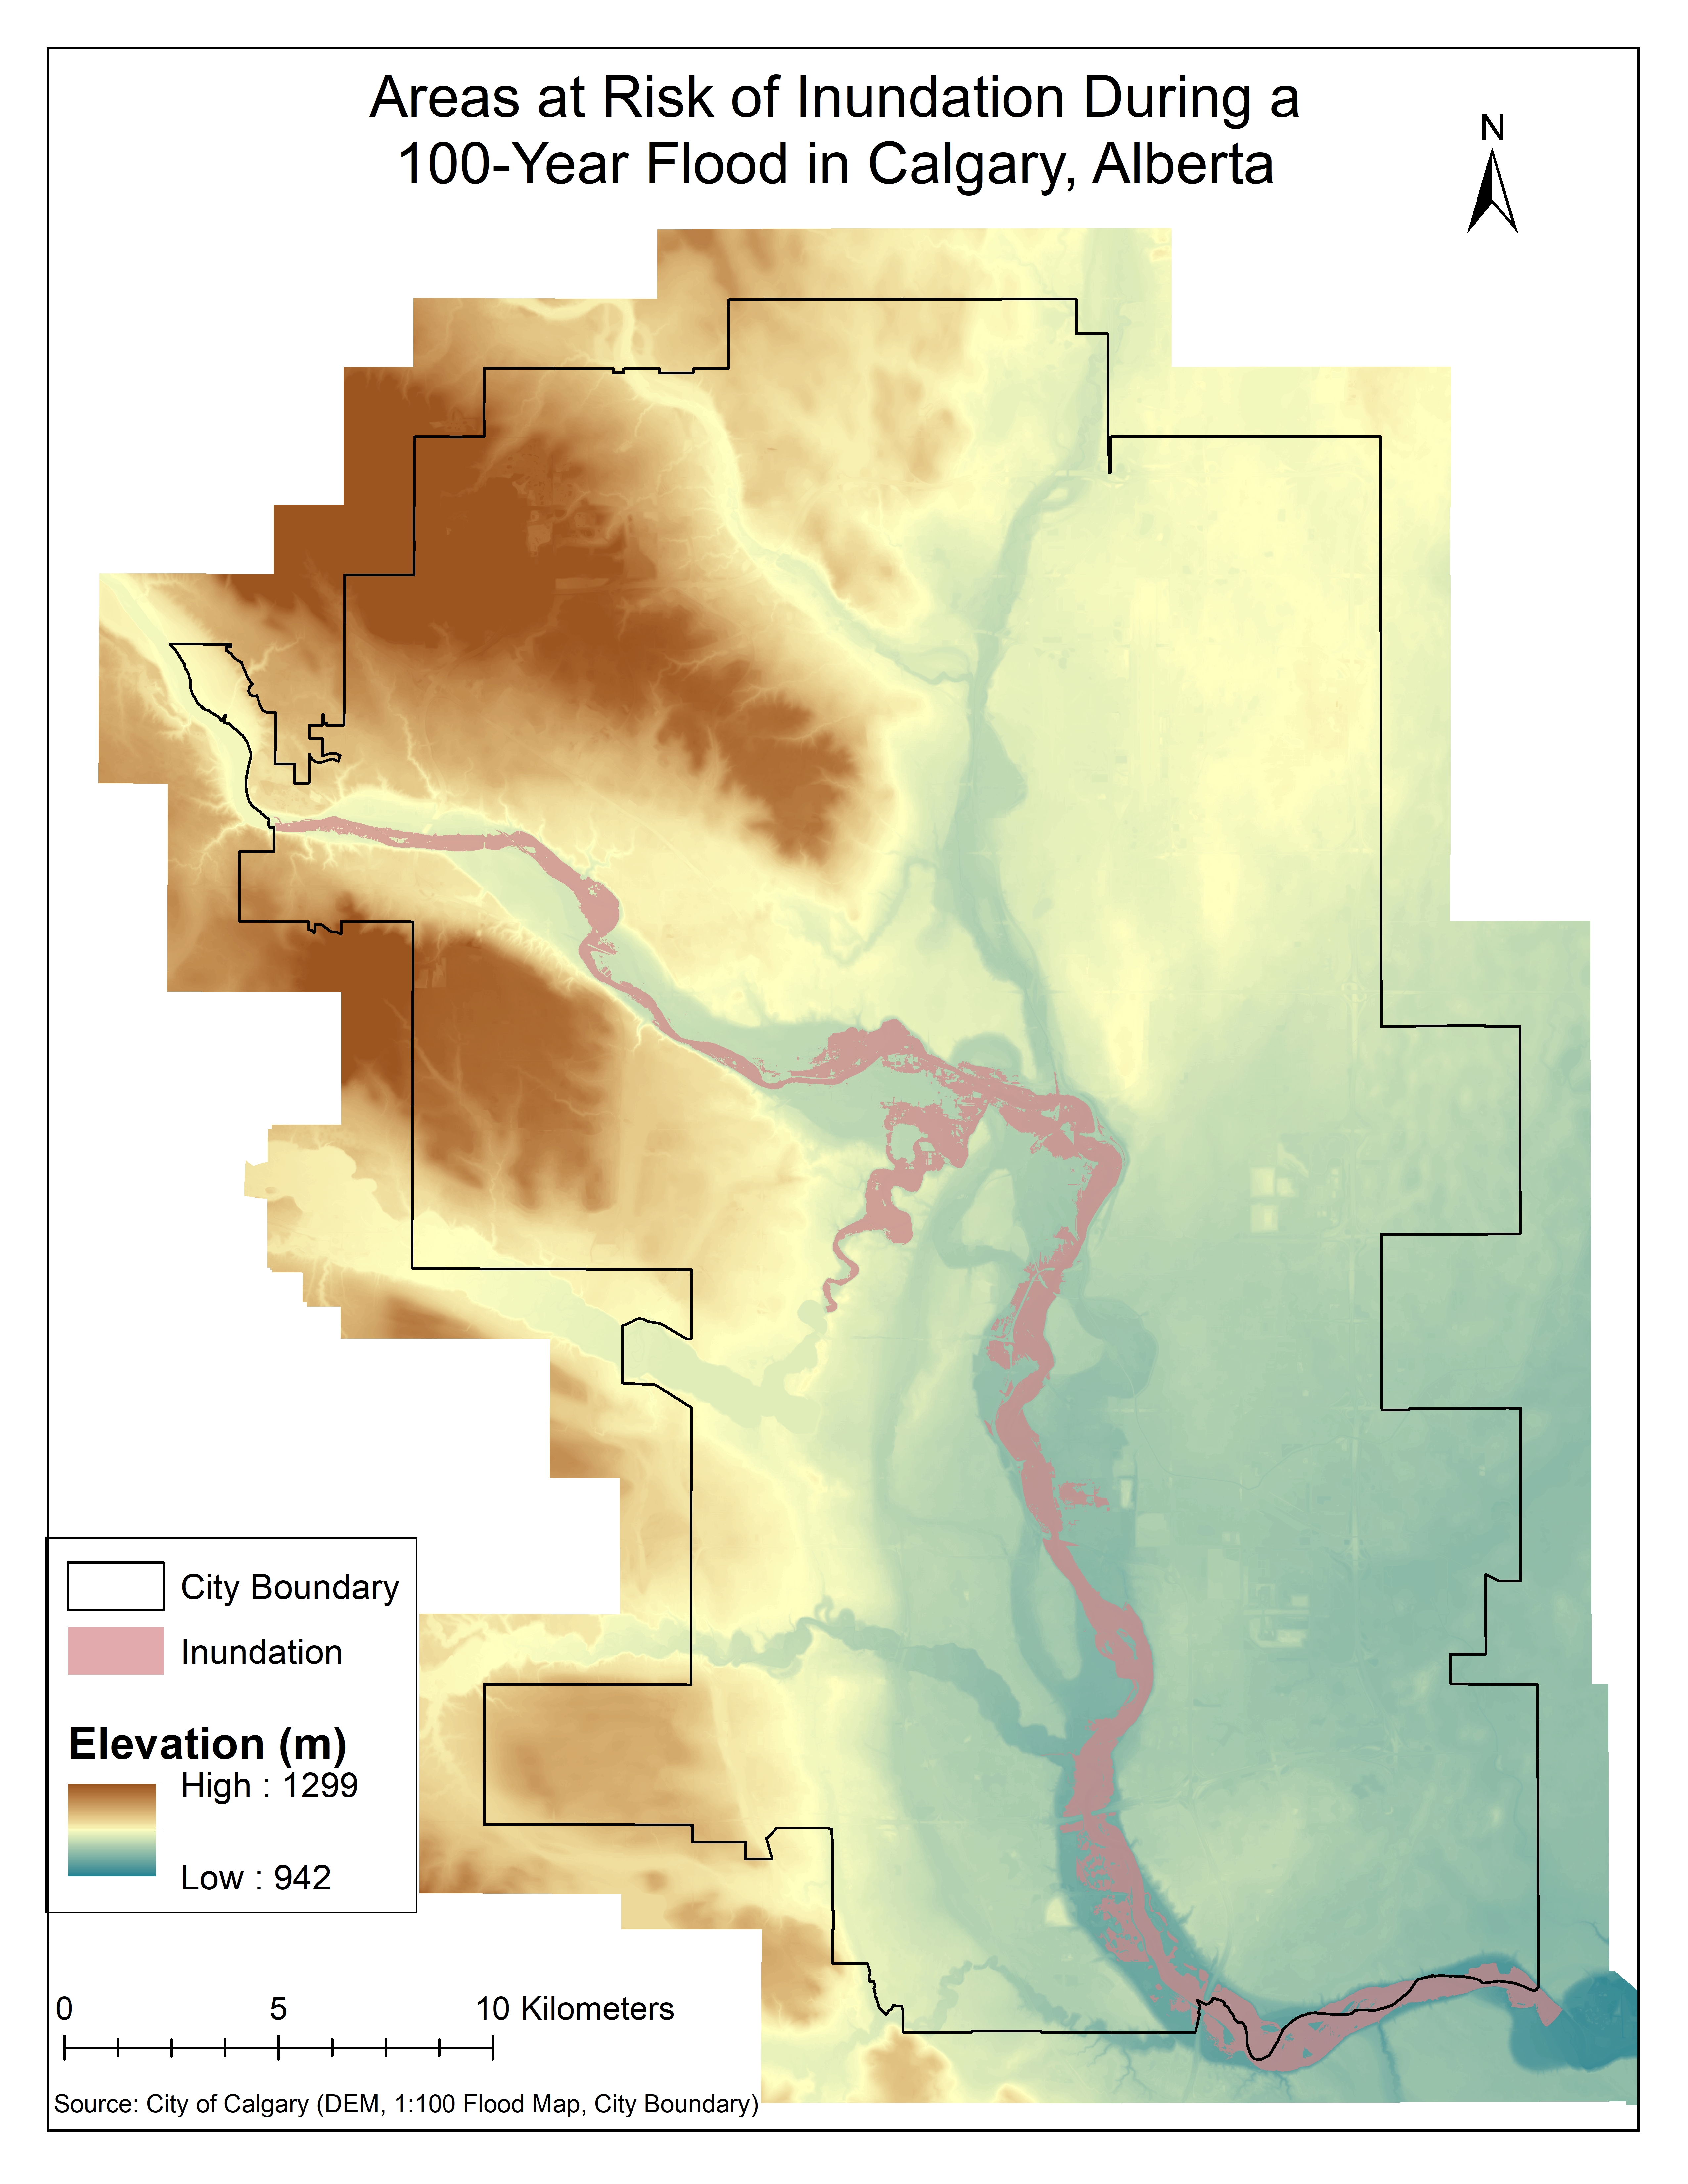
Areas at risk to flooding were identified using a 100-Year flood inundation shapefile from the Calgary Open Data Catalogue. The flooded areas reflect the topographic and hydraulic conditions of 2015. The size of the flood shown has a 1% chance of occurring in any year. The inundation shapefile was processed along with a 1-meter DEM of Calgary, provided by the City of Calgary, to determine the depth of inundation during a 100-Year flood. The data and study area can be seen in Figure 1.
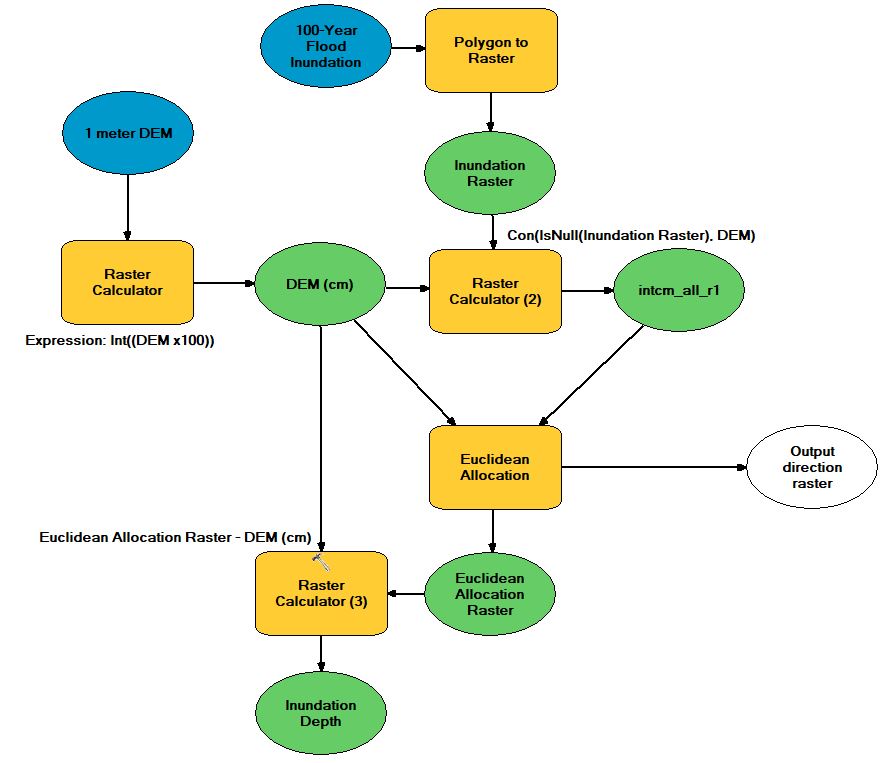
To determine the depth of inundation, the 1-meter DEM was first was converted to integer format and centimeter units as the latter used Euclidean Allocation tool outputs integer values. The DEM was converted from meters to centimeters to maintain as much precision as possible. Cells that intersect the extent of the 100-Year Flood inundation shapefile were removed from the DEM. The resulting DEM reassigns cells that overlay the inundation extent to NoData. It is also important to note that we assume all cells outside of the inundation extent are considered non-flooded and have a flood depth of 0. The Euclidean Allocation tool was then used to identify the elevation of the closest non-flooded cell to each 100-Year flood inundation cell, which is currently NoData. When the closest cell is identified, the inundation cell will be reassigned that value. Now, each 100-Year flood inundation cell has the value of the closest, non-flooded cell. This value represents the current elevation of the flood. To determine the depth of the flood, the DEM in cm and integer format was subtracted from the Euclidean Allocation raster. All cells outside of the inundation extent will have an output value of 0 as these values have not changed from the original DEM and the Euclidean Allocation raster. The steps in determining inundation depth were carried out in ArcMap, with the tools used seen in Figure 2. Figure 3 shows the resulting flood depth in downtown Calgary, with many links of the road network within the inundation extent. Values greater than 150 centimeters were grouped together as they represent waterbodies.
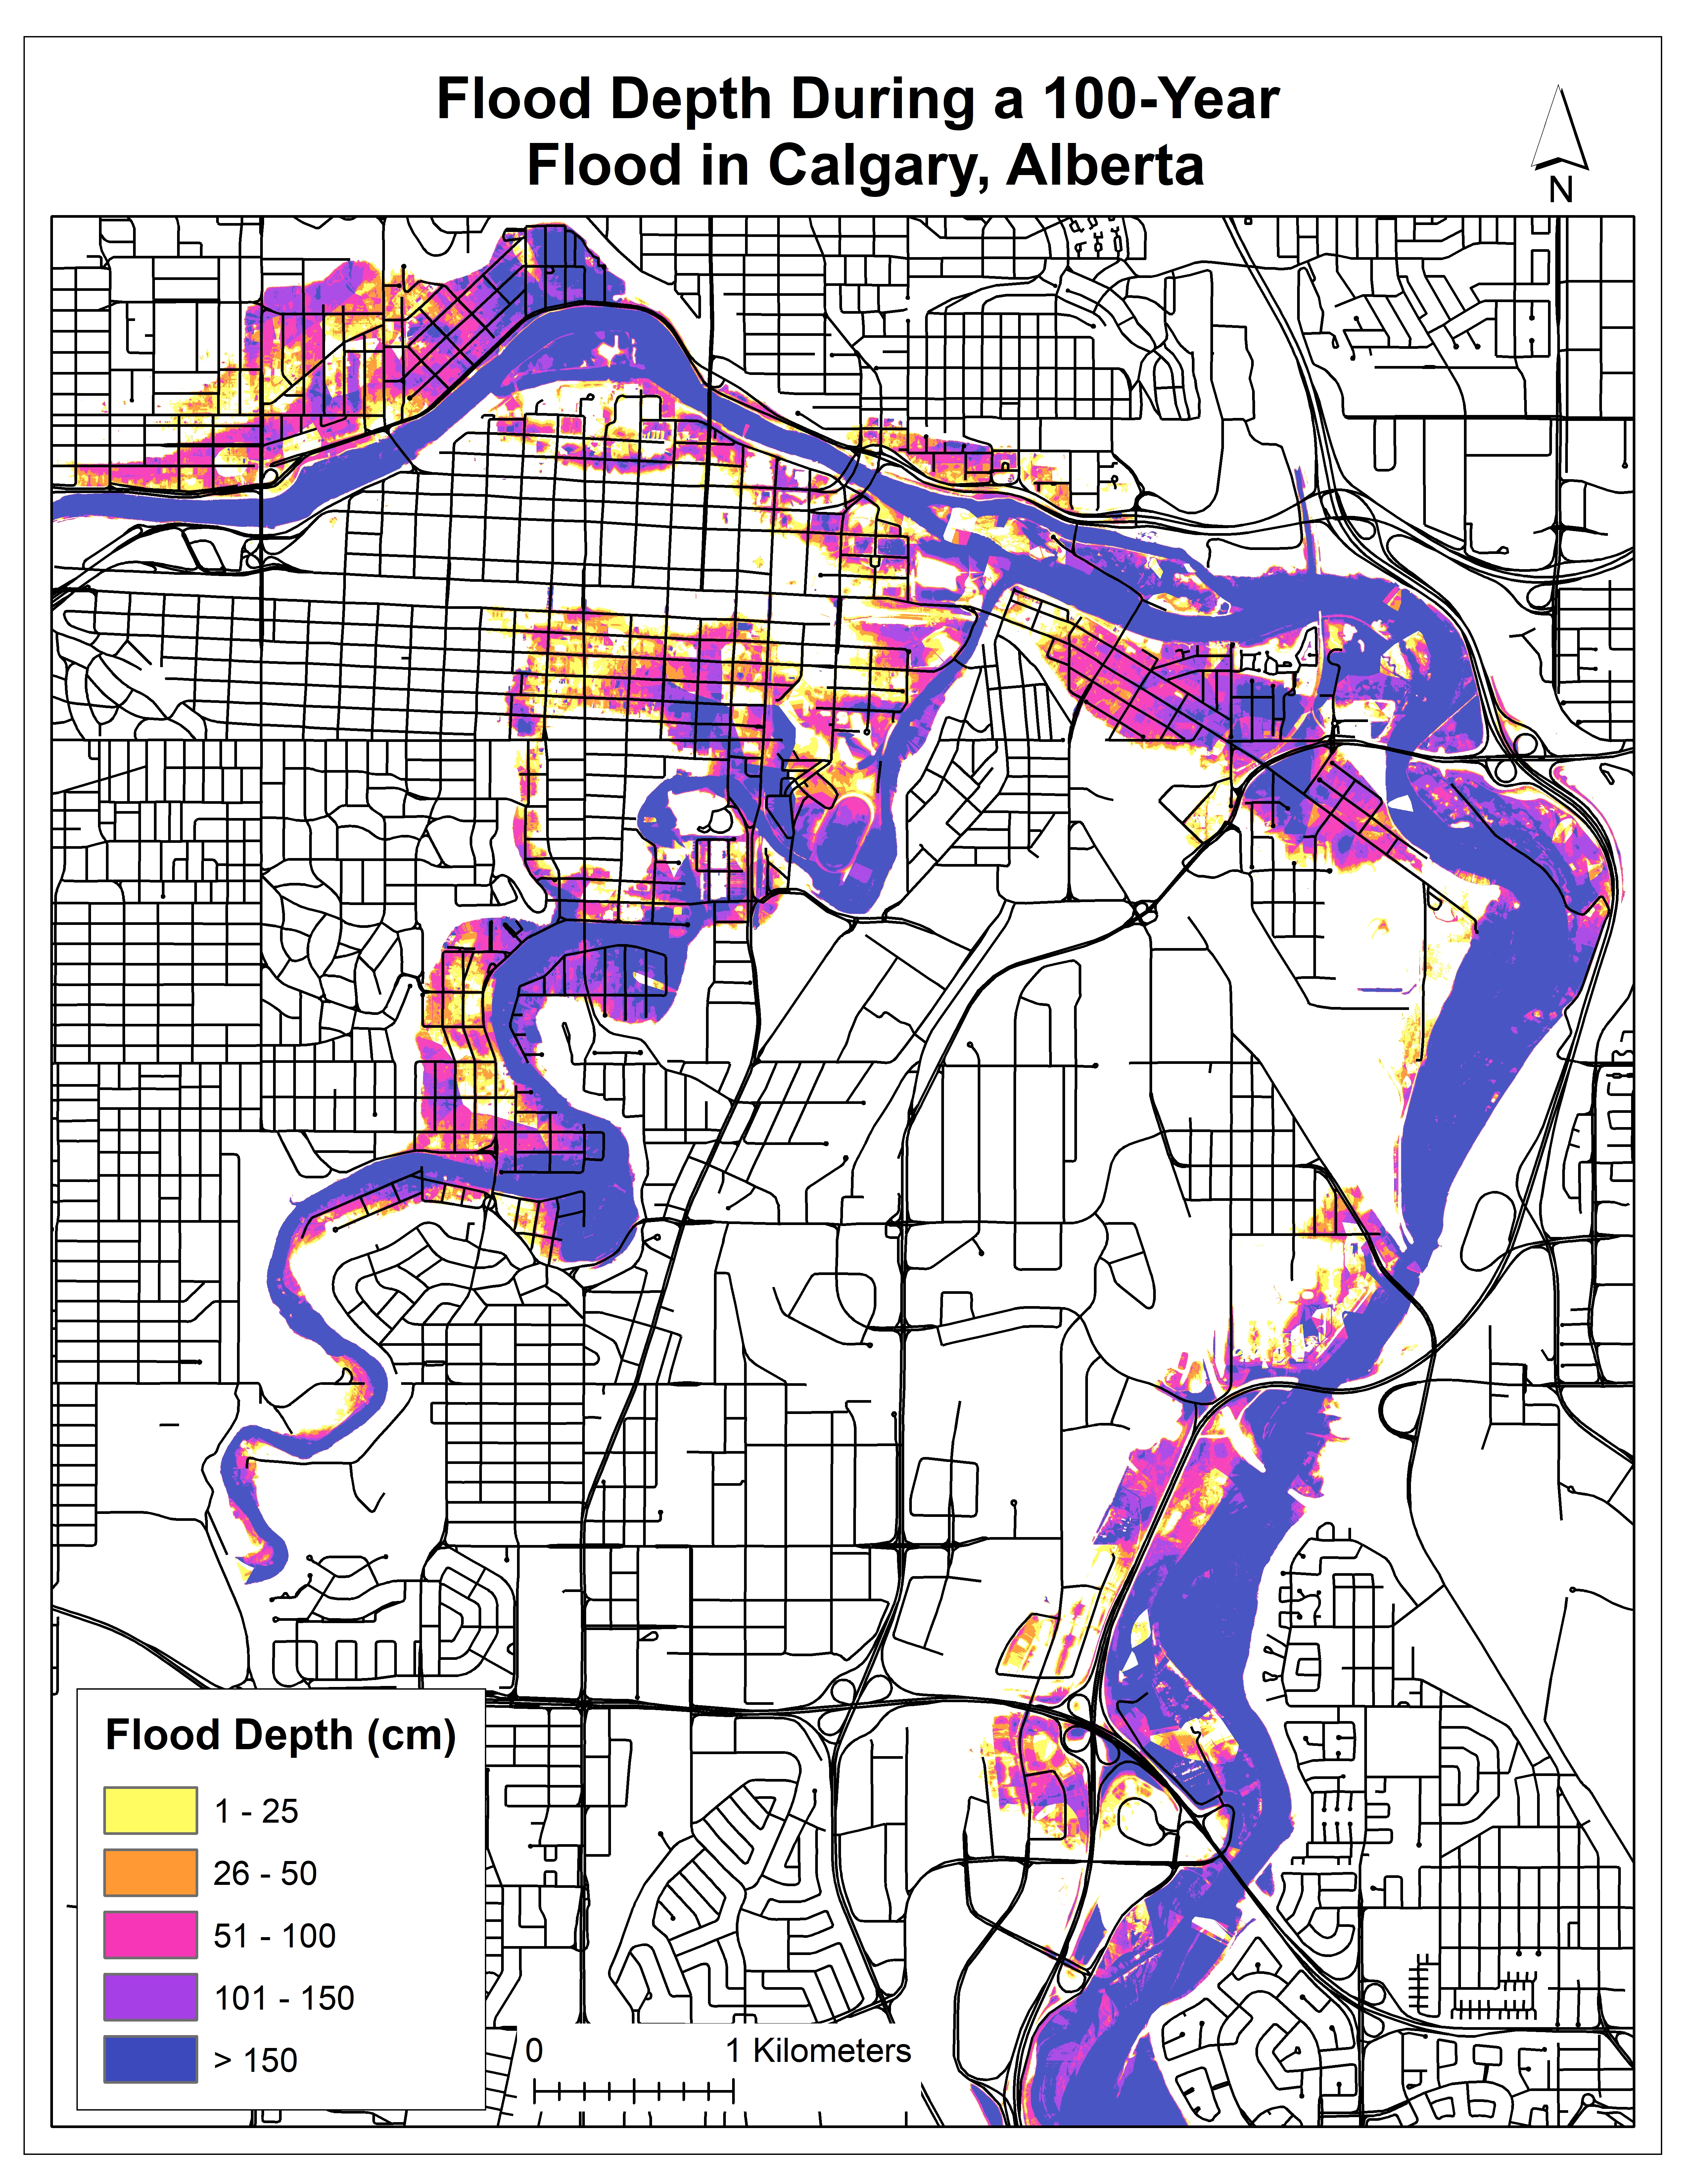
Pregnolato et al. (2017) determined the maximum depth of standing water a car can drive through safely without losing control to be 30 centimeters. Links in the road network that overlay depths greater than or equal to 30 cm will be considered non-traversable. Links that overlay flood depths less than 30 centimeters will have new travels times associated with them based on the relationship between the depth of water and vehicle speed, quantified by Pregnolato et al. (2017). Identifying the flood depth allows changes in accessibility to be estimated and inaccessible areas to be located, which is the next step of my research. I will follow up with another blog post once the work is complete!
References
Pregnolato, M., Ford, A., Wilkinson, S., & Dawson, R. (2017). The impact of flooding on road transport: A depth-disruption function. Transportation Research Part D: Transport And Environment, 55, 67-81.