
The future of public health is spatial
Demand for geospatial research has increased exponentially over the past decade (Casper et al., 2019). In the past two years alone, the global pandemic has heightened the importance of “place” with a deeper awareness of how the built environment can hinder or support public health by influencing individual behaviours and population-wide distribution of disease. One of the most pertinent applications of GIScience and GISystems during the COVID pandemic has been the use of location analytics to monitor disease outbreaks; record incidence of cases, deaths, and demographics; and track the spread of disease across countries. As leaders of GIS data-driven applications, Esri Canada has expanded into public health sectors and invested in building capacity for informing public health research and solutions for complex health issues using a geographic approach. Esri Canada has focused on areas of public health that include enhancing decision support, such as emergency preparedness, resource allocation to expose gaps in community personnel or supplies, and public engagement through tools like storytelling with maps to visualize and disseminate spatial data. Specifically, Esri’s ArcGIS Dashboards application has enhanced the way epidemiological data can be communicated to support COVID-19 decision-making and shared publicly to improve civic awareness of public health warnings.
The growing demand for spatial analytics within public health raises two important questions: 1) What insights can be gained from health geography theory to strengthen knowledge of public health? and 2) How can geospatial applications be strengthened to enhance public health strategies? This blog discusses some of the theoretical contributions of health geography that provide important insights to improve public health interventions, and how this information can be used to strengthen Esri Canada applications for data collection. I will draw upon my doctoral research experience using geo-ethnography methods and ArcGIS Field Maps to improve a public health intervention for prevention of heart disease.
What Insights Can Be Gained from Health Geography Theory?
The dominant way of thinking about geospatial data has typically involved quantifying directly observable locations, space-time activity paths, or patterns of population health such as disease (Miller & Goodchild, 2015). Yet, there are many more ways to understand space, time, and “place” such as characteristics of built environments, interactions individuals have within their environment, and contextual factors that influence individual activities (Cummins et al., 2007; Mennis, Mason, & Cao, 2013). The field of health geography provides important insights by emphasizing that health is influenced by interconnections between social, economic, and physical environments and individual activities across time and space (Curtis & Jones, 1998; McLaren & Hawe, 2005; Tunstall, Shaw, & Dorling, 2004). Applying a more comprehensive understanding towards geospatial information requires quantitative data to be supplemented with qualitative contexts such as perceptions, experiences, and social interactions that explain not only where, but how and why health phenomena occur across time and place.
There are three well-known mixed-method GIS approaches that contribute novel research techniques to strengthen health geography theory including 1) geo-ethnography, 2) grounded visualization, and 3) geo-narrative. Geo-ethnography is one mixed-methods approach used to gather locational information of day-to-day activities and is supplemented with open-ended interview questions to contextualize details like what, where, when, why, and with whom activities occur (Mathews et al., 2005; Milton et al., 2015). Original research from Matthews and colleagues (2005) integrated GIS methods with ethnography to compare the health and welfare of low-income families and their children in different environments around the world by identifying quantitative patterns in geographic activities and the contextual significance of these behaviours. Geo-ethnography methods have since been applied to explore how older people interact with and define their neighborhood (Milton et al., 2015), as well as how food insecurity affects low-income urban and rural women by exploring spatial patterns and decision-making processes behind food shopping behaviours (MacNell, 2018). Secondly, grounded visualization methods have been applied to explore how ethnic, social identities, and social structures were influenced by a community garden within a neighborhood with high crime and housing vacancies in Buffalo, New York (Knigge & Cope, 2006). Knigge and Cope (2006) aimed to understand how community planning, housing, demographic, and neighbourhood boundaries influence how people form attachments to place. Lastly, geo-narrative methods have been used as a technique to explore contextual details of an individual’s daily activities through activity diaries to explore the experiences of Muslim women in Ohio after the 9/11 terrorist attacks (Kwan & Ding, 2008). This study used daily activity diary surveys to generate 3D life paths of daily activities for Muslim women and linked contextual factors of how transportation, access and use of public space, and perceptions of safety and risk within the urban environment influenced their space-time activity (Kwan & Ding, 2008). These mixed method approaches emphasize the importance of supplementing spatial-temporal data with information about social phenomena and environmental contexts that influence how individuals make decisions about their day-to-day health behaviours.
These examples also illustrate how spatially informed research questions and mixed-method techniques could strengthen knowledge of when and where public health interventions can be used to address complex health issues that connect people, time, and place. For example, within Halifax, Nova Scotia, a recent public health intervention was designed to improve availability and access to safe hygiene resources for people experiencing homelessness. New mobile showers were made available outside downtown Halifax, however, these showers remained unused during the entire month they were open. Through public engagement with people experiencing homelessness, an advocacy organization identified that the showers were not in an accessible location and that information about the public showers was not shared in advance with people experiencing homelessness.
How would this public health intervention change if geo-ethnography techniques were used as a tool to engage with people experiencing homelessness to identify where resources such as public showers would be most accessible based on how people travel and where they spend most of their time during the day? The use of a digital map could potentially be an effective tool for engaging individuals in conversations and recalling detailed accounts of their day-to-day activities. In the case of people experiencing homelessness, a digital map could inform questions such as, can you show me on the map where you typically go day-to-day, how do you typically travel to these places, where do you typically sleep, where do you eat, where do you shower? There are key insights to be gained from geo-ethnography techniques, such as using mixed-method strategies for identifying where, how, and why individuals interact within community environments and how public health strategies can be strengthened by designing interventions that align with the needs of targeted populations.
Integrating ArcGIS Field Maps Within a Mixed-Methods Research Study
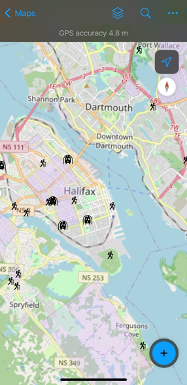
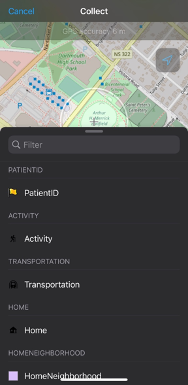
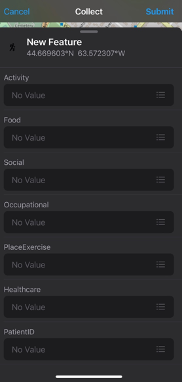
ArcGIS Field Maps is an application that provides a digital mapping platform to collect and report on locational data. Field Maps (Figure 1.0) is a mobile application that uses a web map to streamline the process of collecting data in the field. An advantage of using Field Maps is the ability to customize layers for data collection, as illustrated in Figure 1.1. Within each layer, there are fields that can be customized to define features, such as the type of data or characteristics of the observation being collected at one location (Figure 1.2). In the previous year, the functionality of Field Maps has expanded to allow users to capture both categorical or quantitative data (i.e., text or numeric) and qualitative data through open text, photo records, and audio files.
My experience using Field Maps was in 2021 when I created a customized interface to aid in data collection with patients for my doctoral research. Specifically, my research is focused on strengthening the design of public health intervention programs using geo-spatial methods and behavioural insights for upstream prevention of chronic disease. My research involves using geo-ethnography techniques to investigate patient day-to-day patterns of behaviour, with in-depth interviews to identify strategies that can be incorporated into interventions to nudge behaviour change outside of clinical settings. Figures 1.0, 1.1, and 1.2 are direct screenshots of the customized interface I created using ArcGIS Online. To uphold patient confidentiality 29 separate map interfaces were created using unique patient IDs so that every patient could map their day-to-day behaviours and visualize their routine activity space. I used the Field Map application during interviews with patients to capture data on where they live, work, and the types of activities they engaged in day-to-day. Using this interface, patients were able to identify where they live on the map, draw a boundary they consider to be their neighborhood, and point to the places they go, why they engage in a certain activity, how they get there, and who they are with. While I was able to customize the layers and fields within the Field Maps application, at the time I was unable to capture important contextual information such as patient perceptions of their neighborhood that influenced the types of activities they engaged in, or situational factors that influenced whether they used nearby resources like recreation facilities, trails, or parks. Since my experience using Field Maps for data collection in 2021 the functionality and capability of Field Maps has been expanded and qualitative data can be captured.
In my experience, Field Maps provides a foundation for collecting spatial data however, supplementary interviews were essential for gathering in-depth information about spatial contexts. Contextual factors that influence why patients behave the way they do and how decisions are made are critical for improving public health interventions, such as identifying the most opportune time and place to intervene. Theory from health geography provides important insights about the types of data required to strengthen the application of geospatial applications like Field Maps, and how results could be implemented within public health interventions. For instance, population-wide census surveys like the Canadian Community Health Survey could be strengthened by integrating geospatial tools from Field Maps to collect detailed information on individual health behaviours, such as places where individuals are frequently active, or characteristics of environments that support or prevent physical activity. Instead of answering closed-ended survey questions, participants could engage in data collection using a digital map with open fields to record details of their activities and community contexts that influence their behaviours. Expanding the capabilities of data collection tools from predominately quantitative to mixed method techniques provides opportunities to generate knowledge of key contextual factors that influence how people interact within their environment and types of information that are critical for decision-making and planning for public health programs.
References
Casper, M., Kramer, M. R., Peacock, J. M., & Vaughan, A. S. (2019). Population Health, Place, and Space: Spatial Perspectives in Chronic Disease Research and Practice. Preventing Chronic Disease, 16. https://doi.org/10.5888/pcd16.190237
Cummins, S., Curtis, S., Diez-Roux, A. V., & Macintyre, S. (2007). Understanding and representing ‘place’ in health research: A relational approach. Social Science & Medicine, 65(9), 1825–1838. https://doi.org/10.1016/j.socscimed.2007.05.036
Curtis, S., & Jones, I. R. (1998). Is There a Place for Geography in the Analysis of Health Inequality? Sociology of Health & Illness, 20(5), 645–672. https://doi.org/10.1111/1467-9566.00123
McLaren, L., & Hawe, P. (2005). Ecological perspectives in health research. Journal Epidemiological Community Health, 59(1). 6-14. doi:10.1136/jech.2003.018044
Mennis, J., Mason, M. J., & Cao, Y. (2013). Qualitative GIS and the visualization of narrative activity space data. International Journal of Geographical Information Science, 27(2), 267–291. https://doi.org/10.1080/13658816.2012.678362
Miller, H. J., & Goodchild, M. F. (2015). Data-driven geography. GeoJournal, 80(4), 449–461. https://doi.org/10.1007/s10708-014-9602-6
Tunstall, H., Shaw, M., & Dorling, D. (2004). Places and health. Journal of Epidemiology & Community Health, 58(1). 6-10. http://dx.doi.org/10.1136/jech.58.1.6