Quantifying Land Cover Change in Urban Lake Watersheds
Urban development is known to impose stress on surface waters, often by dramatically altering water chemistry (Howell et al., 2012; Ren et al., 2014). To examine whether urban expansion within the Halifax Regional Municipality (HRM) is driving observed changes in water quality in a set of ~50 lakes, land cover change within their watersheds over a ~40-year period was quantified.
Obtaining Imagery
The study area falls within a single Landsat scene (located at Path 008, Row 029) and satellite images were selected from the summer months (July to September) to ensure vegetation was clearly distinguishable from other land cover types. Two Landsat images (30 m spatial resolution) were obtained from the USGS Earth Explorer; one from the early 1980s (Landsat 4 TM, Collection date: Sept 14, 1982) and the second from 2020 (Landsat 8 OLI, Collection date: July 28, 2020). Collection 1, Level 2 products (corrected for atmospheric interference to estimate surface reflectance) were selected to enable the use of band ratios but Level 1 products would have been sufficient as all change detection was performed on the thematic outputs of the imagery classifications.
Cloud Cover
Although cloud cover and cloud shadow accounted for less than 3% of the approximate study area in the 1982 image, cloud cover obscured enough of the land features that a 1985 image (Landsat 5 TM, Collection date: Sept 30, 1985) was also obtained and classified to replace the area covered by clouds and shadows. Ultimately, map algebra was used to mosaic the classified outputs of both images such that pixels recognized as cloud and cloud shadow in the 1982 output were replaced with pixels from the 1985 output.
Unsupervised Classification
To improve the processing speed of classification, all images were subset to an approximate minimum bounding rectangle encompassing the watersheds of the study lakes prior to classification. Unsupervised (Iterative Self-Organizing Data Analysis Techniques, ISODATA) classifications were performed on false colour composites compiled by the Composite Bands tool using the visible red, near-infrared, and short-wave infrared bands as input channels.

This spectral band combination highlights vegetated areas and is also useful for identifying water features. All classifications were performed in ArcGIS Pro 2.7.3 using the ISO Cluster classifier (iterations: 40, clusters: 20). Resulting spectral classes were aggregated to three informational classes; water, developed, and undeveloped. A fourth class for cloud and cloud shadow was included for the 1982 image.
Post Classification Modifications
Wetlands and barrens areas (i.e., areas with exposed bedrock) were frequently misclassified as developed in both the 2020 and mosaicked 1982 outputs. Delineations of these land cover types were obtained from the Nova Scotia Department of Natural Resources (2021; n.d.), rasterized, and used to amend the classified outputs through map algebra. Although the delineations do not date back to 1980, it was assumed that these areas are relatively constant.
Accuracy Assessments
Following the amendments, accuracy assessments were performed on both outputs by generating a random sample of 500 points (stratified to class percentages) and assigning each to their appropriate informational class. To assist with this process, different composites were used to highlight certain features in the reference image and ancillary data was used where available and when needed. Both outputs achieved a Kappa statistic greater than 0.85 and overall accuracies above 95% and were deemed to be sufficiently accurate. Detailed accuracy results, including user’s and producer’s accuracies for each informational class are reported in Table 1.
| Water | Developed | Undeveloped | |
| ~1980 mosaicked output: Producer’s Accuracy | 0.986 | 0.822 | 0.982 |
| ~1980 mosaicked output: User’s Accuracy | 0.958 | 0.902 | 0.977 |
| 2020 output: Producer’s Accuracy | 0.957 | 0.853 | 0.976 |
| 2020 output: User’s Accuracy | 0.944 | 0.881 | 0.973 |
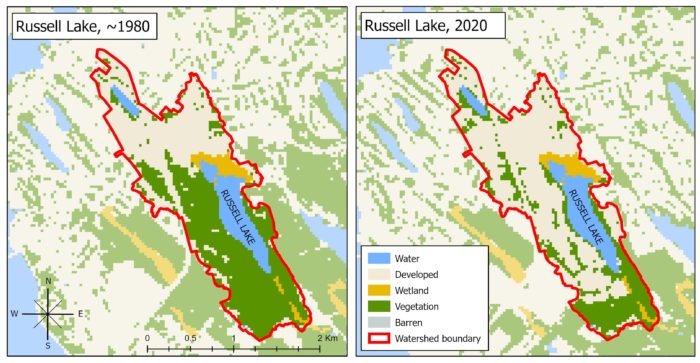
Moving forward, these outputs will be used to identify the level of development within each study lakes’ watershed at each point in time. Figure 2 provides an example for Russell Lake. Visual examination of this figure indicates that substantial increases in development have occurred within Russell Lake’s watershed since ~1980 (Figure 2).

Map projection: NAD 1983 UTM Zone 20N. Resolution: 30 m.
These outputs will be used to calculate increases and decreases in development over the ~40-year period in each of the study lakes’ watersheds, and will ultimately be used to explore relationships between urban development and the various changes in water quality parameters within each lake.
References
Howell, E. T., Chomicki, K. M., & Kaltenecker, G. (2012). Patterns in water quality on Canadian shores of Lake Ontario: Correspondence with proximity to land and level of urbanization. Journal of Great Lakes Research, 38, 32–46. https://doi.org/10.1016/j.jglr.2011.12.005
Nova Scotia Department of Natural Resources. (2021). Nova Scotia Forest Inventory (Current Forest Data). Retrieved from: https://novascotia.ca/natr/forestry/gis/forest-inventory.asp
Nova Scotia Department of Natural Resources (Wetlands and Coastal Habitats Program). (n.d.) Nova Scotia Wetland Vegetation and Classification Inventory.
Ren, L., Cui, E., & Sun, H. (2014). Temporal and spatial variations in the relationship between urbanization and water quality. Environmental Science and Pollution Research, 21(23), 13646–13655. https://doi.org/10.1007/s11356-014-3242-8
