How Do We Define Green Spaces?
Due to my interest and work looking into the health impacts of natural areas, it is crucial to create variables that allow me to quantify greenspace. A number of different methodologies have been developed in an attempt to provide the best proxy for a population’s exposure to ‘greenspace’, and no one method has been universally agreed on to provide this information. The use of ArcGIS provides researchers with several options and tools to accurately describe the greenness around a community or population. Each method aims to capitalize on the scale of interest and use the most information possible depending on the area of investigation, whether that be a city, country, or globally. To understand the current approaches, it may be best to look at some of the earliest research towards the impacts of nature on one’s health.
One of the first pivotal papers to examine nature exposure was Ulrich in his 1984 paper “View through a window may influence recovery from surgery” published in Nature. Ulrich’s study looked at patients recovering from a standard gall bladder surgery, keeping track of there inpatient time, required analgesic dose, and nurses’ notes regarding patient attitude. Two groups of patients were allotted either a room with a view of a brick wall or a view of a stand of trees. Not surprisingly, the patients with a natural view were discharged earlier, required less analgesics, and were noted to be in a more positive mood throughout inpatient care. Although this paper focuses on a clinical setting, the question of whether greenspace influenced a human’s health could be asked at the population level.
Any project with the scope of a population level of interest can benefit from a suite of GIS tools, and require a geographical component to be included. At the smaller scale of focus a research group based in Toronto used a number of precise datasets to develop a greenness variable to be included throughout analysis. Karden et al. (2015) published an article in Scientific Reports titled “Neighborhood greenspace and health in a large urban center”, to run analysis using GIS data on individual trees and QuickBird satellite imagery. Using a study site confined to an urban centre typically means there is enough computer power to handle a massive amount of information such as the location of every tree planted by the municipal government, in conjunction with satellite imagery. Using these two sources, two greenness variables were created to capture the crown area of trees and the density of trees throughout the city. This study is a great example of how useful open data can be to research groups and the importance of quality data being available to produce quality research.
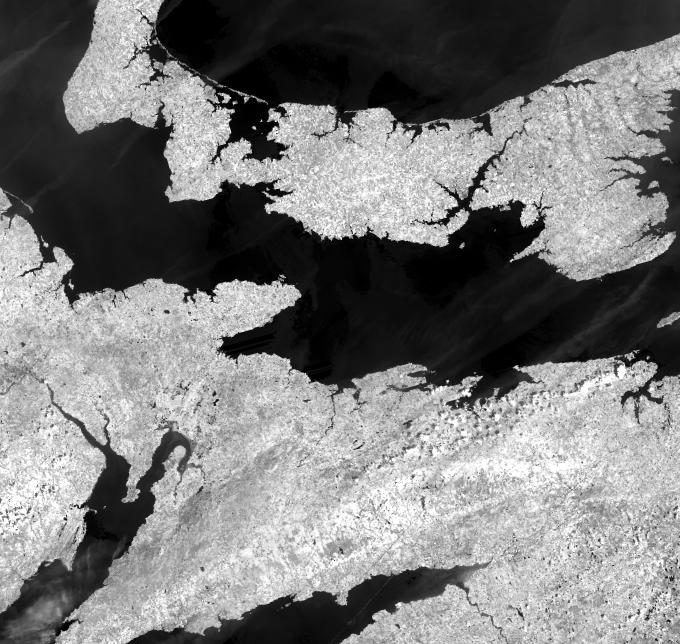
On the other end of the scale my research attempts to encompass the entire country and of course using a dataset that details the location of every tree would be unattainable with such a large coverage area. In order to create an accurate greenness variable, I prefer to use satellite imagery exclusively, as the rapid advancement of remote sensing resolution continues to grow. As a proxy of living vegetation, the normalized difference vegetation index (NDVI) is calculated using near infrared (NIR) and visible (VIS) reflectance from Landsat-8 (though other sensors can be used to collect this data). Using the equation: (NIR-VIS)/(NIR+VIS), the NDVI can be calculated to show areas of living vegetation and help assign a greenness variables to a community, which will be between -1 (little growth) to +1 (heavy growth). An example of NIR satellite imagery from Landsat-8 is pictured above. Showing PEI, north-western Nova Scotia, and New Brunswick. The light areas of the image show NIR reflectance (indicative of vegetation) and dark areas are adsorbing NIR light.
Landsat-8 provides a resolution of 30m x 30m, which is adequate for the national scale of interests I am looking into. Using the study participants’ postal code an NDVI value can be assigned and used as a continuous variable within statistical models. Using this approach does of course pose some potential weaknesses. The amount of time a participant spends away from the postal code, seasonality, or whether the participant engages with the surrounding natural areas are a examples of factors that are not measurable using satellite data alone.
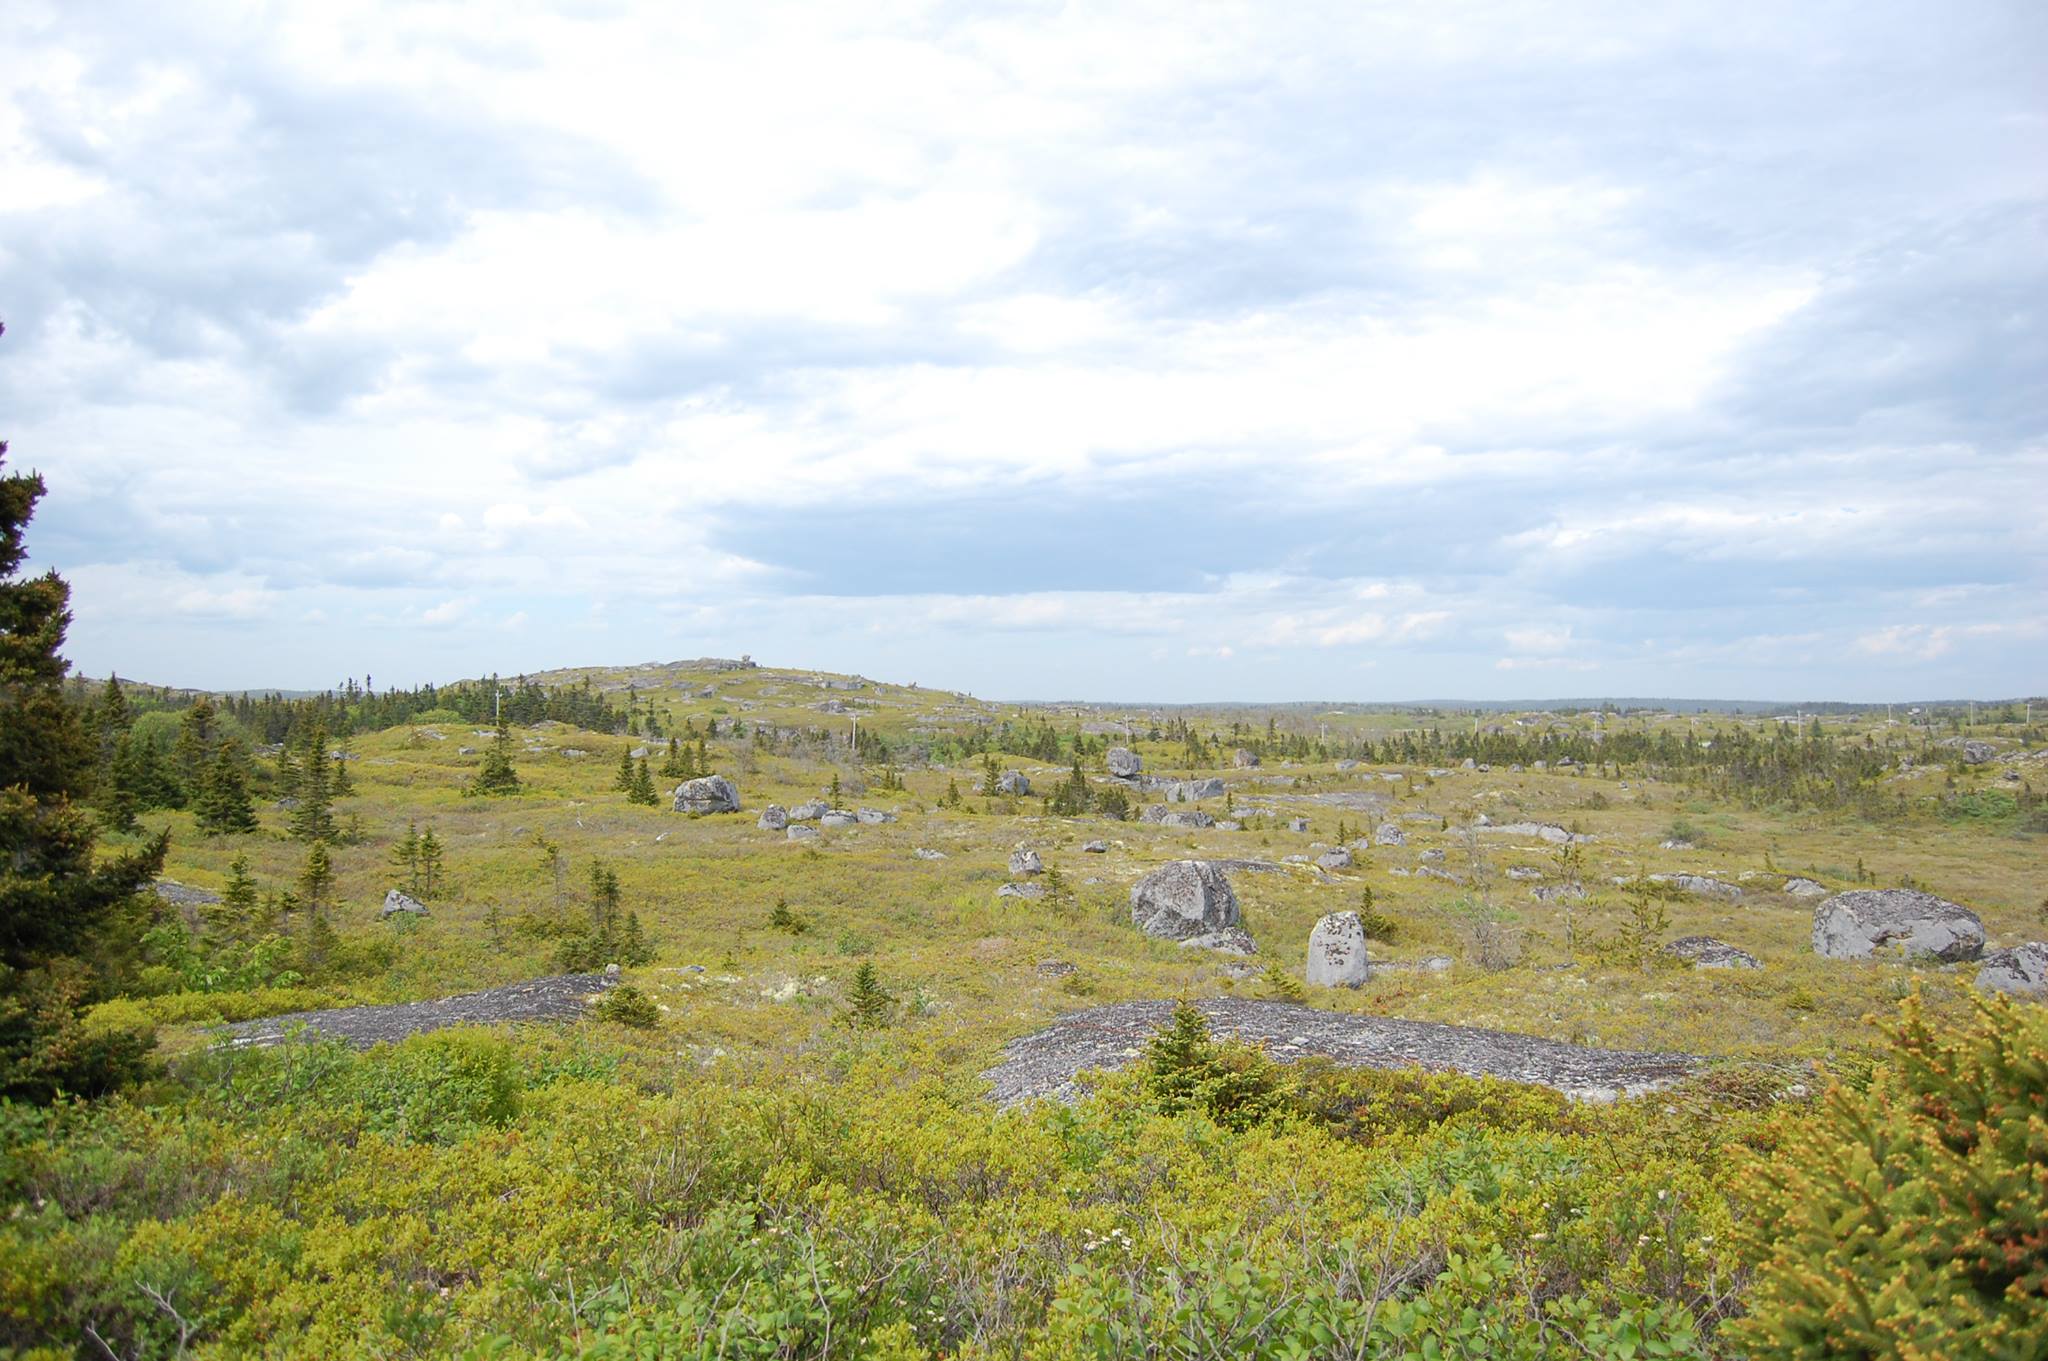
I’m always interested in keeping up to date with the latest method to determine greenspace and enjoying learning about new GIS tools to help. Ideally, a universal method could be developed to create uniformity across research and work towards understand nature’s impact of health. Moving beyond greenspace, I haven’t even touched on the potential benefits of ‘blue space’ or water bodies, which are intuitively known to aid with relaxation and overall enjoyment. That may be for another blog post though and should require some personal research, like the picture below!