
Diving into ArcGIS Business Analyst
As a student in the Geospatial Data Analytics program at COGS, I had the opportunity to explore the capabilities of the Esri Business Analyst extension in ArcGIS Pro. I was impressed by how the platform draws from various data sources to provide a comprehensive tool for users to incorporate various demographic variables and business profiles into their analyses and to present the results in ready-to-use reporting templates.
Before diving into some business analysis scenarios, it is important to note the data source that Business Analyst references to. In this blog post, the data source is set to Canada from the ArcGIS Online portal, in which case credits may be required for certain analyses and reports. Alternatively, locally installed data may be available with your Business Analyst license.
Scenario 1 – Understanding Demographics of Your Business Location
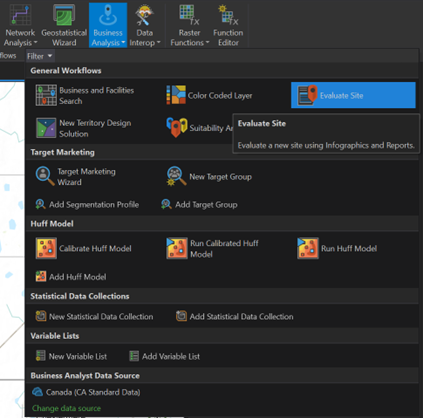
As a business operator, it’s essential to understand the demographics of those who live near your business location. This information can help you tailor your products and services to attract more customers. The `Evaluate Site` tool in Business Analyst makes this task simple and straightforward.
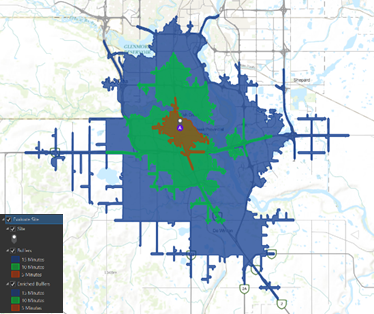
For this demonstration, I used the location of a bubble tea store in Southeast Calgary, AB, and set 3 buffer zones with drive times of 5, 10, and 15 minutes from the store. With 4 simple steps to identify location, create buffer parameters, set analysis templates, and review summary, results including a grouped layer with store location and trade areas, an interactive infographic panel, and a summary report are created.
Map: The map displays the trade areas, represented by the colored polygons, where the store draws its customers. The ‘Enriched Buffers’ layer shares the same geometry as the ‘Buffers’ layer, but with enriched variables specified during step three, such as population % for each age group, spending index, and more.
Reports: All reports selected during step three are saved in PDF formats within the project directory, making it easy to share with stakeholders. Here are some sample reports that you can expect.
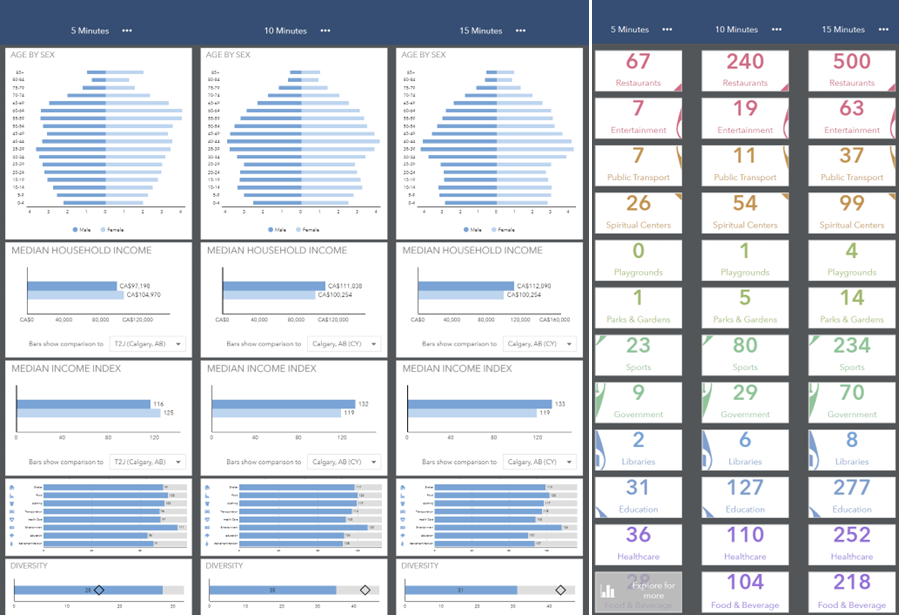
Infographics: The interactive infographic panel is a fun tool to explore and understand your potential customers and the area. There are various templates with different themes and graphic presentations. Most elements in the infographic panels are interactive and provide a detailed breakdown of the output. In this case, the bubble tea store seems to have a higher percentage of senior citizens within a 5-minute drive, with slightly lower median household income and diversity index. Based on this information, the store could attract more customers by offering low- to no-sugar beverages and daytime promotions. The “What’s in My Community?” section provides a summary of services within the trade area, giving insight into the saturation of the target market.
Scenario 2 – Evaluating Multiple Store Locations
For franchisers looking to evaluate multiple existing store locations, the `Generate Drive Time Trade Areas` tool is the perfect solution. This tool generates the trade areas around each store based on travel time or distance.
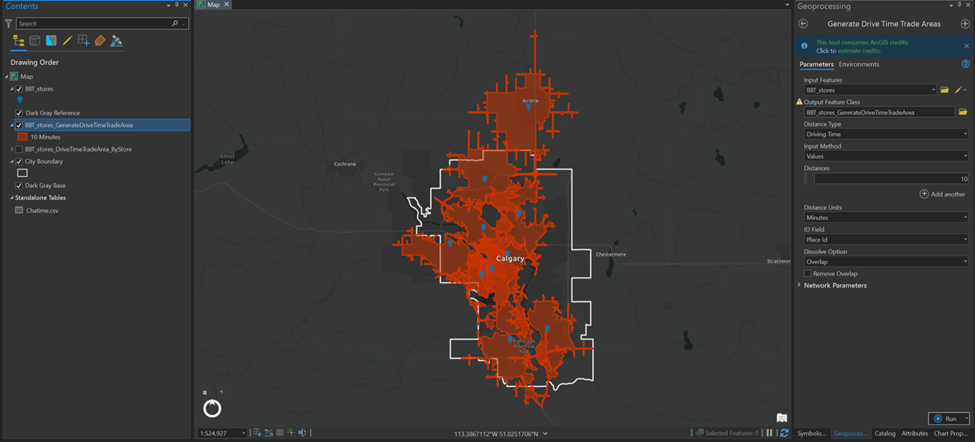
In this example, I used 10 bubble tea store locations* in and around Calgary as the input features, with a drive time of 10 minutes from the store (driving distance, walking time and distance are also available as parameters). The result is displayed in the map below.
There are overlapping trade areas near central Calgary, while some areas in the Northeast are still lacking a store within a 10-minute drive. This information could indicate a potential new franchise opportunity. The `Summary Report` tool generates infographics and reports similar to those in scenario 1, providing a deeper understanding of the potential customer base.
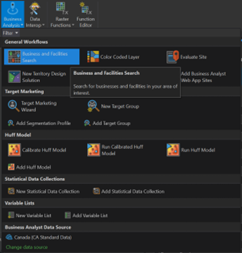
* The store locations were compiled from a Google Maps search and converted to a point feature layer using `XY Table to Point` tool. It is worth mentioning that Esri Business Analyst also has the `Business and Facilities Search` tool. It works in many instances and was effective in locating different businesses required in our school projects.
Scenario 3 – Utilizing Customer Location Data
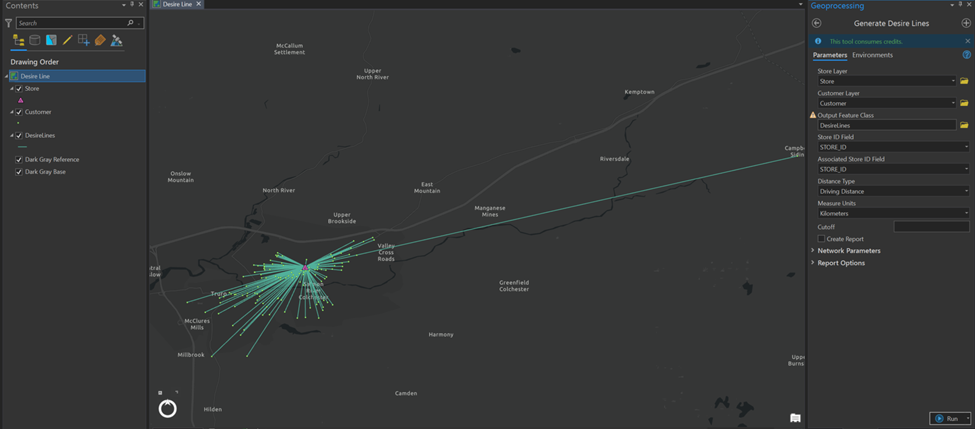
For businesses with data on customer locations and/or sales volume, the `Generate Customer Derived Trade Areas` tool utilizes that data and provides more realistic insight about the business. In this example, fictional customer data were created for a liquor store in Truro, NS. The process is similar to that in Scenario 2, except this tool takes account of the percentage distribution of your customer and provides options of the type of customer-derived trade area.

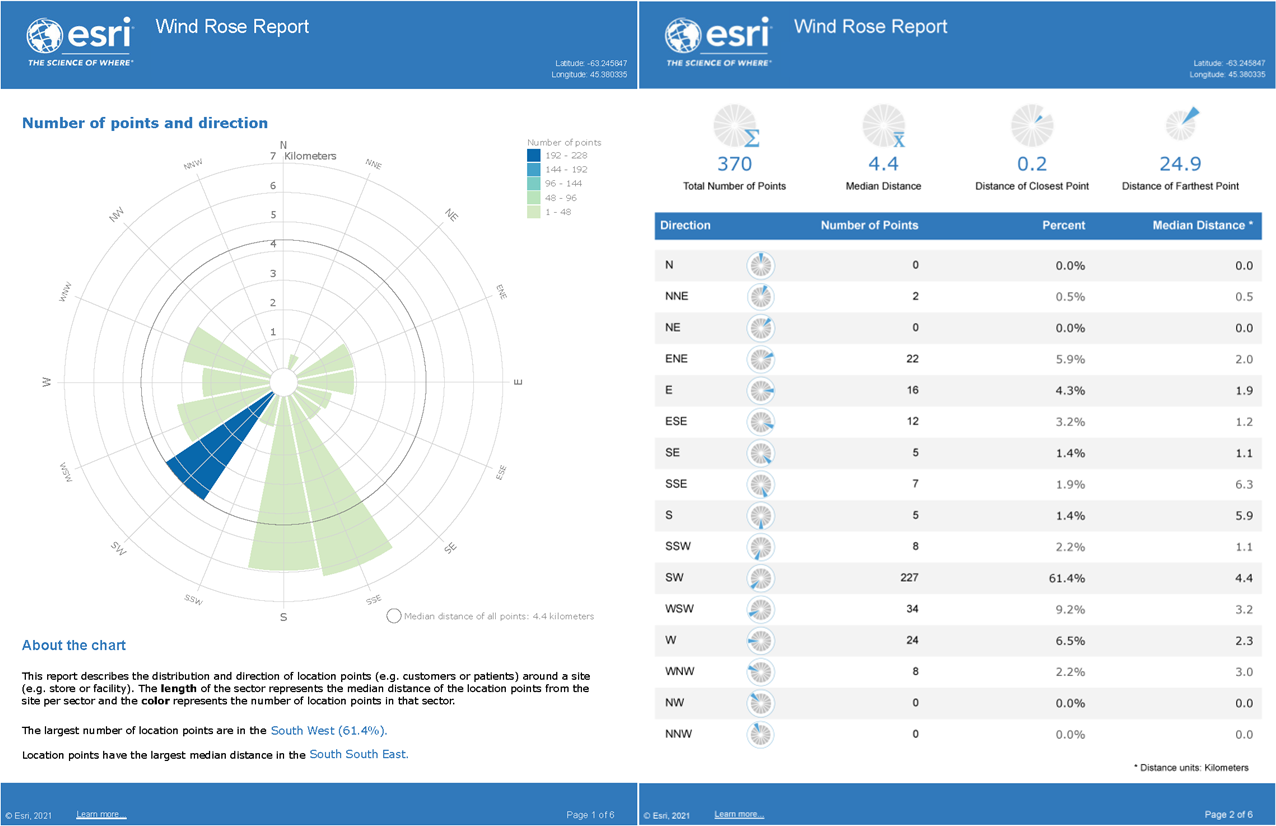
In addition, the `Generate Desire Lines` tool creates a spider diagram that improves pattern detection of where the customers are. By generating the desire lines, driving distances from each customer’s location to the store are calculated and stored as an attribute. There is also the option to create a Wind Rose Report that summarizes the distribution and direction of customers relative to the store. In this case, the median travel distance is 4.4km, with majority of the customers are located southwest and over 4km driving distance away from the store.
Summary
One of our assignments was about comparing trade areas as well as the demographics and socio-economic characteristics between wineries located in the provinces of Nova Scotia and British Columbia, and it has been an engaging and enlightening experience to discover unique geographic and demographic patterns on opposite coasts of the country. If possible, I encourage you to try some of the Business Analyst tools and share your insights. Meanwhile, I will continue to delve into more of its capabilities, and hope to share my newfound knowledge and discoveries.