
Cooling Locations for the Senior Population in Toronto
Introduction
Over the past few years, the city of Toronto has introduced various cooling locations for people to refresh themselves during the summer. The government built these cooling locations across the city as part of their initiative to help residents cool down during extreme heat waves. The data released last year during the summer months under of the Heat Relief Network were obtained from the Toronto Open Data Catalogue. The goal for this particular research is to see if there is a relationship between the two variables that we have selected: cooling centers/locations and the density of senior population.
Methodology
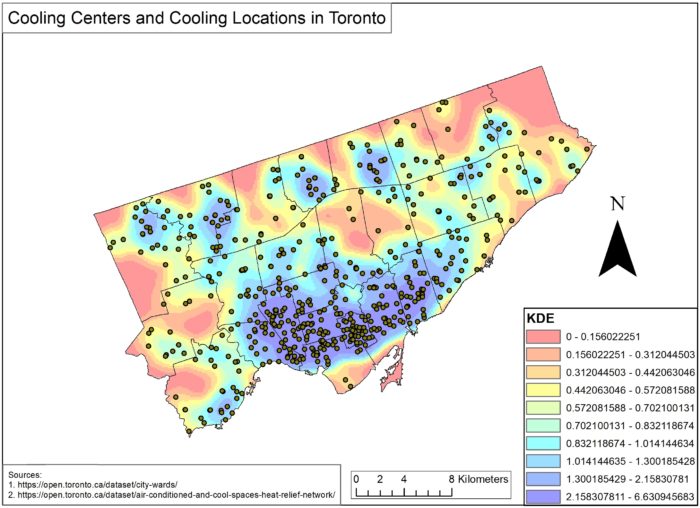
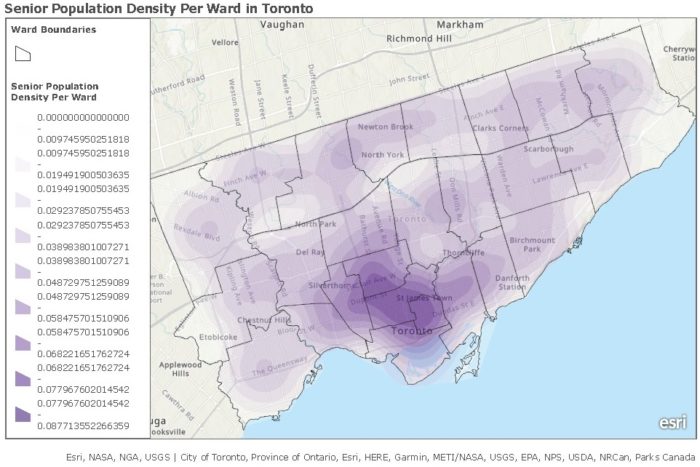
First, we downloaded the data for cooled and air-conditioned spaces in shapefile format from the Toronto Open Data Catalogue. Then, we determined the number of cooling centers and cooling locations in Toronto by filtering to exclude certain data like wading pools, indoor pools, and outdoor pools. We proceeded on using the kernel density estimation (KDE) tool to determine whether there are specific hotspots of these cooling places being built in the 25 wards. We created a separate map for the density of the senior population by ward in Toronto. By using the geoenrichment tool on ArcGIS Online, we can easily generate the senior population per ward in the city of Toronto which provided us with senior population numbers: 65 to 69 years old, 70 to 74 years old, 75 to 79 years old, 80 to 84 years old and as well as 85 years and older. Then, we can calculate the density to determine where most of the seniors are concentrated in the city.
Analysis
We can see that most of the cooling centers and cooling locations in Toronto are mostly concentrated near the downtown core where most of the seniors are currently living in. This indicates that the city has introduced these cooling spots in the most dense location of the city where most of the population lives, including seniors of 65 years and older, so that they can be relieved from the heat. However, we can see that there are certain communities across the city that do not have adequate cooling spots for seniors when comparing the two maps. In particular, we can see that there are pockets of senior population located in the northwest and southwest sides of Toronto but there are some spots where the cooling centers and cooling locations do not serve some communities of the senior population which means that they will need to travel a bit to find relief from the heat. Similarly, there lacks cooling centers and cooling locations near the northeast parts of Scarborough. There appears to be fewer cooling centers and cooling locations in the two wards around Leslie Street and Don Mills Road could be a serious issue when it comes to extreme heat for senior population.
Conclusion/Next Steps
In conclusion, there is some relationship in between cooling centers/cooling locations and the density of senior population per ward in the city of Toronto. Based on the kernel density estimation analysis conducted above, we can see that the city prioritizes most of its cooling spots in downtown core area, and to a certain degree, pockets of North York, Scarborough, East York, and Etobicoke. Some neighborhoods do not benefit enough, having fewer cooling spots that may not fully serve the senior population who can be more vulnerable to extreme heat during the summertime. The city of Toronto may need to further expand some of their cooling spots in the near future to ensure to cooling spots are accessible to the senior population.
References:
1. Toronto City Clerk’s Office. (2020, August 31). Open Data Dataset. Retrieved August 31, 2020, from https://open.toronto.ca/dataset/city-wards/
2. Toronto Public Health. (2019, September 29). AIR CONDITIONED AND COOL SPACES (HEAT RELIEF NETWORK). Retrieved August 31, 2020, from https://open.toronto.ca/dataset/air-conditioned-and-cool-spaces-heat-relief-network/