Using the GeoNB Data Catalogue and VBScript to obtain habitat-level site characteristics for cavity-nesting duck nest sites
I am currently working on my Master’s of Science in Forestry at the University of New Brunswick, looking at nesting habitat use and availability for cavity-nesting ducks in the Saint John River floodplain. Field work for this project involves going out into the floodplain and locating both the natural cavities that cavity-nesting ducks have evolved to use as nests and nest boxes, which have been added to the landscape by humans to increase suitable nesting sites and help support populations of these birds. Cavity-nesting ducks include iconic species such as the wood duck, and these species are important to hunters, conservation groups, and recreational bird watchers.
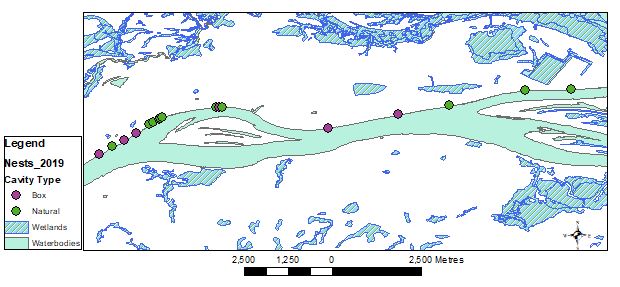
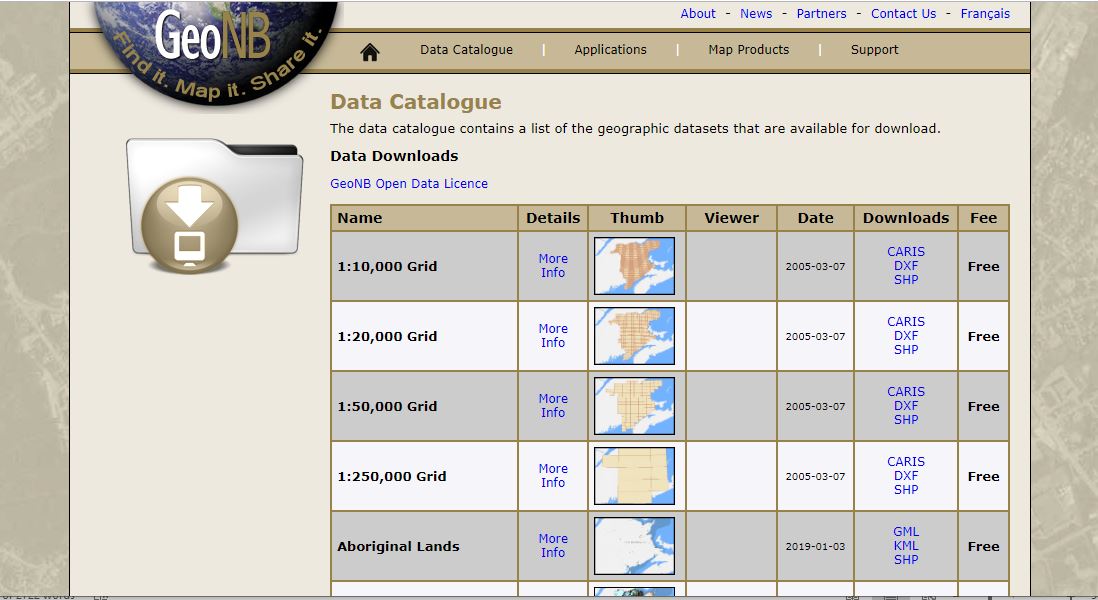
Once potential nest sites have been located, we determine if they are in use, which species are using them, and several other nest site characteristics. For larger-scale habitat characteristics, however, we turn to GIS data. Service New Brunswick’s GeoNB Data Catalogue makes a wide variety of provincial GIS and LiDAR data available to the general public. For my purposes, the New Brunswick Hydrographic Network (NBHN) data set is invaluable. Downloading the package provides access to a number of layers, including permanent waterbodies and wetlands. The distances between potential and occupied nest sites and the nearest permanent water and wetlands are potential predictors of nest site occupancy, as permanent waterbodies and wetlands offer sources of food and brood habitat. Upon hatching, nestlings will leave the nest and the female will lead them to water. The farther the nestlings must travel over land, the higher the risk becomes that they will encounter predators and the lower the survival rate becomes for the brood. The direction from the nest site to water or wetlands may also be valuable, as it has yet to be thoroughly explored as a potential variable.
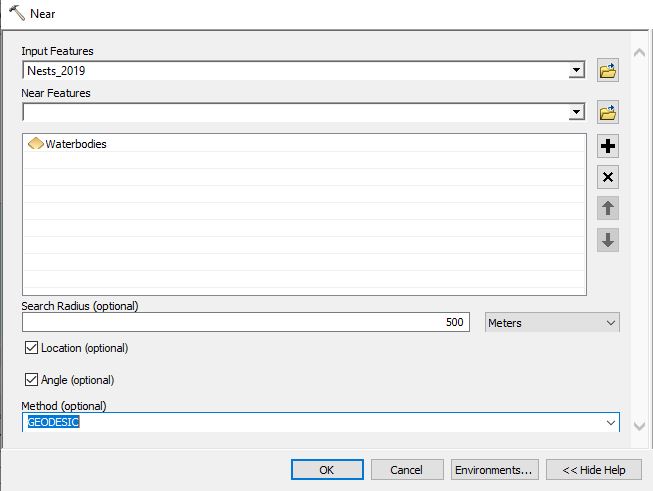
To collect this information, I used the Near tool, from the Analysis toolbox in ArcMap 10.5.1. I ran the tool on both the NBHN “Waterbodies” and “Wetlands” layers, using my set of potential and occupied nest sites (“Nests_2019”) as the input features. I also enabled the angle reporting checkbox and set the method to geodesic. Since the ‘Near’ tool reports back the “FID”, I had to join the “Waterbodies” table to “Nest_2019” in order to obtain the actual names of each waterbody (ex. “Saint John River” and “Grand Lake”). Another limitation comes from the reported angle. The Esri Help documentation tells us that, “A near angle measures direction of the line connecting an input feature to its nearest feature at their closest location. […] the angle is within the range of -180° to 180°, with 0° to the north, 90° to the east, 180° (or -180°) to the south, and -90° to the west.” This means that we can convert the angle measures to directions using some VBScript in the Field Calculator.
To obtain compass directions, I began by creating a new attribute text field, length 2, titled “Dir_Water”, which I gave the alias “Direction to Water”. Next, I opened the Field Calculator for the new field, turned on VBScript, and showed the codeblock. I set “Dir_Water” = Dir and entered the following in the codeblock:
Dim Dir
If [NEAR_ANGLE]>=(-22.5) and [NEAR_ANGLE]<=22.5 Then
Dir = “N”
Elseif [NEAR_ANGLE]>22.5 and [NEAR_ANGLE]<=67.5 Then
Dir = “NE”
Elseif [NEAR_ANGLE]>67.5 and [NEAR_ANGLE]<=112.5 Then
Dir = “E”
Elseif [NEAR_ANGLE]>112.5 and [NEAR_ANGLE]<=157.5 Then
Dir = “SE”
Elseif [NEAR_ANGLE]<(-22.5) and [NEAR_ANGLE]>=(-67.5) Then
Dir = “NW”
Elseif [NEAR_ANGLE]<(-67.5) and [NEAR_ANGLE]>=(-112.5) Then
Dir = “W”
Elseif [NEAR_ANGLE]<(-112.5) and [NEAR_ANGLE]>=(-157.5) Then
Dir = “SW”
Else
Dir = “S”
End If
I repeated this process for the angles reported for the “Wetlands” layer, using another new attribute text field, length 2, titled “Dir_Wetland”, which I gave the alias “Direction to Wetlands”. The final results of this process revealed that the mean distance to water for all potential and occupied nest sites was less than 50 meters. Distances to wetlands had a very wide range, with a minimum of 0 meters and a maximum greater than 2400 meters. The data on the directions to water and wetlands have not yet been analyzed. Overall, an easily obtained data set and a simple set of steps and VBScript in ArcMap have yielded data that would have been difficult and very time consuming to have collected in the field.