
Identifying the critical source areas of nitrate load in an agricultural watershed in PEI using the SWAT model
Background
Nitrate pollution caused by intensive agricultural activities has drawn increasing intention around the world over the past few decades (Liu et al., 2016; Milovanovic, 2007; Ongley et al., 2010; Sith et al., 2019; Van Meter et al., 2017). Nitrate pollution is threatening the health of receiving water bodies leading to hypoxia or eutrophication of rivers, lakes, and estuaries, as well as the deterioration of groundwater. In Prince Edward Island (PEI), the degradation of surface water and groundwater quality has been found to be closely associated with the high nitrate load from intensive potato production in the province (Benson et al., 2006; Bugden et al., 2014; Danielescu and MacQuarrie, 2011; Liang et al., 2019; Zebarth et al., 2015). Measuring these agricultural non-point source (NPS) pollution to waters is difficult due to the large variation of the uneven distribution of NPS over space and time within watersheds (Miller et al., 2017).
Methods
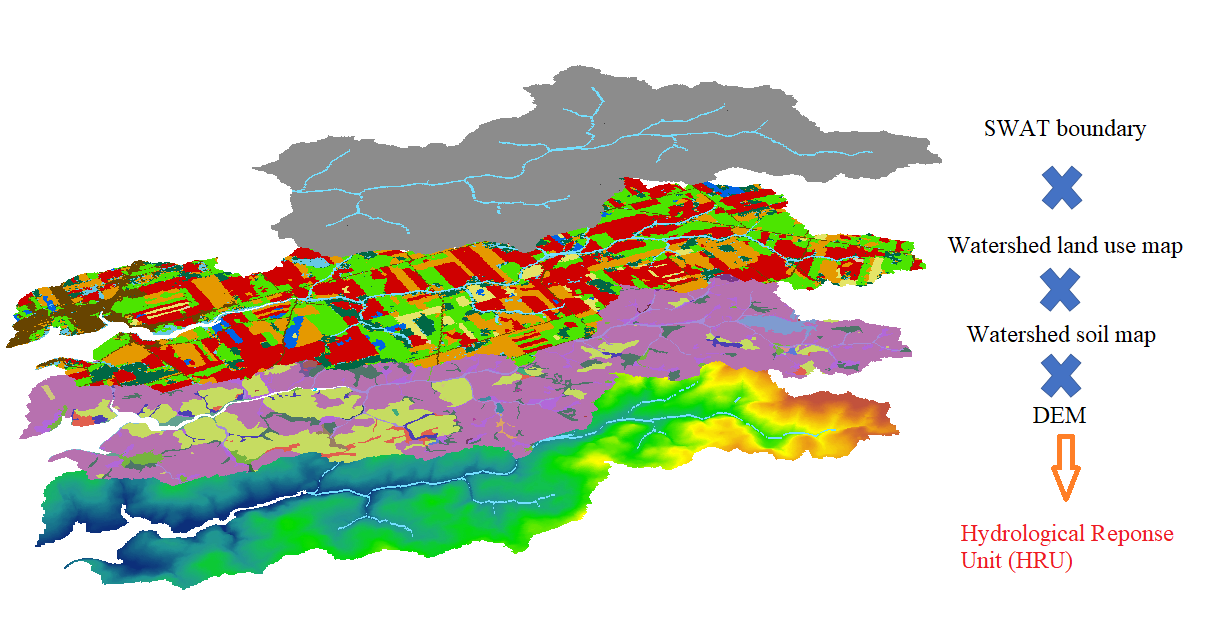
The Soil and Water Assessment Tool (SWAT) is a physical-based and semi-distributed hydrological model that was designed to simulate stream flow, sediment yield, nutrient and pesticide load and crop growth at watershed scale (Arnold et al., 1998). The SWAT model requires datasets of topography, soil, climate and land use as input for model setup. In the SWAT model, a watershed is divided into subbasins, then the subbasins are further divided into hydrologic response units (HRU) (Fig. 1) with homogenous soil, slope, land use, and similar hydrological characteristics (Ullrich and Volk, 2009). A HRU is the basic calculation unit within the SWAT model. The SWAT model reports the values of different hydrological and chemical parameters on subbasin level by calculating the total amount or area weighted average of all HRUs within subbasins. The main channel output is calculated by integrating input to the channel with major channel processes.
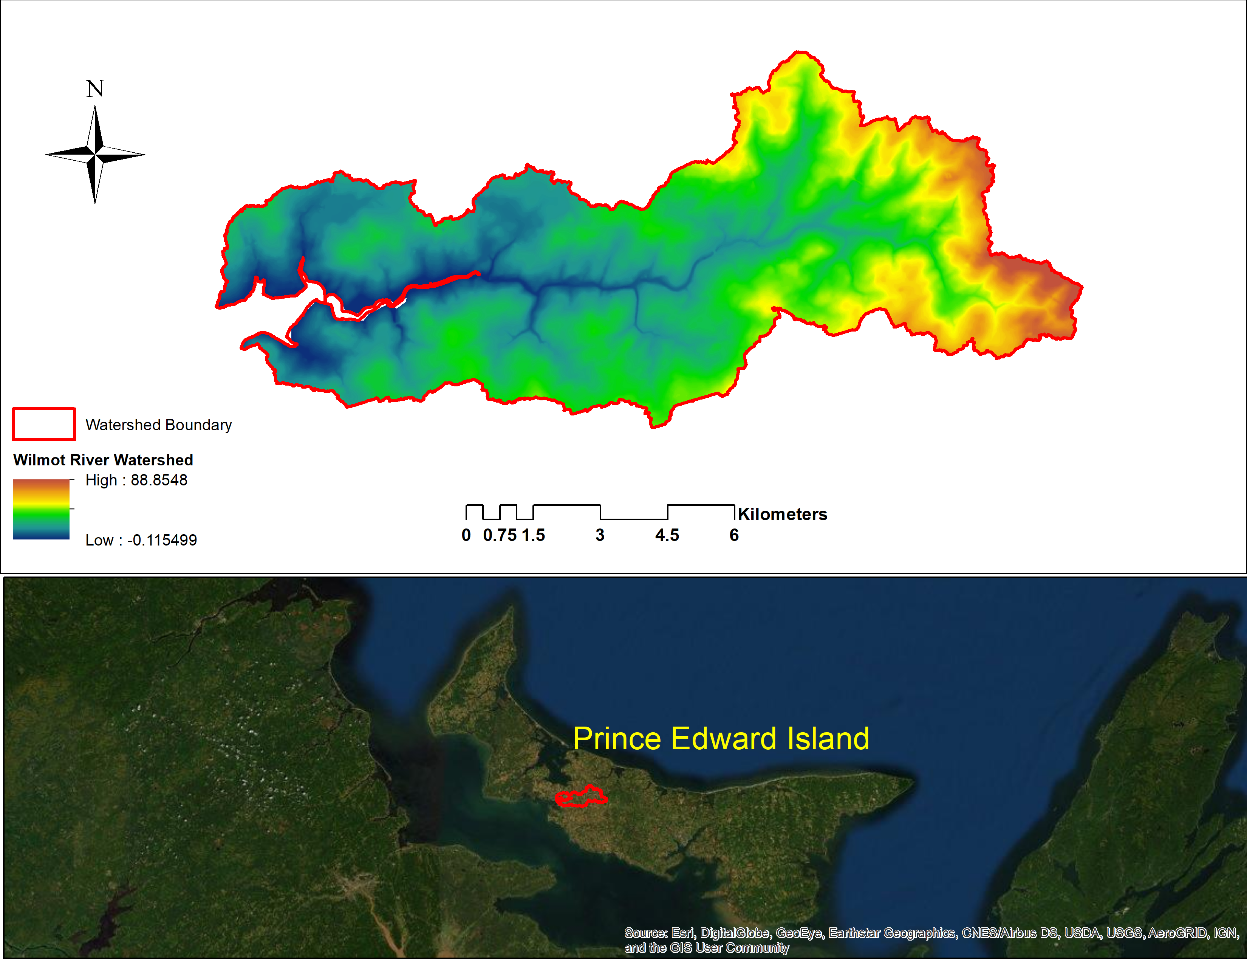
The Wilmot River Watershed is a typical agricultural watershed located in the central west part of Prince Edward Island (Fig. 2). The watershed covers an area of 61 km2 with over 70% of its land under agricultural production. With potatoes as the major cash crops, most of the landmass of the watershed has been under potatoes rotated with forages and grains.
The SWAT model for Wilmot River Watershed was setup using soil, DEM, climate, and dynamic land use data of the watershed for the period of 2011-2017. Daily streamflow and stream nitrate load calibration were performed using the SUFI-2 algorithm in the Soil and Water Assessment Tool Calibration and Uncertainty Procedure (SWAT-CUP 2012) software package (Abbaspour et al., 2015). Baseflow and snow melting parameters were calibrated for stream flow and the fitted values are shown in Table 1. Nitrogen parameters calibrated for nitrate load are summarized in Table 1. A 3-year warm-up period (2008-2010) was used to stabilize the model and the model was calibrated from 2011 to 2013 and further validated from 2014 to 2017. The SWAT model performed well in predicting both daily stream flow and nitrate load according to the criteria recommended by Moriasi et al. (2007).
Results and discussion
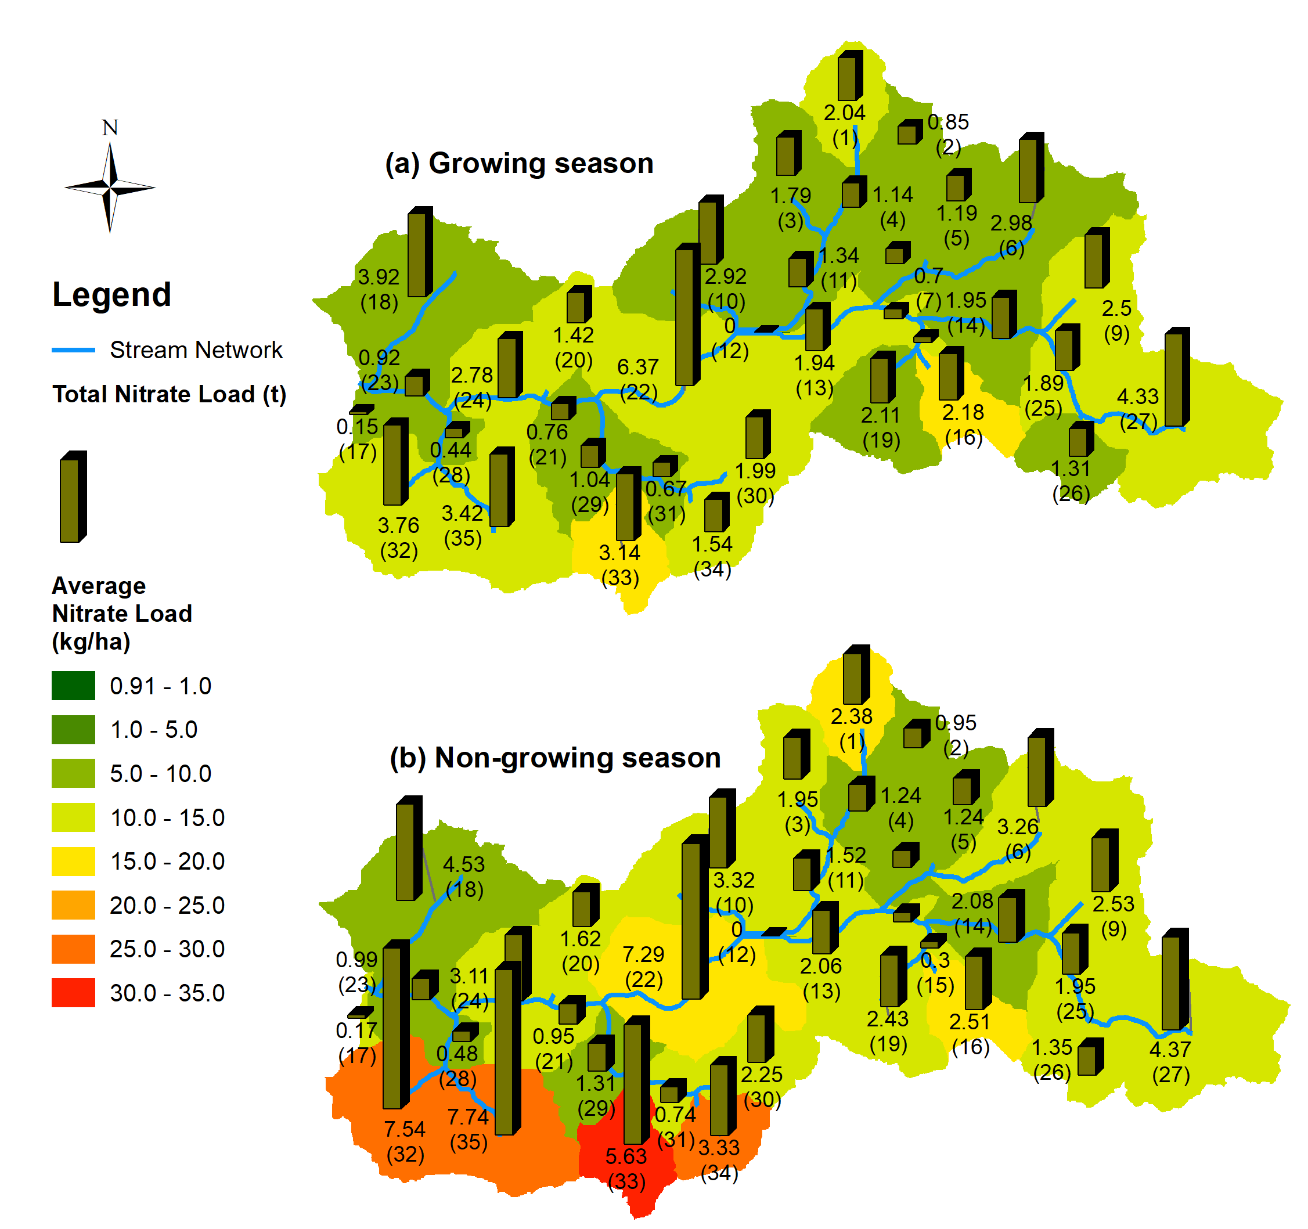
By analyzing the monthly SWAT HRU output, the total nitrate output of SWAT subbasins in the growing season and non-growing season were calculated. Fig. 3 provided a visualized result of the spatial and temporal variation of nitrate load across the watershed. The results indicated that nitrate load showed high variability both temporally and spatially. For the entire watershed, annual nitrate load during the simulation period was 24.6 kg ha-1 yr-1. Annual nitrate load ranged from 14.5 kg ha-1 for subbasin 2 to 51.9 kg ha-1 for subbasin 33. Fig. 3 indicated that nitrate load experienced a substantial increase from growing season to non-growing season. During the growing season, average nitrate load ranges from 6.9 kg ha-1 for subbasin 2 to 18.6 kg ha-1 for subbasin 33 (Fig. 3 (a)). Nitrate load of subbasin 12 is the lowest since it is a non-agricultural subbasin, mainly covered by water. Average non-growing season nitrate load ranges from 7.7 kg ha-1 for subbasin 2 and 33.3 kg ha-1 for subbasin 33 (Fig. 3 (b)). Nitrate load increased by 1% to 126% from growing season to non-growing season at subbasin level.
It has been well documented that nitrate losses from agriculture landscape are different between growing and non-growing seasons (Cicek et al., 2015; Jiang et al., 2011; Liang et al., 2019; Woli and Hoogenboom, 2018; Zebarth et al., 2015). As discussed above, nitrate load to streams was primarily contributed by groundwater discharge during growing seasons (summer and early fall). During non-growing seasons, especially in winter and early spring, nitrate loss was enhanced with concentrated runoff as a result of snow melting events. The most dramatic increase of nitrate load from growing season to non-growing season occurred in subbasins 32, 33, 34 and 35, which are located in the southwest part of the watershed. Nitrate load of these four subbasins almost doubled from growing season to non-growing season. The total area of these four subbasins account for 14.1% of the total area of the watershed while they contributed 28.7% of the total nitrate load during the non-growing season. Furthermore, these subbasins are also close to the watershed outlet, more nitrate export coupled with less travelling time would make these subbasins pose higher threats to the aquatic environment of the estuary compared with other subbasins. Identifying these heavily polluted areas would provide critical information for land management and pollution control. Wagena and Easton (2018) pointed out that targeting critical source areas would achieve almost the same results as widespread targeting for water quality protection. Therefore, under the present situation, more attention should be paid to the southwest part of the watershed.
Reference
Abbaspour KC, Rouholahnejad E, Vaghefi S, Srinivasan R, Yang H, Kløve B. A continental-scale hydrology and water quality model for Europe: Calibration and uncertainty of a high-resolution large-scale SWAT model. Journal of Hydrology 2015; 524: 733-752.
Arnold JG, Srinivasan R, Muttiah RS, Williams JR. Large area hydrologic modeling and assessment part I: model development 1. Journal of the American Water Resources Association 1998; 34: 73-89.
Benson VS, VanLeeuwen JA, Sanchez J, Dohoo IR, Somers GH. Spatial analysis of land use impact on ground water nitrate concentrations. J Environ Qual 2006; 35: 421-32.
Bugden G, Jiang Y, van den Heuvel M, Vandermeulen H, MacQuarrie K, Crane C, et al. Nitrogen loading criteria for estuaries in Prince Edward Island: Fisheries and Oceans Canada, 2014.
Cicek H, Martens JRT, Bamford KC, Entz MH. Late-season catch crops reduce nitrate leaching risk after grazed green manures but release N slower than wheat demand. Agriculture, Ecosystems & Environment 2015; 202: 31-41.
Danielescu S, MacQuarrie KTB. Nitrogen loadings to two small estuaries, Prince Edward Island, Canada: a 2-year investigation of precipitation, surface water and groundwater contributions. Hydrological Processes 2011; 25: 945-957.
Jiang Y, Zebarth B, Love J. Long-term simulations of nitrate leaching from potato production systems in Prince Edward Island, Canada. Nutrient Cycling in Agroecosystems 2011; 91: 307-325.
Liang K, Jiang Y, Nyiraneza J, Fuller K, Murnaghan D, Meng F-R. Nitrogen dynamics and leaching potential under conventional and alternative potato rotations in Atlantic Canada. Field Crops Research 2019; 242: 107603.
Liu R, Xu F, Zhang P, Yu W, Men C. Identifying non-point source critical source areas based on multi-factors at a basin scale with SWAT. Journal of Hydrology 2016; 533: 379-388.
Miller MP, Tesoriero AJ, Hood K, Terziotti S, Wolock DM. Estimating discharge and nonpoint source nitrate loading to streams from three end‐member pathways using high‐frequency water quality data. Water Resources Research 2017; 53: 10201-10216.
Milovanovic M. Water quality assessment and determination of pollution sources along the Axios/Vardar River, Southeastern Europe. Desalination 2007; 213: 159-173.
Moriasi DN, Arnold JG, Van Liew MW, Bingner RL, Harmel RD, Veith TL. Model evaluation guidelines for systematic quantification of accuracy in watershed simulations. Transactions of the ASABE 2007; 50: 885-900.
Ongley ED, Xiaolan Z, Tao Y. Current status of agricultural and rural non-point source Pollution assessment in China. Environmental Pollution 2010; 158: 1159-1168.
Sith R, Watanabe A, Nakamura T, Yamamoto T, Nadaoka K. Assessment of water quality and evaluation of best management practices in a small agricultural watershed adjacent to Coral Reef area in Japan. Agricultural Water Management 2019; 213: 659-673.
Ullrich A, Volk M. Application of the Soil and Water Assessment Tool (SWAT) to predict the impact of alternative management practices on water quality and quantity. Agricultural Water Management 2009; 96: 1207-1217.
Van Meter KJ, Basu NB, Van Cappellen P. Two centuries of nitrogen dynamics: Legacy sources and sinks in the Mississippi and Susquehanna River Basins. Global Biogeochemical Cycles 2017; 31: 2-23.
Wagena MB, Easton ZM. Agricultural conservation practices can help mitigate the impact of climate change. Science of the Total Environment 2018; 635: 132-143.
Woli P, Hoogenboom G. Simulating weather effects on potato yield, nitrate leaching, and profit margin in the US Pacific Northwest. Agricultural Water Management 2018; 201: 177-187.
Zebarth BJ, Danielescu S, Nyiraneza J, Ryan MC, Jiang Y, Grimmett M, et al. Controls on nitrate loading and implications for BMPs under intensive potato production systems in Prince Edward Island, Canada. Groundwater Monitoring & Remediation 2015; 35: 30-42.