
GIS Summary of SNAP 2019 (Part 2): Landscape Archaeology Analysis with ModelBuilder and Python
Introduction
Over the past few months I have been investigating a new methodology of finding settlement patterns using GIS. The current method of settlement patterns often involves deep research and field studies. In this report I wish to add a new element to settlement pattern analysis. This method can also add more information to landscape archaeology as a whole through using GIS tools. For this method a python tool was developed to discern traits of surface morphology from raster layers. A tool built with ModelBuilder, a visual programming language for building geoprocessing workflows in ArcGIS, was created for similar analysis under different statistics types for other landscape rasters. For this report, I will first discern and explain the tools created to extract statistics, and tools to determine criteria for settlement pattern analysis. I will then explain the different statistics analyzed from these tools and go through several examples that were analyzed in our case study on the Island of Naxos in the Aegean Sea.
New Tools for Landscape Archaeology
The wonders of present GIS technologies are the new tools and the ability to create workflows such as models in ModelBuilder that make the repeated use of tools and analysis much easier, eliminates the possibility of human error, and saves time. In our case all GIS analysis will be performed using ArcGIS Pro 2.4. Using ModelBuilder, I was able to develop several tools that quickly run statistical analysis on landscape layers. Python 3 was also used, as it allows further customization of workflows in the ArcGIS environment.
All Landscape Statistic Tool/Workflow
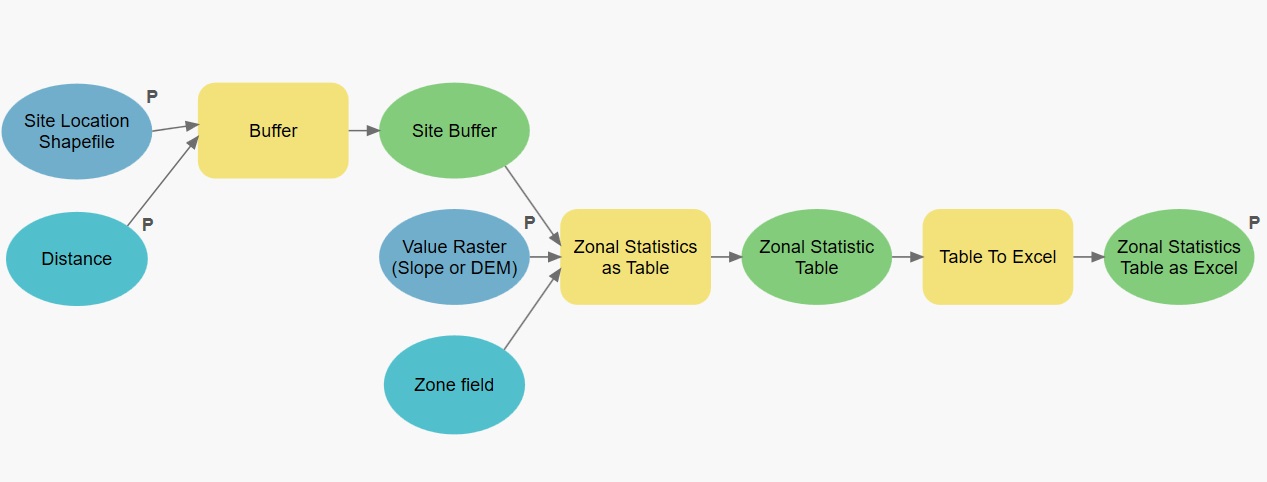
The ModelBuilder screenshot above displays the workflow/tool that I created in order to analyze landscape statistics (Figure 1). The tool allows for the analysis of the surrounding area of each site to produce statistics (mean, range, mode, etc.) of different landscape features (slope, soil, etc.) and output them as an excel file for further analysis and manipulation. For this tool to work a points shapefile with locations of archaeological sites is required. The tool allows you to select the point file, buffer distance, raster layer to be analyzed, and the location of the excel file in your hard drive. The Buffer tool creates what I call an immediate area, which is another way to represent the immediate surrounding area of the site. The immediate area can be chosen through personal preference, research, and through viewshed methods in which the area can be determined using simple mathematics and algebra to find the radius of the immediate area. The Zonal Statistics as a Table tool uses the immediate area to calculate different statistics from the raster files. The table is then turned into an excel file where the information can be manipulated and further analyzed. The Statistic Type can also be chosen from a drop-down menu to make things much simpler for manipulation. For instance, morphology such as elevation would benefit from average statistics, while soil type and lithology can benefit more with variety or majority statistics. You can then combine all the information into one excel file for more analysis that will be discussed later.
LandArch Statistics Tool

The next tool eliminates the need for creating a workflow in ModelBuilder. Instead a python tool was created in order to add complexity to the workflow (Figure 2). The workflow takes the zonal statistics and buffer tools from the previous workflow and performs the same analysis with a few differences to enhance the users experience. One difference that this tool discerns from the last is that the statistical numbers are added to the original site shapefile table and then exported as an excel sheet allowing for rasters in which averages are important, to be added to the excel file rather than having to add each desired statistic one by one to a master excel sheet. The other difference is that you can analyze more than one raster at a time, while the previous workflow only allowed for one layer to be analyzed. This will allow for easier access in future analysis that I will be doing when I perform multicriteria analysis. One limitation of this tool is that the python version of Zonal Statistics as a Table does not allow mode/majority analysis when using ArcPy, limiting the tool to average statistics which is not necessarily the best type for some landscape analysis.
Near Statistics Workflow
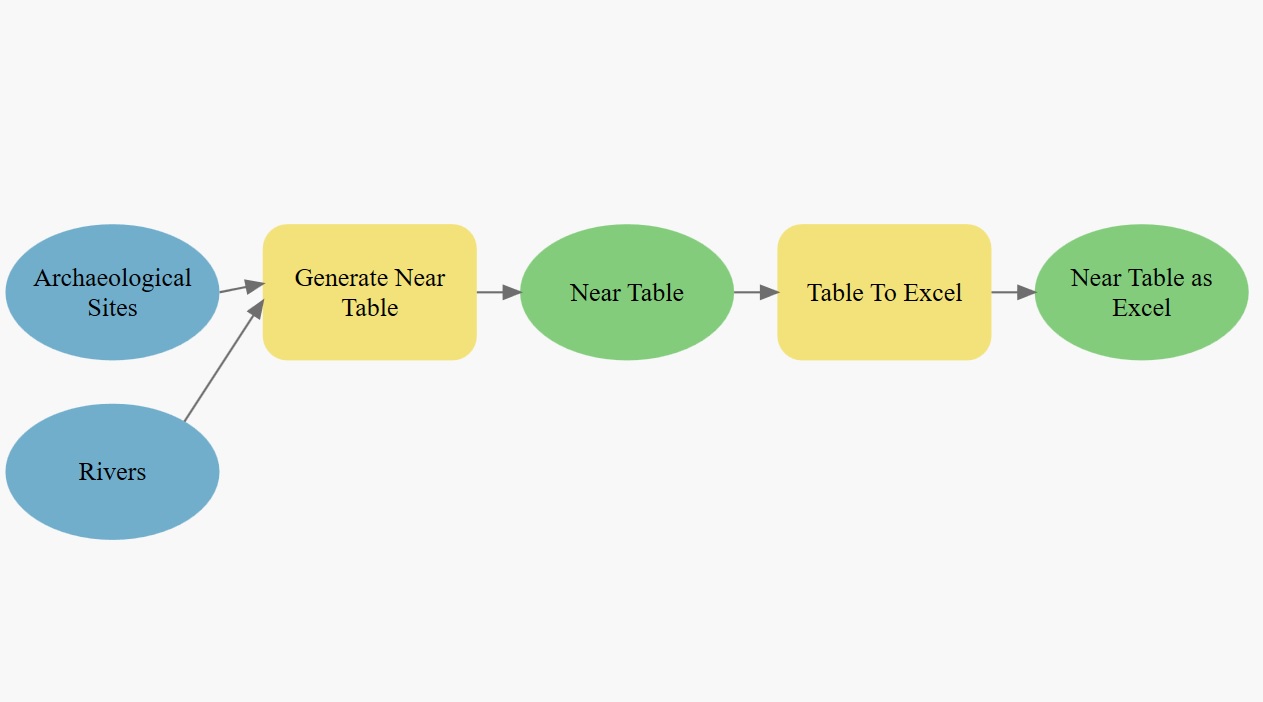
The next statistic tool investigates the distance from one feature to another (Figure 3). The tool finds the nearest feature as the crow flies and determines the distance between these two features. An example of this is the distance from site to water feature. Like the other workflows and tools, the resulting table is converted into an excel table that is typically added to the master excel sheet for further analysis and manipulation.
Conclusion
With these tools that we created we will be able to construct landscape statistics derived from raster layers and develop general landscape statistics for the surrounding area of each site. For our purposes items were kept in excel so that data are easily accessible to all authors of the paper that is in development. The next step is to develop more complex tools for trained GIS professional to use, by allowing the user to remain in the GIS environment rather then switching from ArcGIS Pro to Excel. In our next report we will discuss the different statistics that we use to discern patterns with our case study in Naxos.