
Attribute Driven Hachure Lines
Learning new mapping techniques is a great way to expand cartographic skills, and can increase one’s sense of balance and visual hierarchy for future endeavours. The goal of this project is to develop a base map displaying changes in elevation using hachure lines. I chose to portray the rolling hills of the Cape Breton Highlands National Park (CBHNP), an area of rugged terrain and home to the highest point of elevation in Nova Scotia.
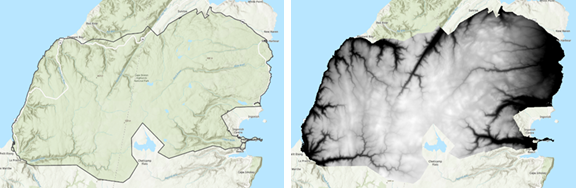
When drawing hachure lines, the first step is to obtain a digital elevation model (DEM) and polygon layer that represent the study area. I obtained a DEM with a 20 by 20 metre resolution from Nova Scotia’s Department of Natural Resources and Renewables, and a polygon layer depicting the border of the CBHNP from the province’s Geographic Data Directory. From here, I used the Extract by Mask tool to isolate the elevation data using the polygon layer as a constraint.
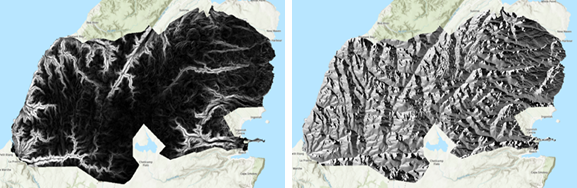
Given the complex topography of the park, the Focal Statistics tool was applied to blur the DEM. Subsequently, all derivative layers will have a more natural appearance with fewer crisp edges. Next, slope and aspect layers are generated to help inform hachure line symbology. The Slope tool calculates the steepness of each cell within the DEM and produces a single-band grayscale raster, while the Aspect tool identifies the compass direction of cells in relation to sloped surfaces. The slope layer will contribute to hachure line length and colour gradient, whereas the aspect layer is used to help define hachure line orientation.
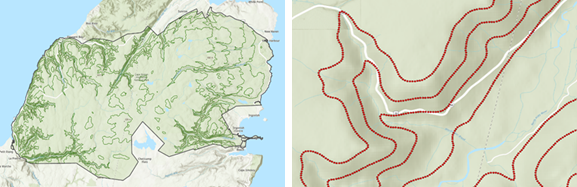
The next stage is to produce contour lines then generate points along them from which the hachures lines will extend. Choosing an appropriate contour interval and point marker spacing took several attempts, but an interval of 100 metres and point spacing of 25 metres displayed changes in elevation without being overly complex. Afterwards, the Extract Multi Values to Points tool was used to populate the point layer attribute table with the ancillary information required to symbolize hachure lines.
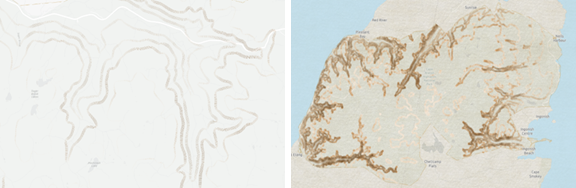
All the hard work is now complete and it is time to tweak hachure symbology. The point shape marker is first switched to a line symbol, serving as the hachure base. Next, the Vary Symbology by Attribute pane is accesses to change all additional properties. The colour and transparency settings are based upon the blurred DEM, the geographic rotation style was centred around aspect values, and the hachure line length was produced from slope values and restricted to a maximum length of 10 pts, eliminating issues with overlap. To add to the antiquated feel of the map, the Parchment and Watercolour paper textures were added from the Living Atlas. Finally, to mask out unwanted base map features, I added a polygon layer that represented the surrounding Atlantic Ocean.
And there you have it, hachure lines that vary from attribute symbology!
References (APA Format)
Esri. (2021, March 17). Parchment Texture [Data set]. https://livingatlas-dcdev.opendata.arcgis.com/maps/nation::parchment-texture/explore?location=0.000000%2C0.000000%2C2.79
Esri. (2021, March 17). Watercolor Paper Texture [Data set]. https://livingatlas-dcdev.opendata.arcgis.com/maps/nation::watercolor-paper-texture-1/about
Government of Nova Scotia. (2006). Enhanced Digital Elevation Model, Nova Scotia, Canada [Data set]. https://novascotia.ca/natr/meb/download/dp055dds.asp
Government of Nova Scotia. (2020, May 27). The Nova Scotia Protected Area System [Data set]. https://nsgi.novascotia.ca/gdd/
Government of Nova Scotia. (2020, December 18). Nova Scotia Topographic Database – Water Features [Data set]. https://nsgi.novascotia.ca/gdd/